Soldiers Crows

5

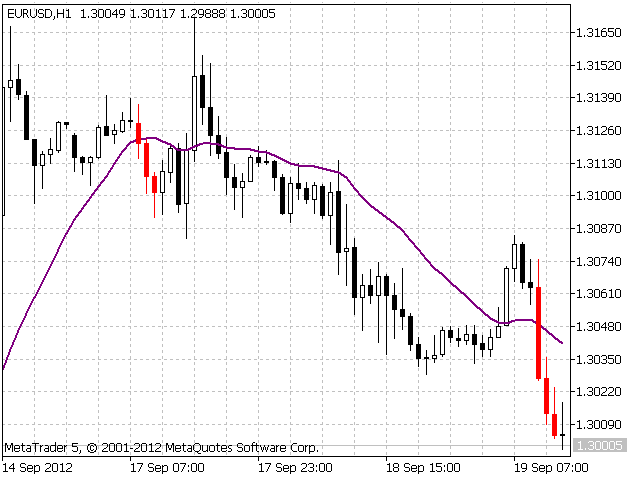
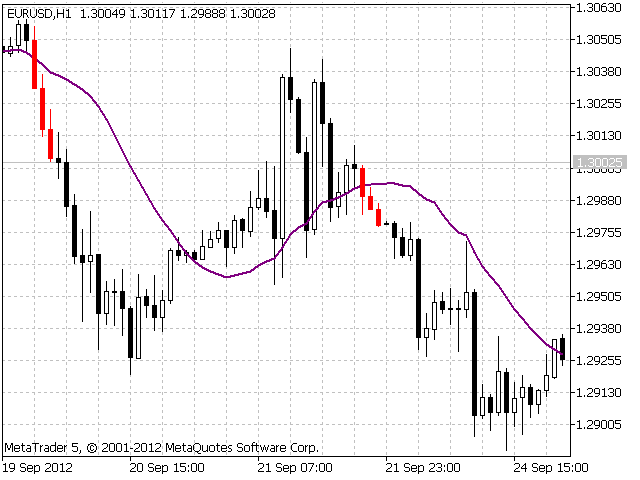
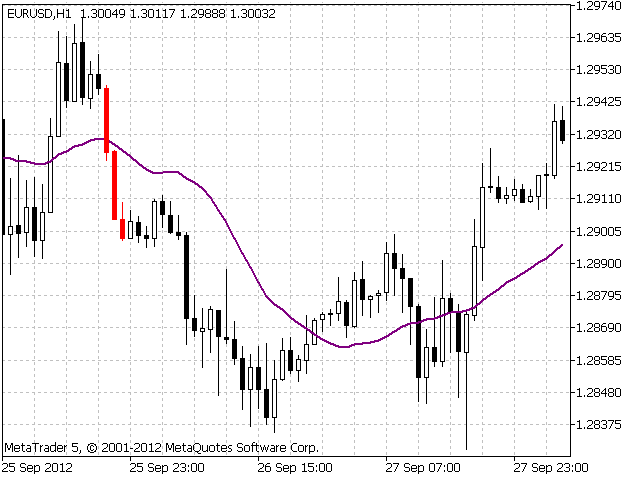
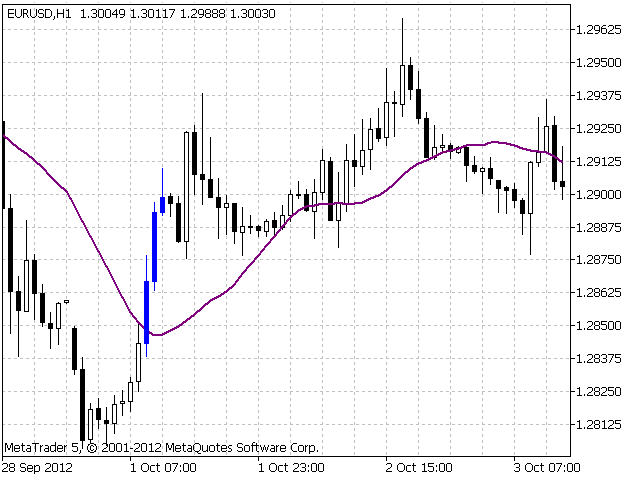
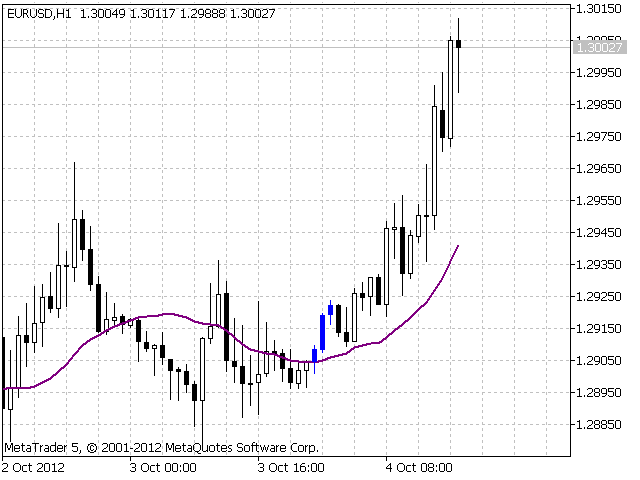
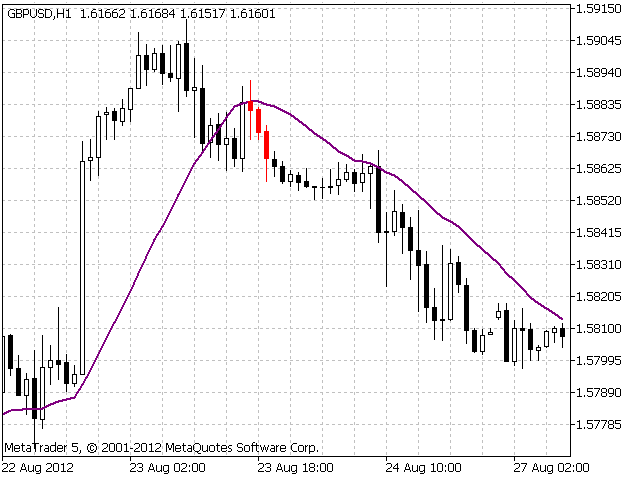
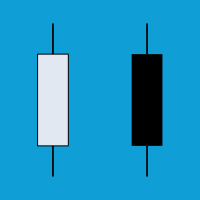
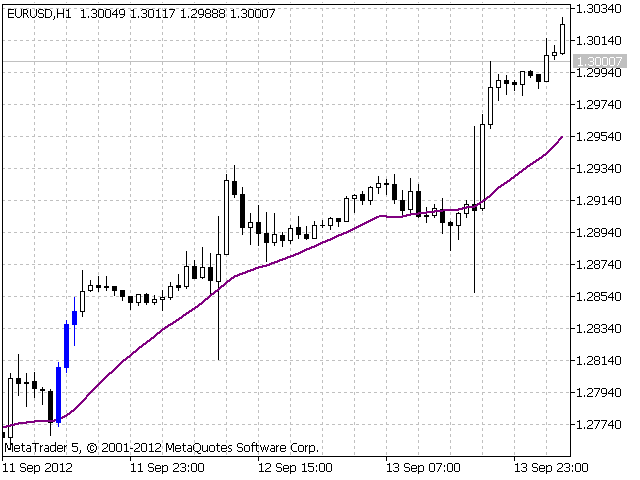
The indicator displays the "Three white soldiers and Three black crows" candlestick model on a chart.

Three white soldiers are color in blue. Three black crows are colored in red.

Input parameters:

  • Max Bars - maximum number of bars calculated on the chart.
  • Make Signal Alert - use alert.
  • Type of pattern rules - use a strict model of determining the pattern (short lower shadows for the three soldiers, short upper shadows for the three crows), or a simplified model.
  • Max Shadow Ratio - coefficient of the length of shadows relative to the main body of a bar (used when the strict model of determining the pattern is selected).
  • Only three in a row - only three consequent bars. Before soldiers - bearish bar. Before crows - bullish bar.
  • Set MA Filter - settings of the filter of crossing the 1-st bar (of 3) by MA.
  • MA Filter Enabled - use the filter of crossing the 1-st bar (of 3) by MA.
  • MA Method - method of averaging of MA.
  • MA Period - period of MA.
  • MA Price Type - type of prices used.
  • Set MACD Filter - settings of the MACD filter.
  • MACD Filter Enabled - use the MACD filter.
  • MACD Fast - fast MA of MACD.
  • MACD Slow - slow MA of MACD.
  • MACD Signal – signal line of MACD.
  • Set DG Filter - settings of the doji filter.
  • DG Filter Enabled - use the doji filter (if one of three bars is doji, the pattern will not be displayed on the chart).
  • Delta Open Close(Pips) - minimum difference between Open and Close prices of a bar in points to detect a doji.
  • Set Grow Filter - settings of the maximal growth filter.
  • Grow Filter Enabled - use the maximal growth filter.
  • Max Grow High-Low (Pips) - maximum difference between High and Low prices of the first and the third bar.

Recommendation on using in combination with the SMA filter:

SL is set on the 'high' level (for the crows) plus a few points, low (for the soldiers) minus a few points of the second bar.

In case the motion of price in the required direction slows down on next bars, or there is a reverse pattern (e.g. Pin Bar), close the position.

The position should also be closed if the price touches the SMA (20).

It is recommended to use the indicator on H1 and higher periods.
Reviews 2
eugene.nz
411
eugene.nz 2024.06.30 21:21 

It is good indicator and very useful. Thank you

Recommended products
Crypto_Forex Indicator "Hanging Man and Inverted Hammer pattern" for MT5, No repaint, No delay. - Indicator "Hanging Man and Inverted Hammer pattern" is very powerful indicator for Price Action trading. - Indicator detects bullish Inverted_Hammer and bearish Hanging_Man patterns on chart: - Bullish Inverted_Hammer - Blue arrow signal on chart (see pictures). - Bearish Hanging_Man - Red arrow signal on chart (see pictures). - With PC alerts and Mobile notification. - With 4 different styles for s
Crypto_Forex Indicator "Breakout Bar pattern" for MT5, No repaint, No delay. - Indicator "Breakout Bar pattern" is very powerful indicator for Price Action trading. - Indicator detects Breakout Bar patterns on chart: - Bullish Breakout Bar pattern - Blue arrow signal on chart (see pictures). - Bearish Breakout Bar pattern - Red arrow signal on chart (see pictures). - With PC alerts and Mobile notification. - Indicator "Breakout Bar pattern" is excellent to combine with Support/Resistance Levels
SR Zones Sync: Support & Resistance Zones with Break-on-Close Logic SR Zones Sync automatically draws support and resistance zones from swing pivots, then recolours them when price actually breaks through. Only a fully closed candle can break a zone, so wicks and the still-forming candle never trigger a false signal. How it works Zones are built by clustering swing highs and lows into price areas. Each zone’s thickness adapts to the average candle range. Each zone gets a role from its latest pi
Crypto_Forex Indicator "Pin Bar & Outside Bar Patterns" for MT5, No repaint, No delay. - Indicator "Pin Bar & Outside Bar Patterns" is very powerful for Price Action trading. - Indicator detects Pin Bar and Outside bar Patterns on chart: - Bullish pattern - Blue arrow signal on chart (see pictures). - Bearish pattern - Red arrow signal on chart (see pictures). - With PC, Mobile alerts. - Indicator "Pin Bar & Outside Bar Patterns" is excellent to combine with Support/Resistance Levels. Click her
Deep State Regime Classifier
Matheus Rodrigues Satriano
Deep State Regime Classifier paints the candles of your chart according to the market regime detected on each closed bar. It is a deterministic, rule-based classifier built on well-known statistics: a rescaled-range estimate of the Hurst exponent, a fractal dimension index (FDI), the standard deviation of price changes and momentum. The same data always produces the same colors. How it works For each closed bar the indicator looks back over a configurable window (default 144 bars) and calculates
Fractal Zones Decision
Pablo Filipe Soares De Almeida
FRACTAL ZONES DECISION – The Indicator That Turns Fractals into Real Decision Zones It identifies Double Fractals (when a candle forms both a bullish and bearish fractal at the same time), creating real zones of market indecision. These zones act as true institutional support and resistance, much stronger than traditional fractals. What the indicator does for you: Draws classic fractals with arrows (can be turned off if desired) Draws special dotted lines highlighting indecision zones (with se
Upper and Lower Reversal - Early forecasting system for reversal points. Allows you to find price reversal points on the boundaries of the upper and lower price movement channels. The indicator will never repaint or change the position of the signal arrows. Red arrows are a buy signal, Blue arrows are a sell signal. Adapts to any time frames and trading instruments The indicator does not repaint, it works only when the candle closes. There are several types of alerts for signals The indicator i
ZigZag3LZZ
Igor Nagorniuk
ZigZag_3LZZ — Three-Level ZigZag Indicator  What It Is For The ZigZag_3LZZ indicator is designed for technical analysis of financial markets. It displays three multi-colored broken ZigZag lines with different periods (5, 13, 34) on the chart, allowing the trader to: Visually identify key price reversal levels Filter out insignificant price fluctuations and market noise Build trend lines based on the latest extremums Automatically calculate Fibonacci levels (0.24, 0.382, 0.5, 0.618, 0.76) Identi
Trend Sniper Follow Clarity, structure and trend control Trend Sniper is a trend analysis indicator designed to offer a clear, orderly and non noisy reading of the medium long term trend. Main strengths Clean and immediate trend reading Simple but powerful hierarchical structure No visual overload on the chart Ideal for Daily, Weekly and Monthly Perfect for swing trading and trend following Helps to stay aligned with the market context, avoiding emotional interpretations Trend Sniper Follow is n
Candle Pattern Scanner
Bruno Goncalves Mascarenhas
Candlestick patterns The candlestick Pattern Indicator and Scanner is designed to be a complete aid tool for discretionary traders to find and analyze charts from powerful candle patterns. Recognized Patterns: Hammer Shooting star Bearish Engulfing Bullish Engulfing Doji Marubozu Scanner Imagine if you could look at all the market assets in all timeframes looking for candlestick signals.
A clean, non-repainting indicator that projects swing high & low levels forward — with automatic broken-level detection and full visual control. The indicator detects relevant price swings using a ZigZag-like logic and projects these levels forward as horizontal rays. Active (unbroken) levels are displayed as solid lines, while broken levels are automatically shown as dashed lines using the same color , keeping the structure clear and visually consistent. The indicator focuses purely on market s
Supply Demand Ranger
Krzysztof Janusz Stankiewic
5 (4)
The indicator draws supply and demand zones. The zone timeframe can be set independently of the chart timeframe. For instance, it is possible to set M5 zones on an H4 chart. The importance of zones can be adjusted using the zone strength parameter. Demand zones are displayed if at least one candle in the range of the zone is entirely above the zone. Similarly, supply zones are displayed if at least one candle within the zone is entirely below the zone.
MTF Trend M1 Colour Candles Buy Sell indicator MT5 MTF Trend M1 Colour Candles is a non-repaint, non-redraw colour candle indicator for MetaTrader 5, built for M1 scalping. It combines a moving average trend filter on the current chart with a multi-timeframe RSI filter, and shows the result directly on the price candles. Developed by Shashikant Jawahar Dhuri, a full-time trader focused on M1 scalping built on multi-timeframe trend. All calculations use closed bars only. The colour of every candl
AutoTrend Pro
Aram Hussein Mohammed
TL Method — Automatic Trendline Detection & Strength Indicator Tired of drawing trendlines manually? TL Method does it for you — automatically detecting, drawing, and scoring trendlines in real time. What it does: Scans up to 1000 bars to find valid support and resistance trendlines Scores each trendline by counting confirmed anchor touches Generates buy/sell signal arrows when price approaches strong trendlines Alerts you via popup, push notification, or sound — with smart cooldown to avoid spa
User Manual: SRO Intelligent Marking System 1. Introduction The SRO indicator is a dynamic drawing tool for MetaTrader 5 designed for Price Action and SMC traders. Its competitive advantage is its visual clarity: it allows you to draw critical levels that project only into the future, preventing lines from crossing the entire chart history. It also automatically labels each object with the timeframe in which it was created. 2. Quick Execution Commands The system operates using hotkeys. Simply
Aurex Fibonacci OTE Zone Smart Market Structure • Fibonacci OTE • CHoCH • Dynamic Swing Tracking Aurex Fibonacci OTE Zone is a professional MT5 chart indicator designed to help traders identify market structure, swing movements, Change of Character (CHoCH), and Fibonacci Optimal Entry (OTE) zones directly on the chart. Instead of manually drawing Fibonacci levels after every market move, the indicator automatically tracks the evolving market structure and updates the relevant Fibonacci levels as
Crypto_Forex Indicator  " Inside Bar & Outside bar   Patterns" for MT5. N o repaint, No delay. - Indicator  " Inside Bar & Outside Bar   Patterns "  is very powerful for Price Action trading. - Indicator detects Inside Bar and  Outside bar Patterns on chart: - Bullish  pattern - Blue arrow signal on chart (see pictures). - Bearish  pattern  - Red arrow signal on chart (see pictures). - Inside Bar itself has High R/R ratio (reward/risk). - With PC & Mobile alerts. - Indicator  " Inside Bar & Ou
FXPRG Smart Trend Break is a signal indicator for MetaTrader 5. It combines price-action analysis with a built-in optimization engine that searches historical closed candles and selects a suitable profile separately for the current symbol and timeframe. The internal optimized settings remain protected. The user sees the resulting signals and performance rate without seeing the selected technical parameters. Main Features Clear BUY and SELL arrows. Entry, Take Profit and Stop Loss levels. Signals
CandleStick Pattern Indicator MT5
Driller Capital Management UG
5 (1)
This is a simple Candle Stick Pattern Indicator, which shows in the current time period all standardisized Patterns in the chart. All Patterns will be calculatet automatically based on standard conditions. Following Candle Stick Patterns are included: Bullish Hammer | Bearish Hammer Bullish Inverted Hammer | Bearish Inverted Hammer Bullish Engulfing | Bearish Engulfing Piercing | Dark Cloud Cover Bullish 3 Inside | Bearish 3 Inside There are only a few settings at the begining to take. Every Pat
FREE
Quantum SuperTrend AI is an indicator with AI-powered intelligent signal filtering: the indicator analyzes market conditions, filters out part of weak impulses, and helps traders see a cleaner market picture without unnecessary noise. Quantum SuperTrend AI is a professional trading indicator for MetaTrader 5, created for traders who need a clear visual tool for trend analysis, trading signals, and control of possible exit zones. User Guide The name Quantum SuperTrend AI reflects the core idea
LevelPAttern MT5 is a technical indicator based on the daily levels and Price Action patterns. The indicator is based on the standard ZigZag indicator + reversal candlestick pattens, such as Star, Hammer (also knows as Pin bar), Engulfing and others. The indicator generates audio and text notifications when a pattern is formed and a level is touched. It also supports sending email and push notifications. Indicator operation features It is suitable for working with any CFD and FOREX trading inst
Support: Profit Smasher 24/7 AI Assistant Disclaimer Liquidity Mapper Pro is an analytical tool for educational and informational purposes only. It does not provide financial advice or guaranteed signals. All trading carries risk, including potential loss of capital. Past performance does not guarantee future results. You are solely responsible for your trading decisions.
CasperIT Z-Score Intelligence MT5 CasperIT Z-Score Intelligence is a professional market stretch indicator for MetaTrader 5. It uses Z-Score analysis to measure how far price has stretched from its statistical mean and presents the result through a clean institutional dashboard. The indicator is designed to help traders identify overbought, oversold, stretched, and extreme market conditions. It does not open trades. It provides market context, probability guidance, regime classification, and v
Levels for MT5 by OptionClue
Alexander Mihaylenko
5 (1)
The Levels indicator has been created to simplify the process of plotting support and resistance levels and zones on selected timeframes. The indicator plots the nearest levels of the selected timeframes, which are highlighted in different colors. It significantly reduces the time needed to plot them on the chart and simplifies the market analysis process. Horizontal support and resistance levels are used to identify price zones where the market movement can slow down or a price reversal is like
Pips On Candles
Giuseppe Nittoli
Pips on Candles shows the number of pips involved in each candle on the chart. It is possible to set 3 different ranges for counting on each single candle via the RangeType parameter: With "HighLow" you count the pips present between the minimum and the maximum. The number is shown under each candlestick on the chart. With "OpenClose" you count the pips present between the opening and closing price of the candle. The number is shown under each candlestick on the chart. With "HighDistAndLowDist"
The indicator displays the "Morning star" and "Evening star" patterns on a chart. The Evening star is displayed in red or rose. The Morning star is displayed in blue or light blue. Input Parameters: Max Bars – number of bars calculated on the chart. Make Signal Alert – use alerts. Send Push Notification - send notification to a mobile terminal Type of rules pattern – type of the model of pattern determination (Hard – with the control of length of shadows of the second bar). If Soft is selected
Elliott Wave Drawing Tool for MT5 – The Ultimate Professional Wave Mapping System Take your market analysis to the next level with the Elliott Wave Drawing Tool for MT5 , an advanced charting solution designed for traders who demand precision, speed, and complete control in wave labeling. Engineered for both beginners and expert Elliotticians, this tool transforms manual wave marking into a smooth, intuitive, and highly accurate experience. Built with a smart drawing engine , this indicator lets
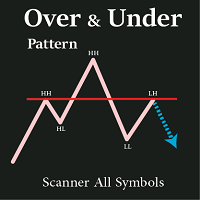
This is the Full Version, to get the free version please contact me. The free version works on “USDJPY” charts. All symbols and time frames scanner. Contact me after payment to send you the User-Manual PDF File. OVER and UNDER Over & Under pattern is an advanced price action trading concept in the trading industry. The Over & Under pattern is more than a confluence pattern or entry technique than a trading strategy. It is a reversal pattern that is created after a significant obvious trend. It
Breakthrough signal indicator for the MT5 platform: Your reliable assistant in the world of trading! We are pleased to present you with an innovative signal indicator, which was created in collaboration with an outstanding mathematician. This indicator combines advanced algorithms and the best of the world of mathematical analysis, providing traders with a unique tool for predicting market movements. Why is this indicator unique? 1 .Entry signals without redrawing If a signal appears, it sta
Buyers of this product also purchase
Trend Sniper X
Sarvarbek Abduvoxobov
4.86 (44)
Trend Sniper X is a multi-timeframe trend-following indicator for MetaTrader 5 that helps traders identify trend direction and potential reversal points with clarity and precision. for MT4: https://www.mql5.com/en/market/product/193245 Price Information: The current price is promotional and is subject to change as upcoming updates and new features are released. Bonus Offer: To get the FREE Auto-Trade Assistant EA for this indicator, please message the author after purchasing. Code2Profit Channe
A new King in town - Indicator + Order management indications(tp1+tp2+tp3) + Optional Telegram Signal sender   INCLUDED (FREE) + Bonus EA Robot ( FULL TRADING  and SIGNAL SYSTEM ) Our best EA for Gold: Gold Slayer TRY > Reversion Queen  Expert advisor >JOIN Community Channel < NEW Free Automation EA link < click here ( disclaimer: this is new and still on testing and phase , use at your risk on demo) Free Telegram Bridge < click here  This indicator includes an advanced Strategy, a trading sys
Entry Points Pro shows you where to enter, where to put the stop and what lot to trade — before you place the order. PRICE Now 199 USD: 8 copies at this price, then 249 USD. The final price is 349 USD. I make my money trading the markets, and I show it, so I don't need to sell this indicator to everyone. It is a tool for traders who think for themselves, not a magic button. No breakout, no trade. A gray arrow is a cancelled signal: price did not break the signal candle, so there was no entry
M5 Sniper
MeanFX
5 (4)
Get your trading edge in the line of sight M5 Sniper   is a new indicator by MeanFX. It combines   precise trading signals   with   adaptive TP/SL levels   - creating best possible statistical trades as a result! The price increases every 5 purchases, the next price is 79$ Message me after purchase to receive tips/guide and bonus EA plus trading methodology Auto Optimisation only works on LIVE chart , needs data feed >JOIN Community Channel < What makes it stand out?   Proven statistical per
Gann Made Easy   is a professional and easy to use Forex trading system which is based on the best principles of trading using the theory of W.D. Gann. The indicator provides accurate BUY and SELL signals including Stop Loss and Take Profit levels. You can trade even on the go using PUSH notifications. PLEASE CONTACT ME AFTER PURCHASE TO GET TRADING  INSTRUCTIONS   AND GREAT EXTRA INDICATORS  FOR FREE! Probably you already heard about the Gann trading methods before. Usually the Gann theory is a
Ultra Indicator
Ihor Otkydach
5 (1)
ULTRA is a technical indicator that operates on an “all-in-one” basis—it independently analyzes the market, generates trading signals, displays levels for setting stop-loss orders, and suggests when to close trades to lock in profits or minimize losses. In other words, it doesn't matter if you don't know how to analyze the market, determine levels—where to set your stop-loss—or struggle with money management. ULTRA will do all of that for you! BUYER BONUS: After purchasing the ULTRA indicator, s
SuperScalp Pro
Van Minh Nguyen
4.54 (37)
SuperScalp Pro - Professional Multi-Layer Confluence Scalping System SuperScalp Pro is an advanced scalping indicator that upgrades the classic Supertrend with multiple intelligent confirmation filters. It helps you identify higher-probability Buy/Sell opportunities while significantly reducing false signals. Clear Buy and Sell arrows appear directly on the chart, along with automatic ATR-based Stop Loss and Take Profit levels calculated in real time. After purchase, please message me on MQL5 to
SMC Intraday Formula
VividMind Digital Solutions
5 (26)
Secure the Lowest Price Today. After purchase, contact via   MQL5 inbox   to receive your buyer kit and bonus. Let's be honest first. No indicator will make you profitable on its own. If someone tells you otherwise, they're selling you a dream. Every indicator that shows perfect buy/sell arrows can be made to look flawless — just zoom into the right window of history and screenshot the winners. We won't do that. SMC Intraday Formula is a tool. It reads the market structure for you, maps the hig
Gold Trend Coach MT5
Cristhian Alexander Gaibor Cuasquer
4.27 (11)
Non-repainting buy and sell signals for gold (XAUUSD) on MetaTrader 5. Every signal comes with a stop loss and three take profits. A Smart Money Concepts filter with BOS and CHoCH, so you trade with the structure, not against it. A live Mentor on your panel that guides every step from the entry to TP3. And alerts straight to your phone and your own Telegram channel. That is Gold Trend Coach. Never trade alone again. FREE BUYER KIT with your purchase: 1. Telegram Alert Bridge: your signals go to
Boba Analysis Suite
Trade Ready Solutions LLC
5 (2)
Boba Analysis Suite Boba Analysis Suite is an analytical indicator for MetaTrader 5. It brings market structure, relevant price zones and broader market context together in a single chart view. Developed through practical experience as a trader and trading coach, it supports a structured analysis process: assessing market direction, identifying important levels and considering multiple timeframes together. Analysis in Context Individual signals gain meaning through context. Boba Analysis Suite h
FX Power MT5 NG
Daniel Stein
5 (33)
FX Power: Analyze Currency Strength for Smarter Trading Decisions Overview FX Power is your go-to tool for understanding the real strength of currencies and Gold in any market condition. By identifying strong currencies to buy and weak ones to sell, FX Power simplifies trading decisions and uncovers high-probability opportunities. Whether you’re looking to follow trends or anticipate reversals using extreme delta values, this tool adapts seamlessly to your trading style. Don’t just trade—trade
FiboSniper Pro
Van Minh Nguyen
5 (4)
FiboSniper Pro - Multi-Filter Fibonacci System with Auto SL/TP and Control Panel FiboSniper Pro is a technical indicator that combines dynamic Fibonacci Envelopes with multiple confirmation filters to generate selective Buy and Sell signals. Fibonacci levels are calculated from Moving Average and ATR, then filtered by ADX, EMA, RSI, ATR, Volume, Time and Candle structure. The indicator displays automatic ATR-based Stop Loss and Take Profit levels directly on the chart, along with an interactive
M1 Sniper MT5
Oleg Rodin
5 (7)
M1 SNIPER  is an easy to use trading indicator system. It is an arrow indicator which is designed for M1 time frame. The indicator can be used as a standalone system for scalping on M1 time frame and it can be used as a part of your existing trading system. Though this trading system was designed specifically for short-term trading, it still can be helpful for all traders. This trading system can be used with any forex pair and time frame, though lower time frames are recommended from M1 up to M
Apex Patterns PRO Buy Indicator - Get Expert Advisor Based on it for FREE. Self-Optimizing Chart Pattern & Breakout Intelligence Traditional pattern scanners rely on fixed inputs, often underperforming when market volatility and structures shift. Apex Patterns PRO is designed to adapt to changing market conditions by combining structural chart pattern recognition, momentum filtering, and statistical self-optimization into one analytical framework. Adaptive Scanning Engine Self-Optimizing Patter
SQN Max indicator for MT5 by ITC
Renaud Herve Francois Candel
Sqn Max Indicator Sqn Max is an exclusive indicator to trade the market with high effectiveness. The indicator is based on price action, volatility and trend. This indicator is as simple as possible but not too simple. The indicator can generate alerts to ease the trading process. You don't have to stay all day in front of your screen. The indicator can be used with any class of assets and with any time frame. It is possible to achieve better results trading our list of selected assets. We achi
Adaptive Price Action Engine Buy Indicator- Get EA Based on it for FREE. Self-Optimizing Multi-Timeframe Trend & Candlestick Intelligence Markets do not behave the same way all the time—and not every price-action pattern has the same value in every market regime. Adaptive Price Action Engine is designed to adapt to changing market conditions by combining trend structure, multi-timeframe analysis, candlestick patterns, and statistical optimization into one analytical framework. Two Adaptive Mode
Welcome to Entry In The Zone & SMC Multi Timeframe —  COMPLETE SMC ANALYSIS SYSTEM — ALL IN ONE INDICATOR Entry In The Zone & SMC Multi Timeframe  An indicator designed for market analysis based on Smart Money Concepts (SMC), displaying Market Structure, Key Zones (Order Blocks, Supply & Demand Zones, and Fair Value Gaps), Liquidity, and real-time BUY / SELL signals. It supports both Single-Timeframe and Multi-Timeframe analysis, along with the Confluence at Zone feature, which helps you evaluat
Divergence Bomber
Ihor Otkydach
4.89 (94)
Each buyer of this indicator also receives the following for free: The custom utility "Bomber Utility", which automatically manages every trade, sets Stop Loss and Take Profit levels, and closes trades according to the rules of this strategy Set files for configuring the indicator for various assets Set files for configuring Bomber Utility in the following modes: "Minimum Risk", "Balanced Risk", and "Wait-and-See Strategy" A step-by-step video manual to help you quickly install, configure, and
Power Candles MT5
Daniel Stein
4.58 (12)
Power Candles - Self-Optimizing Strength Indicator Strength usually lives in a sub-window. The line runs below, the candle above, and your eye keeps connecting the two. Power Candles puts the strength into the candle itself, colored from dark red to dark green, so the chart reads at a glance and the sub-window stays closed. The indicator also finds its own settings for the symbol and timeframe in front of you. One click on [ Apply Best ] draws entry, Stop Loss and Take Profit at the exact prices
Currency Strength Wizard   is a very powerful indicator that provides you with all-in-one solution for successful trading. The indicator calculates the power of this or that forex pair using the data of all currencies on multiple time frames. This data is represented in a form of easy to use currency index and currency power lines which you can use to see the power of this or that currency. All you need is attach the indicator to the chart you want to trade and the indicator will show you real s
Crystal Heikin Ashi Signals
Muhammad Jawad Shabir
5 (5)
Crystal Heikin Ashi Signals—Professional Trend & Signal Detection Indicator Advanced Heikin Ashi Visualization with Intelligent Signal System for Manual & Automated Trading Final Price: $149 ---------> Price goes up $10 after every 10 sales . Limited slots available — act fast . Overview User Guide PDF Crystal Heikin Ashi Signals is a professional-grade MetaTrader 5 indicator that combines pure Heikin Ashi candle visualization with an advanced momentum-shift detection system. Designed for both m
Auto Optimized SpeedAngle is an institutional-grade momentum vectoring system that eliminates curve-fitting through continuous Walk-Forward Optimization (WFO). Rather than relying on static inputs that degrade when market regimes shift, the indicator dynamically recalibrates its parameters using Out-of-Sample (OOS) validation, ensuring the displayed signals represent genuine statistical edges rather than historical anomalies. By shifting the focus from subjective visual angles to normalized, qua
Multi Currency Strength and Momentum Indicator MT5 Dynamic Forex28 Navigator is the evolution of our long-time, popular indicators, combining the power of five in one: Advanced Currency Strength28 Indicator (700 reviews) Advanced Currency IMPULSE with ALERT (530 reviews) Currency Strength EXOTICS GOLD Impulse with Alert CS28 Combo Signals (recent Bonus) No need to buy four indicators and stack them on your charts. All of it is merged into one powerful indicator: the strength of the 28 Forex pair
Azimuth Pro
Ottaviano De Cicco
5 (7)
Azimuth Pro V2: Synthetic Fractal Structure and Confirmed Entries for MT5 Overview Azimuth Pro is a multi-level swing structure indicator by Merkava Labs . Four nested swing layers, swing-anchored VWAP, ABC pattern detection, three-timeframe structural filtering, and closed-bar confirmed entries — one chart, one workflow from micro-swings to macro-cycles. This is not a blind signal product. It is a structure-first workflow for traders who care about location, context, and timing. 1. What Change
DayTrader PRO
Davit Beridze
5 (4)
DayTrader PRO (Buy DayTrader PRO and get Another Paid Self Optimizing indicator for FREE as BONUS!) DayTrader PRO is an advanced trading indicator that combines John Ehlers' Laguerre Filter with a powerful Auto-Optimization Engine. Instead of using fixed parameters, the indicator automatically searches for the best settings based on recent market conditions, helping you adapt to changing volatility without constant manual adjustments. The indicator generates clear BUY and SELL signals together
ARICoins
Temirlan Kdyrkhan
ARICoin is a powerful trading companion designed to generate high-probability entry signals with dynamic TP/SL/DP levels based on volatility. Built-in performance tracking shows win/loss stats, PP1/PP2 hits, and success rates all updated live. Key Features: Buy/Sell signals with adaptive volatility bands Real-time TP/SL/DP levels based on ATR Built-in MA Filter with optional ATR/StdDev volatility Performance stats panel (Success, Profit/Loss, PP1/PP2) Alerts via popup, sound, push, or email Cust
FX Trend MT5 NG
Daniel Stein
5 (6)
FX Trend NG: The Next Generation Multi-Market Trend Intelligence Overview FX Trend NG is a professional multi-timeframe trend and market monitoring tool designed to give you a complete structural overview of the market in seconds. Instead of switching between dozens of charts, you instantly see which symbols are trending, where momentum is fading, and where strong alignment exists across timeframes. This tool is part of the Stein Investments ecosystem: setup guides, videos, workshops and Max,
PZ Swing Trading MT5
PZ TRADING SLU
5 (5)
Protect against whipsaws: revolutionize your swing trading approach Swing Trading is the first indicator designed to detect swings in the direction of the trend and possible reversal swings. It uses the baseline swing trading approach, widely described in trading literature. The indicator studies several price and time vectors to track the aggregate trend direction and detects situations in which the market is oversold or overbought and ready to correct. [ Installation Guide | Update Guide | Tro
FX Volume MT5
Daniel Stein
4.79 (24)
FX Volume: Experience Genuine Market Sentiment from a Broker’s Perspective Quick Overview Looking to elevate your trading approach? FX Volume provides real-time insights into how retail traders and brokers are positioned—long before delayed reports like the COT. Whether you’re aiming for consistent gains or simply want a deeper edge in the markets, FX Volume helps you spot major imbalances, confirm breakouts, and refine your risk management. Get started now and see how genuine volume data can
Profit from market structure changes as price reverses and pulls back. The Market Reversal Alerts indicator identifies when a trend or extended price move is approaching exhaustion, alerts you the moment market structure shifts, and confirms the entry when price re-tests the reversal zone, so you trade defined areas instead of guesses. How it works As price forms new highs or lows near potential exhaustion points, the indicator identifies the breakout and momentum, then draws a rectangle on the
More from author
HL D1 Move
Alexey Topounov
3 (1)
The indicator displays the dynamics of forming the daily range in the form of a histogram, and the average daily range for a specified period. The indicator is a useful auxiliary tool for intraday trades. Settings N Day - period for calculation of the daily range value. Level Indefinite - level of indefiniteness. Level Confidence - level of confidence. Level Alert - alert level. When it is crossed, the alert appears.
FREE
Reverse Bar
Alexey Topounov
The Reverse Bar indicator paints the reversal bars according to trade strategy, described by Bill Williams in "Trading Chaos. Maximize Profits with Proven Technical Techniques" book. The bearish reversal bar has red or pink color (red-stronger signal) The bullish reversal bar has blue or light blue color(blue - stronger signal) It is recommended to use it on hourly timeframe (H1) and higher.
Pin Bar
Alexey Topounov
5 (1)
This indicator shows Pin Bar candlestick pattern on the chart. The bearish pin bars have red color, the bullish pin bars have blue color. The indicator shows alert when Pin Bar candlestick pattern is formed. It's recommended to use it at timeframes H1 and higher. The best moment (strong signal) is when Pin Bar is formed close to the support/resistance level.
The indicator displays the "Morning star" and "Evening star" patterns on a chart. The Evening star is displayed in red or rose. The Morning star is displayed in blue or light blue. Input Parameters: Max Bars – number of bars calculated on the chart. Make Signal Alert – use alerts. Send Push Notification - send notification to a mobile terminal Type of rules pattern – type of the model of pattern determination (Hard – with the control of length of shadows of the second bar). If Soft is selected
Angulation
Alexey Topounov
According to Bill Williams' trading strategy described in the book "Trading Chaos: Maximize Profits with Proven Technical Techniques" the indicator displays the following items in a price chart: 1.Bearish and bullish divergent bars: Bearish divergent bar is colored in red or pink (red is a stronger signal). Bullish divergent bar is colored in blue or light blue color (blue is a stronger signal). 2. "Angulation" formation with deviation speed evaluation. 3. The level for placing a pending order (
Synthetic Reverse Bar
Alexey Topounov
5 (2)
Synthetic Reverse Bar is an evolution of Reverse Bar indicator. It is well-known that candlestick patterns work best at higher timeframes (H1, H4). However, candlesticks at such timeframes may form differently at different brokers due to dissimilarities in the terminal time on the single symbol, while the history of quotes on M1 and M5 remains the same! As a result, successful patterns are often not formed at higher timeframes! Synthetic Reverse Bar solves that problem! The indicator works on M5
Bullish Bearish Volume is an indicator that divides the volume into the bearish and the bullish part according to VSA: Bullish volume is a volume growing during upward motion and a volume falling during downward motion. Bearish volume is a volume growing during downward motion and a volume falling during upward motion. For a higher obviousness it uses smoothing using MA of a small period. Settings: MaxBars – number of bars calculated on the chart; Method – smoothing mode (Simple is most preferab
Trading Sessions Pro is a trading session indicator with extended settings + the ability to install and display the custom period. Main Advantages: The indicator allows you to conveniently manage display of trading sessions on the chart. There is no need to enter the settings each time. Just click the necessary trading session in the lower window and it is highlighted by the rectangle on the chart! The indicator has two modes of defining the trading terminal's time offset relative to UTC (GMT).
VWAP is Volume Weighted Average Price. It is calculated as addition of products of volume and price divided by the total volume. This version of the indicator is universal as it has three modes of operation: Moving - in this mode the indicator works as a moving average. But unlike ordinary SMA it has smaller lags during big movements! Bands of square deviation can be used in the same way as Bollinger Bands. Period - in this mode the calculations are performed from the start to the end of period
Divergence MACD indicator shows price and MACD indicator divergence. The indicator is not redrawn! The algorithm for detection of price and MACD extremums has been balanced for the earliest entry allowing you to use the smallest SL order possible. The indicator displays all types of divergences including the hidden one, while having the minimum number of settings. Find out more about the divergence types in Comments tab. Launch settings: Max Bars - number of bars calculated on the chart. Indent
Вертикальная гистограмма объема -  отображает распределение объема по уровням. Гистограмма рассчитывается от объема ( реального или тикового), при этом объем соответствующий бару переносится на уровень H-L бара. Таким образом, при распределении объема за сутки по вертикали - формируются максимумы гистограммы показывающие области проторговки. Настройки индикатора: Timeframe Set -  период в пределах которого производится расчет. (рекомендуется D1) Step's - количество отображаемых периодов. Amplitu
Hurst Fractal Index Фрактальный Индекс Херста -  показатель персистентности временного ряда При значении индикатора >0.5 временной ряд считается персистентным (тенденция сохраняется) При значениях индикатора явно < 0.5 временной ряд считается антиперсистентным (возможна смена направления движения) Для наглядности значения индекса усредняются периодом 2-3. Настройки индикатора: Max Bars -  глубина истории расчета (кол-во баров на графике для которых произведён расчет) Data from Timeframe - исполь
The indicator forms a range based on the first 5-minute candle of the New York trading session open (9:30-9:35 New York time). The upper boundary is continued with a blue ray, the lower one with a red ray. A range breakout by an imbalance is highlighted in yellow and accompanied by an alert. If, after the imbalance forms, an absorption (engulfing) bar forms in the direction of the breakout, such a bar is highlighted on the chart in Red for SELL and Blue for BUY and is also accompanied by an Aler
Support and resistance zones indicator. Built from fractals collected over a specified period of history. Processes the data and highlights the most effective support and resistance zones. IMPORTANT! Set "Number of bars for calculation" to at least 1000 bars for D1, and to more than 3000 bars for lower timeframes. Histogram calculation Number of bars for calculation   — how many closed bars of the calculation timeframe are used to find fractals and build the histogram. More bars means more hist
Filter:
eugene.nz
411
eugene.nz 2024.06.30 21:21 

It is good indicator and very useful. Thank you

Morteza Ghiasi
516
Morteza Ghiasi 2023.08.04 18:25 

User didn't leave any comment to the rating

Reply to review