Fabii Coral Trend

Know your trend bias on two timeframes at once — no repaint, signals final on bar close.
Any pair, any timeframe, any market. Free demo in the Strategy Tester.


>> Get more free and premium indicators here
Baseline, volatility, oscillators & more.
No repainting. No guessing. Just clean signals.


▬▬▬ THE PROBLEM ▬▬▬

You know the chart-timeframe trend. But you do not know whether the higher timeframe agrees — until you flip to it, then flip back, and the moment is gone. Entering with the short-term trend against a hidden higher-timeframe reversal is how clean setups turn into unexpected losers. Every bar you misread the bias is a trade you size wrong.


▬▬▬ THE SOLUTION ▬▬▬

Fabii Coral Trend Baseline puts both timeframes on the same chart at the same time. One smooth line for your chart timeframe, one staircase baseline for the higher timeframe. Green means rising, red means falling, blue means flat — both lines, same palette, same glance.


▬▬▬ HOW IT WORKS ▬▬▬

The indicator runs a six-pole recursive filter on the closing price — a mathematically smooth curve that removes noise without lagging behind sharp moves. The same filter runs independently on the higher timeframe you choose, displayed as a staircase that updates only on closed higher-timeframe bars. When both lines point the same way, the bias is clear. A buy or sell arrow appears at each confirmed flip on the chart-timeframe baseline, anchored to the line itself. Optional trend-coloured candles (full body, thin wicks) reinforce the current direction directly on the price chart.


▬▬▬ KEY FEATURES ▬▬▬

  • Six-pole recursive trend filter — which means you get a smooth, readable line even on noisy pairs like XAUUSD or crypto.
  • Direction colouring: green / red / blue — which means you read bias in under a second without checking numbers.
  • Higher-timeframe baseline (any TF you choose) — which means you see short-term and long-term bias on one chart, which removes one chart-switching step from every trade decision.
  • Buy / sell arrows on confirmed trend flips — which means you never miss a direction change while watching another instrument.
  • Optional trend-coloured candles — which means confluence between the line, the arrows and the bars is visible at a glance.
  • Popup, sound and push alerts on flip — which means you get notified even when MetaTrader is in the background.
  • No repaint — signals are final on bar close. The live bar always shows a provisional dotted line, clearly separate from the confirmed signal.
  • Works on any pair, any timeframe, any market (forex, indices, metals, crypto, stocks).
  • No DLL, no external dependency.
  • EA-readable: the chart-TF baseline value and the HTF baseline value are both accessible from buffer 0 and buffer 4.


▬▬▬ INPUTS ▬▬▬

Parameter Description Default
Smoothing Period Controls how smooth the baseline is. Higher = smoother, more lag. 21
Damping Constant Controls the filter damping (0 to 1). Affects curve shape. 0.4
Color Up Colour of the rising baseline, arrows and candles. LimeGreen
Color Down Colour of the falling baseline, arrows and candles. Red
Color Flat Colour when direction is neutral. RoyalBlue
Higher Timeframe Timeframe for the second baseline. PERIOD_CURRENT = off. PERIOD_CURRENT
Show Arrows Enable buy/sell arrows on confirmed flips. true
Arrow Offset ATR Distance between the baseline and the arrow, in ATR units. 0.5
ATR Period Period of the internal ATR used for arrow spacing. 14
Color Candles Colour candles with the trend direction (full body, thin wicks). false
Alert Popup Show a popup alert on trend flip. false
Alert Sound Play a sound on trend flip. false
Alert Push Send a push notification on trend flip. false
Sound File Name of the sound file for alerts. alert.wav
Use Bars Limit Restrict computation to the N most recent bars. true
Max Bars Number of bars to compute when the limit is active. 500


▬▬▬ HOW TO USE IT ▬▬▬

  1. Attach the indicator to any chart. Set the Higher Timeframe input to a timeframe above your chart (example: D1 on an H4 chart).
  2. Wait for both baselines to point the same colour. Same direction = aligned bias = higher-probability context.
  3. A flip arrow on the chart-TF baseline confirms a direction change on your timeframe.
  4. Use the coloured candles as a visual confirmation layer: when candles, the chart-TF baseline and the HTF baseline all share the same colour, the setup is clear.
  5. Set alerts to be notified when a flip occurs, without watching the screen.


▬▬▬ PROOF — WHY TRUST IT ▬▬▬

No repaint: the signal buffer is blanked on the live bar and is only written when the bar closes. You can verify this directly in the Strategy Tester (no live data required). The Strategy Tester runs the indicator on historical bars exactly as it would in real time — attach it, run it, and check that arrows appear only on closed bars. I answer support messages within 24 hours.


▬▬▬ PART OF THE FABII SUITE ▬▬▬

More tools for your system — baselines, volatility filters, oscillators and more — at:
mql5.com/en/users/fabienfxtrades/seller


▬▬▬ RATING ▬▬▬

Question or issue? Message me first — I answer within 24 hours and fix fast. If this indicator saved you time on a few trades, a short review helps other traders find it. Even one line makes a difference. Say which pair and timeframe you use it on.


▬▬▬ GET IT ▬▬▬

Get it now and have it on your charts in 2 minutes. Test it free in the Strategy Tester first, on your own charts and your own pairs. Launch price is $30 and will rise after the first sales. I answer within 24 hours.

(Compatible with MetaTrader 5. No DLL required.)

Follow my profile for future releases: mql5.com/en/users/fabienfxtrades/seller

Prodotti consigliati
Follow The Line MT5
Oliver Gideon Amofa Appiah
4.6 (35)
This indicator obeys the popular maxim that: "THE TREND IS YOUR FRIEND" It paints a GREEN line for BUY and also paints a RED line for SELL. (you can change the colors). It gives alarms and alerts of all kinds. IT DOES NOT REPAINT and can be used for all currency pairs and timeframes. Yes, as easy and simple as that. Even a newbie can use it to make great and reliable trades. NB: For best results, get my other premium indicators for more powerful and reliable signals. Get them here: https://www.m
FREE
Smart Entry Hulk KPG
Le Uyen Phuong Nguyen
Smart Entry Hulk KPG – Indicatore MTF H-Band e Trend per MT5 Descrizione Generale Smart Entry Hulk KPG è un indicatore di analisi tecnica sviluppato da Billion KPG Club per MetaTrader 5. Combina le caratteristiche di livellamento di H-Band con la logica direzionale dell'algoritmo Trend. Applicando il calcolo Trend ai dati livellati di H-Band, questo strumento mira a filtrare il rumore di mercato e a fornire rappresentazioni visive chiare delle direzioni del trend. Dispone di una dashboard Multi
FREE
Two EMA-difference histograms with confirmed crossover labels and historical BUY and SELL boxes. Ospe Dual MACD plots two MACD-style EMA differences in one separate window: a 12/26 pair and a 5/13 pair by default. It displays colored histograms and matching lines. The color of each histogram changes with its position relative to zero and its movement from the preceding bar. When the faster difference crosses above the slower difference on a completed candle, the indicator places a green BUY box
FREE
The   OHLC indicator   shows the current and historical values of High, Low, Open, Close and Mid for a specific time period. It can plot the current values or the values from the previous session. The indicator's range can be calculated from a daily, weekly, monthly, or user-specified session. Levels High  of the current or previous session. Low  of the current or previous session. Open  of current or previous session. Close  of the current or previous session. Midpoint  of the current or prev
FREE
Bollinger Bands Technical Indicator (BB) is similar to envelopes. The only difference is that the bands of Envelopes are plotted a fixed distance (%) away from the moving average, while the Bollinger Bands are plotted a certain number of standard deviations away from it. Standard deviation is a measure of volatility, therefore Bollinger Bands adjust themselves to the market conditions. When the markets become more volatile, the bands widen and they contract during less volatile periods. This ada
FREE
VolumeBasedColorsBars
Henrique Magalhaes Lopes
VolumeBasedColorsBars — Free Powerful Volume Analysis for All Traders Unlock the hidden story behind every price bar! VolumeBasedColorsBars is a professional-grade, 100% FREE indicator that colorizes your chart candles based on real, adaptive volume analysis. Instantly spot surges in market activity, identify exhaustion, and catch the moves that matter. This indicator gives you:    • Dynamic color-coded bars for instant volume context    • Adaptive thresholds based on historical, session-awar
FREE
**RSI Divergence Auto for MT5** is a MetaTrader 5 indicator that automatically identifies potential bullish and bearish divergences between price movement and the Relative Strength Index. The indicator compares price highs and lows with RSI highs and lows. When it detects a difference between them, it displays the divergence directly on the chart. Features - Automatic detection of potential bullish divergences. - Automatic detection of potential bearish divergences. - Visualization of Bull a
FREE
SC MTF Rsi MT5
Krisztian Kenedi
5 (7)
Indicatore dell'Indice di Forza Relativa (RSI) con supporto multi-timeframe, segnali visivi personalizzabili e sistema di avvisi configurabile. Servizi di programmazione freelance, aggiornamenti e altri prodotti TrueTL sono disponibili sul mio profilo MQL5 . Feedback e recensioni sono molto apprezzati! Cos'è il RSI? Il Relative Strength Index (RSI) è un oscillatore di momentum che misura la velocità e l'entità delle variazioni di prezzo. L'indicatore oscilla tra 0 e 100, confrontando l'entità
FREE
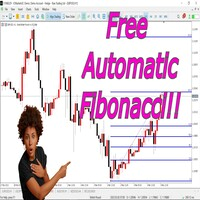
Free automatic Fibonacci is an indicator that automatically plots a Fibonacci retracement based on the number of bars you select on the BarsToScan setting in the indicator. The Fibonacci is automatically updated in real time as new highest and lowest values appears amongst the selected bars. You can select which level values to be displayed in the indicator settings. You can also select the color of the levels thus enabling the trader to be able to attach the indicator several times with differe
FREE
MACD Enhanced
Nikita Berdnikov
4 (4)
Introducing the MACD  Enhanced – an advanced MACD (Moving Average Convergence Divergence) indicator that provides traders with extended capabilities for trend and momentum analysis in financial markets. The indicator uses the difference between the fast and slow exponential moving averages to determine momentum, direction, and strength of the trend, creating clear visual signals for potential entry and exit points. Attention! To achieve the best results, it is recommended to adapt the indicator
FREE
PFKBreakOut
Stanislav Korotky
This indicator displays breakouts on Point-And-Figure-like or Kagi-like custom symbol charts, generated by special expert advisers, such as PointFigureKagiCharts . This indicator is applicable only for custom instruments generated in appropriate way (with time-invariant bars which are multiples of a predefined box size). It makes no sense to apply it to other charts. The breakouts in up or down direction are marked by arrows. The breakout price is found at crossing of one of imaginary lines of
FREE
Curver Arrows
Francis Dube
3.75 (4)
This indicator is a straight port of a well known MetaTrader 4 indicator that is freely available on the Internet. It does not redraw at all. It implements a type of breakout strategy. The arrows indicate market direction. Use the indicator on M15 charts and higher. The indicator draws two bands near price action and generates signals when the price closes below the lower band and also above the upper band. The indicator uses periodic highs and lows to calculate upper and lower threshold bands.
FREE
JT360 DNA Mini PnL Pointer V1.04 Public Compatto. Chiaro. Sempre sott’occhio. JT360 DNA Mini PnL Pointer è un indicatore leggero per MetaTrader 5 che mostra il profitto o la perdita flottante aggregata di tutte le posizioni aperte sul simbolo del grafico corrente. La sua visualizzazione compatta sul grafico combina il PnL basato sul rischio, espresso in R, una sottile mini-barra e una matrice di colori personalizzabile. I colori distintivi JT360, turchese e magenta, evidenziano i valori estremi
FREE
FVG Indicator
Daniel Moises Pimentel Flores
This indicator identifies and highlights market inefficiencies, known as Fair Value Gaps (FVG), on price charts. Using a custom algorithm, the indicator detects these areas of imbalance where the price moves sharply, creating potential trading opportunities. Indicator Parameters: Bullish FVG Color (clrBlue) : Color used to highlight bullish inefficiencies. The default value is blue. Bearish FVG Color (clrRed) : Color used to highlight bearish inefficiencies. The default value is red. Bullish FVG
FREE
This indicator is a zero-lag indicator and displays  strength of trend change . True Trend  Oscillator Pro works best in combination with True Trend Moving Average Pro that displays exact trend as is. Oscillator value is exact price change in given direction of the trend. True Trend Moving Average Pro: https://www.mql5.com/en/market/product/103586 If you set PERIOD input parameter to 1 this indicator becomes a sharpshooter for binary options. Developers can use True Trend Oscillator in Exper
FREE
Indicator and Expert Adviser  EA Available in the comments section of this product. Download with Indicator must have indicator installed for EA to work. Mt5 indicator alerts for bollinger band and envelope extremes occurring at the same time. Buy signal alerts occur when A bullish candle has formed below both the lower bollinger band and the lower envelope  Bar must open and close below both these indicators. Sell signal occur when A bear bar is formed above the upper bollinger band and upper
FREE
Pivot Points Indicator – a fast, reliable, and fully customizable pivot detection for MetaTrader 5. This indicator uses MetaTrader’s native iHighest and iLowest functions to identify pivot highs and lows by scanning for the highest and lowest prices within a user-defined window of bars. A pivot is confirmed only when the current bar is the absolute maximum or minimum within the selected range, ensuring accurate and timely signals based on robust built-in logic. Key Features No Repainting : Onc
FREE
Hi Low Last Day
Igor Vishnevskii
The Hi Low Last Day ( Hi Lo Last Day ) indicator shows the high and low of the last trading day and the second trading day, as well as the minimum and maximum of last week . There are many trading strategies on the daily levels. This indicator is indispensable when using such trading strategies. In fact, everything is simple in trading, you just need to understand and accept it for yourself. There is only price!!! What is price? This is the level on the chart. The level is the price that the buy
PZ Multi TDI MT5
PZ TRADING SLU
4.86 (14)
All-in-one trading powerhouse: trend, reversal, and exhaustion detection This indicator is a personal implementation of the famous Traders Dynamic Index, which uses RSI, moving averages and volatility bands to find trends, reversals and price exhaustions. However, this particular implementation supports not only RSI, but many others. It is suitable for scalping, day trading, and swing trading and aims to provide a full picture of the current market conditions. [ Installation Guide | Update Guid
FREE
The indicator identifies when a divergence occurs between price and an indicator or oscillator. It identifies both regular and hidden divergences. Combined with your own rules and techniques, this indicator will allow you to create (or enhance) your own powerful system. For higher probability setups I can recommend you to use my Supply Demand indicator and trade only if the divergence occurs inside a zone. Supply zone for bearish div and demand zone for bullish div. The optimal scenario is if it
FREE
GDS Renko Pip ST Chart - Pip-Based Renko Chart Indicator for MetaTrader 5 GDS Renko Pip ST Chart is a pip-based Renko chart indicator for MetaTrader 5. It helps traders build and study cleaner Renko price movement using a practical fixed pip or point-based brick structure. This tool is designed as a Renko chart foundation for manual analysis. It does not predict the market, does not generate buy or sell signals and does not decide whether a trade should be opened. Renko EDGE EA Golden Delta | A
FREE
Laguerre RSI Signal Alliance is a flexible MT5 oscillator with configurable BUY/SELL signals, optional Stochastic confirmation and multiple alert channels. The indicator is based on the Laguerre RSI concept introduced by John F. Ehlers and is designed for traders who want more than a standard oscillator line. It can detect Laguerre RSI level crossings, display historical signal arrows, confirm signals with an optional Stochastic filter and notify the trader through terminal, push, email or sound
FREE
TTM Squeeze MT5
Tinashe Ndarimani
4.9 (10)
Overview The TTM Squeeze indicator helps identify low volatility periods (squeeze) that often precede price breakouts. It uses Bollinger Bands (BB) and Keltner Channels (KC) to determine when the market is "coiling" and ready to move. Configuration Guide Volatility Settings The indicator uses Bollinger Bands to measure market volatility. When BBs are inside Keltner Channels, a squeeze is detected. The squeeze suggests the market is consolidating and may soon break out. True Range Option Optional
FREE
KeltnerChannelIndicatorMT5
Todd Terence Bates
3 (2)
The Keltner Channel is a volatility-based technical indicator composed of three separate lines. The middle line is an exponential moving average (EMA) of the price. Additional lines are placed above and below the EMA. The upper band is typically set two times the Average True Range (ATR) above the EMA, and the lower band is typically set two times the ATR below the EMA. The bands expand and contract as volatility (measured by ATR) expands and contracts. Since most price action will be encompasse
FREE
KMB Smart Pattern Analyzer PRO
Karwan Msto Mohammed Mohammed
Panoramica del prodotto KMB Smart Pattern Analyzer PRO è un indicatore avanzato di analisi tecnica progettato per rilevare e classificare pattern di mercato con un elevato livello di corrispondenza all'interno di un intervallo del grafico definito dall'utente. L'indicatore combina più motori di analisi in un unico strumento professionale: Analisi dei pattern candlestick Riconoscimento dei pattern grafici classici Rilevamento delle strutture armoniche Analisi della struttura di mercato / SMC Inve
FREE
Advanced Trend Builder is a trend indicator using the original calculation algorithm. ATB can be used on any data and timeframe. My recommendation use for calculation numbers 4 - 16 - 64 - 256 and so on ..., but this is only recommendation. The middle of the trend wave is a special place where market behavior is different, when developed ATB was main idea to find the middle of the wave trend. Input parameters: Bars will be used for calculation - number of bars used for a trend line calculation.
FREE
Impulse MACD
Elie Baptiste Granger
5 (1)
The Impulse MACD is a technical indicator that combines the power of multiple moving averages to create a unique momentum oscillator. Unlike traditional MACD indicators, this tool uses three different moving averages applied to high, low, and weighted price data to generate more precise market impulse signals. Its strength is its excellent filtering capability during ranging markets. Visual Elements Color-coded Histogram : Dynamic green/red bars that change color based on momentum direction Sign
FREE
Mitimom
Danil Poletavkin
The indicator is based on Robert Miner's methodology described in his book "High probability trading strategies" and displays signals along with momentum of 2 timeframes. A Stochastic oscillator is used as a momentum indicator. The settings speak for themselves period_1 is the current timeframe, 'current' period_2 is indicated - the senior timeframe is 4 or 5 times larger than the current one. For example, if the current one is 5 minutes, then the older one will be 20 minutes The rest of the s
FREE
Gold Levels MTF MT5
Sergei Linskii
5 (8)
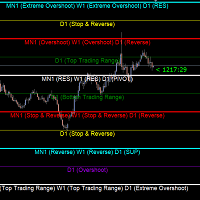
Gold Levels MTF - this is a fine stock technical indicator. The indicator algorithm analyzes the movement of the asset price, displays price levels of support and resistance from all time frames (TF) using the Murray method based on the Gann theory. The indicator indicates overbought and oversold fields, giving an idea of possible reversal points and at the same time giving some idea of the strength of the current trend. Description of levels: (Extreme Overshoot) - these levels are the ultimate
FREE
This indicator is an automated version of the Fibonacci retracement (Fib) indicator. Deciding the best areas to use when drawing the fib can be tricky and this  indicator was made with that in mind. When you drop it on the chart it will automatically choose the best points to draw the fib with, but in case you aren't satisfied with those regions, you can adjust it as you wish.
FREE
Gli utenti di questo prodotto hanno anche acquistato
Trend Sniper X
Sarvarbek Abduvoxobov
4.87 (46)
Trend Sniper X è un indicatore trend-following multi-timeframe per MetaTrader 5 che aiuta i trader a identificare la direzione del trend e i potenziali punti di inversione con chiarezza e precisione. per MT4: https://www.mql5.com/en/market/product/193245 Informazioni sul prezzo: Il prezzo attuale è promozionale ed è soggetto a modifiche con il rilascio di futuri aggiornamenti e nuove funzionalità. Offerta Bonus: Per ricevere GRATIS l'Auto-Trade Assistant EA per questo indicatore, invia un messa
Un nuovo Re in città - Indicatore + Gestione ordini (TP1 + TP2 + TP3) + Invio opzionale di segnali Telegram INCLUSO (GRATIS) (SISTEMA COMPLETO DI TRADING e SEGNALI) Il nostro miglior EA per l’Oro: Gold Slayer Questo indicatore include una strategia avanzata, un sistema di trading con gestione ordini personalizzabile e un sistema mean reversion che combina estensioni di envelope, supportato da molteplici filtri intelligenti di conferma come RSI per individuare ingressi di inversione ad alta proba
Smart Trend Trading System — MetaTrader 5 Dopo l'acquisto, inviami un messaggio su MQL5 per ricevere GRATUITAMENTE Smart Universal Expert Advisor, insieme al corso online, al manuale PDF e all'accesso al gruppo privato. STTS riunisce la direzione del trend, i segnali di entrata e uscita, le zone di inversione e i livelli di prezzo importanti direttamente sul grafico. Segui il sistema manualmente oppure collega un EA compatibile separato per eseguire le operazioni automaticamente con le impostazi
Entry Points Pro vi mostra dove entrare, dove mettere lo stop e con quale lotto operare — prima di piazzare l'ordine. PREZZO Ora 199 USD: 4 copie a questo prezzo, poi 249 USD. Il prezzo finale è di 349 USD. Guadagno facendo trading sui mercati e lo dimostro, quindi non ho bisogno di vendere questo indicatore a tutti. È uno strumento per trader che ragionano con la propria testa, non un pulsante magico. Nessuna rottura, nessun trade. Una freccia grigia è un segnale annullato: il prezzo non ha ro
Gann Made Easy è un sistema di trading Forex professionale e facile da usare che si basa sui migliori principi del trading utilizzando la teoria di mr. WD Gann. L'indicatore fornisce segnali ACQUISTA e VENDI accurati, inclusi i livelli di Stop Loss e Take Profit. Puoi fare trading anche in movimento utilizzando le notifiche PUSH. CONTATTAMI DOPO L'ACQUISTO PER RICEVERE GRATUITAMENTE LE ISTRUZIONI DI TRADING E OTTIMI INDICATORI EXTRA! Probabilmente hai già sentito parlare molte volte dei metodi d
SuperScalp Pro
Van Minh Nguyen
4.54 (37)
SuperScalp Pro - Professional Multi-Layer Confluence Scalping System SuperScalp Pro è un indicatore di scalping avanzato che potenzia il Supertrend classico con diversi filtri intelligenti di conferma. Aiuta a individuare opportunità di trading Buy/Sell con una maggiore probabilità di successo, riducendo significativamente i falsi segnali. Le frecce Buy e Sell vengono visualizzate chiaramente direttamente sul grafico, insieme ai livelli di Stop Loss e Take Profit basati sull’ATR, calcolati autom
M5 Sniper
MeanFX
5 (4)
Porta il tuo vantaggio nel trading sotto i riflettori! M5 Sniper è un nuovo indicatore di MeanFX. Combina segnali di trading precisi con livelli TP/SL adattivi , creando così le migliori operazioni statistiche possibili! Il prezzo aumenta ogni 5 acquisti, il prossimo prezzo è di 69$ Scrivimi dopo l'acquisto per ricevere consigli/guida e un EA bonus Cosa lo rende diverso? Performance statistica comprovata su Gold XAUUSD ( funziona su quasi ogni asset , concentrandosi sulla padronanza di un singol
SMC Intraday Formula
VividMind Digital Solutions
5 (26)
Cominciamo con la verità. Nessun indicatore da solo ti renderà profittevole. Se qualcuno ti dice il contrario, ti sta vendendo un sogno. Qualsiasi indicatore che mostra frecce perfette di acquisto/vendita può essere reso impeccabile — basta ingrandire la giusta sezione della storia e catturare solo i trade vincenti. Noi non lo facciamo.  SMC Intraday Formula è uno strumento. Legge la struttura del mercato per te, identifica le zone a più alta probabilità e ti mostra esattamente come appare la t
Zoryk Gold
Reda El Koutbane
4.68 (22)
ZORYK — Sistema avanzato di segnali XAUUSD per MetaTrader 5 Conosci sicuramente questa sensazione. Passi molto tempo ad analizzare l’oro. Aspetti il punto d’ingresso corretto. Finalmente apri l’operazione e il prezzo inizia immediatamente a muoversi contro di te. Chiudi troppo presto, sposti lo Stop Loss o esiti per alcuni secondi. Successivamente il mercato raggiunge esattamente l’obiettivo che avevi previsto inizialmente, ma senza di te nella posizione. Il problema non era sempre la direzione.
Ultra Indicator
Ihor Otkydach
5 (1)
ULTRA è un indicatore tecnico che funziona secondo un approccio “tutto in uno”: analizza autonomamente il mercato, genera segnali di trading, visualizza i livelli per l’impostazione degli ordini stop-loss e suggerisce quando chiudere le operazioni per realizzare profitti o ridurre al minimo le perdite. In altre parole, non importa se non sai come analizzare il mercato, determinare i livelli — dove impostare lo stop-loss — o se hai difficoltà con la gestione del capitale. ULTRA farà tutto questo
GoldenX Entry MT5
VividMind Digital Solutions
5 (17)
GoldenX Entry è un indicatore per MT5 con un algoritmo adattivo Smart Entry Trend, un sistema di scoring dei segnali, un rilevatore del regime di mercato e un filtro di volatilità. Ogni segnale include un livello di ingresso calcolato, tre livelli di Take-Profit (TP1, TP2, TP3) e un livello di Stop-Loss. È costruito su più livelli analitici progettati per adattarsi a diverse condizioni di mercato, combinando un sistema analitico multilivello con un ottimizzatore integrato e un sistema di traccia
Gold Trend Coach MT5
Cristhian Alexander Gaibor Cuasquer
4.27 (11)
Segnali di acquisto e vendita senza repaint sull'oro (XAUUSD) per MetaTrader 5. Ogni segnale arriva con stop loss e tre take profit. Un filtro Smart Money Concepts con BOS e CHoCH, così operi a favore della struttura, non contro. Un Mentor live sul pannello che ti guida passo dopo passo dall'ingresso fino al TP3. E alert direttamente sul tuo telefono e sul tuo canale Telegram. Questo è Gold Trend Coach. Mai più da solo davanti al grafico. KIT ACQUIRENTE GRATIS con il tuo acquisto: 1. Telegram A
Boba Analysis Suite
Trade Ready Solutions LLC
5 (2)
Boba Analysis Suite Boba Analysis Suite è un indicatore di analisi per MetaTrader 5. Riunisce la struttura del mercato, le zone di prezzo rilevanti e il contesto generale del mercato in un’unica visualizzazione del grafico. Sviluppato sulla base dell’esperienza pratica come trader e formatore di trading, supporta un processo di analisi strutturato: valutare la direzione del mercato, individuare livelli importanti e analizzare congiuntamente più intervalli temporali. Analisi nel contesto del merc
FX Power MT5 NG
Daniel Stein
5 (33)
FX Power: Analizza la Forza delle Valute per Decisioni di Trading Più Intelligenti Panoramica FX Power è lo strumento essenziale per comprendere la reale forza delle principali valute e dell'oro in qualsiasi condizione di mercato. Identificando le valute forti da comprare e quelle deboli da vendere, FX Power semplifica le decisioni di trading e rivela opportunità ad alta probabilità. Che tu segua le tendenze o anticipi inversioni utilizzando valori estremi di Delta, questo strumento si adatta
Power Candles MT5
Daniel Stein
4.58 (12)
Power Candles V3 - Indicatore di forza ad ottimizzazione automatica Power Candles V3 trasforma la forza delle valute e degli strumenti in un piano di trading attuabile su ogni grafico a cui è collegato. Invece di limitarsi a colorare le candele, esegue un'auto-ottimizzazione in tempo reale in background e ti fornisce i migliori valori di Stop Loss, Take Profit e soglia di segnale per il simbolo che hai davanti. Basta un clic per adottarlo nel trading live: i raggi di ingresso, Stop Loss e Take P
M1 Sniper MT5
Oleg Rodin
5 (7)
M1 SNIPER   è un sistema di indicatori di trading facile da usare. Si tratta di un indicatore a freccia progettato per l'intervallo temporale M1. L'indicatore può essere utilizzato come sistema autonomo per lo scalping sull'intervallo temporale M1 e come parte del tuo sistema di trading esistente. Sebbene questo sistema di trading sia stato progettato specificamente per il trading sull'intervallo temporale M1, può comunque essere utilizzato anche con altri intervalli temporali. Inizialmente ho p
Atomic Analyst MT5
Issam Kassas
4.51 (65)
Atomic Analyst — MetaTrader 5 Dopo l'acquisto, inviami un messaggio su MQL5 per ricevere GRATUITAMENTE Smart Universal Expert Advisor, insieme al corso online, al manuale PDF e all'accesso al gruppo privato. Atomic Analyst riunisce l’azione del prezzo, la direzione del trend, i segnali di entrata e uscita, lo Stop Loss e diversi livelli di Take Profit direttamente sul grafico. INDIVIDUA IL SEGNALE. COMPRENDI IL CONTESTO OPERATIVO. Atomic Analyst organizza la sua analisi in informazioni visive ch
Smc Pro ToolKit
Talal N Z Aljarusha
5 (13)
SMC PRO TOOLKIT — SMART MONEY ANALYSIS & STRUCTURED TRADE PLANNING SMC Pro ToolKit is a professional Smart Money Concepts analysis workspace for MetaTrader 5. It combines market structure, multi-timeframe analysis, institutional price zones, setup evaluation, confirmation tools, volume context, alerts, and risk planning inside one organized chart environment. One workspace. Multiple layers of confirmation. One structured trading plan. OPEN COMPLETE USER GUIDE MULTI-CONDITION SETUP ENGINE At
Auto Optimized SpeedAngle è un sistema di vettorizzazione del momento di livello istituzionale che elimina l'overfitting ( curve-fitting ) attraverso l'ottimizzazione continua Walk-Forward (WFO). Invece di affidarsi a input statici che si degradano quando i regimi di mercato cambiano, l'indicatore recalibra dinamicamente i suoi parametri utilizzando la validazione Out-of-Sample (OOS), assicurando che i segnali visualizzati rappresentino reali vantaggi statistici anziché anomalie storiche. Quadro
Azimuth Pro
Ottaviano De Cicco
5 (7)
Azimuth Pro V2: Synthetic Fractal Structure and Confirmed Entries for MT5 Overview Azimuth Pro is a multi-level swing structure indicator by Merkava Labs . Four nested swing layers, swing-anchored VWAP, ABC pattern detection, three-timeframe structural filtering, and closed-bar confirmed entries — one chart, one workflow from micro-swings to macro-cycles. This is not a blind signal product. It is a structure-first workflow for traders who care about location, context, and timing. 1. What Change
Gold Entry Sniper
Tahir Mehmood
5 (23)
Gold Entry Sniper – Dashboard ATR Multi-Timeframe per Scalping e Swing Trading sull’Oro Gold Entry Sniper è un indicatore avanzato per MetaTrader 5 che offre segnali di acquisto/vendita precisi per XAUUSD e altri strumenti, basato sulla logica ATR Trailing Stop e l' analisi multi-timeframe . Caratteristiche e Vantaggi Analisi Multi-Timeframe – Visualizza trend su M1, M5, M15 in un'unica dashboard. Trailing Stop Basato su ATR – Stop dinamici che si adattano alla volatilità. Dashboard Professional
Apex Patterns PRO Acquista l'indicatore - Ottieni GRATUITAMENTE l'Expert Advisor basato su di esso. Intelligenza auto-ottimizzante per pattern grafici e breakout Gli scanner di pattern tradizionali si basano su input fissi, registrando spesso prestazioni inferiori quando la volatilità e le strutture del mercato cambiano. Apex Patterns PRO è progettato per adattarsi alle mutevoli condizioni di mercato combinando il riconoscimento dei pattern grafici strutturali, il filtraggio del momentum e l'au
Meridian Pro
Ottaviano De Cicco
4 (3)
Meridian Pro 2.00: Professional Multi-Timeframe Trend Matrix for MT5 Meridian Pro 2.00 is a professional adaptive trend matrix for MetaTrader 5. It combines the original Meridian trend engine, a clean chart ribbon, closed-bar signal arrows, an 8-timeframe dashboard, Fuel momentum, weighted consensus, synthetic HTF processing and chart-native higher-timeframe context lines. The goal is simple: read current trend, multi-timeframe structure, strength, momentum and EA-ready state from one discipline
Prossimo aggiornamento — Versione 2.52 in arrivo! [NOVITÀ] Preparati a 4 nuove funzionalità principali progettate per migliorare la tua analisi di mercato e il tuo flusso di lavoro nel trading Portiamo l’analisi di mercato a un livello superiore con 4 nuove funzionalità progettate per soddisfare le tue esigenze di trading. Ecco le novità: 1. TRADE OVERVIEW DASHBOARD 2. CONFLUENCE AT ZONE 3. STRONG & WEAK HIGH/LOW 4. OTE 1. TRADE OVERVIEW DASHBOARD Una dashboard che ti aiuta a comprendere più fa
Divergence Bomber
Ihor Otkydach
4.89 (94)
Ogni acquirente dell’indicatore riceverà inoltre gratuitamente: L’utilità esclusiva “Bomber Utility”, che gestisce automaticamente ogni operazione, imposta i livelli di Stop Loss e Take Profit e chiude le posizioni secondo le regole della strategia I file di configurazione (set file) per adattare l’indicatore a diversi asset I set file per configurare il Bomber Utility in tre modalità: “Rischio Minimo”, “Rischio Bilanciato” e “Strategia di Attesa” Una guida video passo-passo per installare, con
Adaptive Price Action Engine Acquista un indicatore, ricevi l'EA gratis Analisi Auto-Ottimizzata del Trend e dei Pattern Candlestick Multi-Timeframe I mercati cambiano continuamente e non tutti i pattern di Price Action hanno lo stesso valore in ogni condizione di mercato. Adaptive Price Action Engine è progettato per adattarsi alle condizioni di mercato in continua evoluzione, combinando struttura del trend, analisi Multi-Timeframe, pattern Candlestick e ottimizzazione statistica in un unico fr
Currency Strength Wizard   è un indicatore molto potente che ti fornisce una soluzione all-in-one per un trading di successo. L'indicatore calcola la potenza di questa o quella coppia forex utilizzando i dati di tutte le valute su più intervalli di tempo. Questi dati sono rappresentati in una forma di indice di valuta facile da usare e linee elettriche di valuta che puoi utilizzare per vedere il potere di questa o quella valuta. Tutto ciò di cui hai bisogno è collegare l'indicatore al grafico ch
Crystal Heikin Ashi Signals
Muhammad Jawad Shabir
5 (5)
Crystal Heikin Ashi Signals—Professional Trend & Signal Detection Indicator Advanced Heikin Ashi Visualization with Intelligent Signal System for Manual & Automated Trading Final Price: $149 ---------> Price goes up $10 after every 10 sales . Limited slots available — act fast . Overview User Guide PDF Crystal Heikin Ashi Signals is a professional-grade MetaTrader 5 indicator that combines pure Heikin Ashi candle visualization with an advanced momentum-shift detection system. Designed for both m
Naked Forex Tweezer Pro Indicator Tweezer Pro Indicator is a pattern recognition indicator for Forex, Stocks, Indices, Futures, Commodities and Cryptos. The standard Tweezer is a two bar pattern. Our enhanced version is a multi-bar pattern. We filter the patterns for you so that you only get the     best and most effective patterns   and ignore the noise. The Tweezer pattern is a simple and effective pattern to trade. The strategy that comes with the Tweezer is based on price action. The Twe
FiboSniper Pro
Van Minh Nguyen
5 (4)
FiboSniper Pro – Multi-Filter Fibonacci System with Auto SL/TP and Control Panel FiboSniper Pro è un indicatore tecnico che combina Fibonacci Envelopes dinamici con diversi filtri di conferma per generare segnali Buy e Sell selezionati. I livelli di Fibonacci vengono calcolati sulla base di Moving Average e ATR e successivamente filtrati tramite ADX, EMA, RSI, ATR, Volume, Time e struttura delle candele. L’indicatore visualizza direttamente sul grafico i livelli automatici di Stop Loss e Take Pr
Altri dall’autore
Fabii Universal Trend Baseline
Fabien Georges Andre Guillemaud
Prova 18 baseline su un solo grafico e tieni quella che si adatta al tuo mercato. Un menu, una logica. No repaint. Qualsiasi coppia, mercato e timeframe. Demo gratuita nello Strategy Tester. Get more indicators here Baselines, volatility filters and oscillators. No repaint. Perché ti serve La baseline che va bene su una coppia ritarda su un'altra, o salta in laterale. Cambiarla significa caricare un altro indicatore e rifare il grafico. Così tieni una baseline che non si adatta al tuo mercato
Fabii Half Trend Baseline
Fabien Georges Andre Guillemaud
Smetti di operare contro il trend del timeframe superiore. Due baseline, un grafico. Senza repaint. Qualsiasi coppia, qualsiasi timeframe. Sul tuo grafico in 2 minuti. Demo gratuita nello Strategy Tester. Get more indicators here Baselines, volatility filters and oscillators. No repaint. Perché ti serve Entri in un trade perché una linea è diventata verde sul tuo grafico. Poi apri un timeframe superiore e vedi che il trend più grande punta nella direzione opposta. Il segnale era reale. Il tre
Fabii Adaptive Trend Baseline
Fabien Georges Andre Guillemaud
Resta nella tendenza con una baseline che rallenta nel rumore e accelera nei movimenti. Cinque medie adattive. No repaint. Qualsiasi coppia, mercato e timeframe. Demo gratuita nello Strategy Tester. Get more indicators here Baselines, volatility filters and oscillators. No repaint. Perché ti serve Una media a velocità fissa ritarda in un movimento forte e salta nel rumore. Entri tardi, o entri su una piccola oscillazione. Nessuna delle due entrate corrisponde al mercato che operi. Ogni ingres
FREE
Fabii Volatility ATR Percentile
Fabien Georges Andre Guillemaud
Vedi se la volatilità misurata dall'Average True Range (ATR) è calma o tesa, da 0 a 100. Senza repaint. Qualsiasi coppia, qualsiasi timeframe. Sul tuo grafico in 2 minuti. Demo gratuita nello Strategy Tester. Get more indicators here Baselines, volatility filters and oscillators. No repaint. Perché ti serve Un valore grezzo di ATR come 0.0040 dice poco. È alto per questa coppia adesso, o normale? Per saperlo devi tornare indietro di settimane di barre e tirare a indovinare. Così entri in un m
FREE
Fabii Essential Trend Baseline
Fabien Georges Andre Guillemaud
Smetti di entrare su inversioni di tendenza senza momentum. Una linea, un grafico, nessun secondo indicatore. No repaint. Qualsiasi coppia, mercato e timeframe. Sul tuo grafico in 2 minuti. Test gratuito nello Strategy Tester. Get more indicators here Baselines, volatility filters and oscillators. No repaint. Perché ti serve Entri perché la linea è diventata verde. Il prezzo va alla deriva per dieci candele e poi si inverte. Il segnale era reale, ma il momentum no. Ogni ingresso su un'inversi
FREE
Fabii Ehlers Trend Baseline
Fabien Georges Andre Guillemaud
Leggi la tendenza su una linea più liscia, con meno piccole oscillazioni. Cinque filtri di elaborazione del segnale. No repaint. Qualsiasi coppia, mercato e timeframe. Demo gratuita nello Strategy Tester. Get more indicators here Baselines, volatility filters and oscillators. No repaint. Perché ti serve Una linea rumorosa si inverte a ogni piccola oscillazione. Vedi un nuovo segnale, entri, e il movimento si inverte. Ogni falsa inversione ti costa uno stop loss. Cosa ottieni Fabii Ehlers Tren
FREE
Fabii NNFX Atr Levels
Fabien Georges Andre Guillemaud
<p>Pianifica ogni trade con un clic: Entry, Take Profit e Stop Loss disegnati per te. Nessun repaint.<br/> Qualsiasi coppia, qualsiasi timeframe. Sul tuo grafico in 2 minuti. Test gratuito nello Strategy Tester.</p> <p><br></p> <p><a href=" https://www.mql5.com/en/users/fabienfxtrades/seller " target="_blank">Get more indicators here</a><br>Baselines, volatility filters and oscillators. No repaint.</p> <p><br></p> <h3>Perché ti serve</h3> <p>Pianifichi a mano un trade basato sull'Average True Ra
FREE
Fabii Atr Volatility Zones
Fabien Georges Andre Guillemaud
Scopri se la volatilità di ogni candela è bassa, media o alta per questo mercato, in tre colori. No repaint. Qualsiasi coppia, qualsiasi timeframe, qualsiasi mercato. Sul tuo grafico in 2 minuti. Gratis da provare nello Strategy Tester. Get more indicators here Baselines, volatility filters and oscillators. No repaint. Perché ti serve La stessa ampiezza significa cose diverse su mercati diversi e in momenti diversi. Guardi l'ultima candela e non sai dire se la sua ampiezza è grande o piccola
FREE
Fabii Supertrend NMA
Fabien Georges Andre Guillemaud
Resta nel trend anche tra il rumore dei range con un SuperTrend su un centro adattivo. No repaint. Qualsiasi coppia, qualsiasi timeframe. Sul tuo grafico in 2 minuti. Test gratuito nello Strategy Tester. Get more indicators here Baselines, volatility filters and oscillators. No repaint. Perché ti serve Entri perché il SuperTrend ha appena girato. Il prezzo si muove di lato per alcune candele, la linea torna indietro, ed esci dall'operazione oppure salti il segnale successivo. Il SuperTrend cl
FREE
Fabii Vwap SSL Baseline
Fabien Georges Andre Guillemaud
Smetti di indovinare quale incrocio del VWAP conta: una linea colorata mostra il tuo lato. No repaint. Qualsiasi coppia. Ancoraggio giornaliero, settimanale o mensile. Sul tuo grafico in 2 minuti. Test gratuito nello Strategy Tester. Get more indicators here Baselines, volatility filters and oscillators. No repaint. Perché ti serve La maggior parte dei trader legge il prezzo medio ponderato per il volume (VWAP) come una semplice linea e discute ogni tocco. Questa baseline mostra invece un lat
FREE
Fabii Kaufman Efficiency Ratio
Fabien Georges Andre Guillemaud
Vedi a colpo d'occhio se il prezzo è in tendenza o solo in rumore, con una sola linea da 0 a 1. No repaint. Qualsiasi coppia, qualsiasi timeframe. Sul tuo grafico in 2 minuti. Demo gratuita nello Strategy Tester. Get more indicators here Baselines, volatility filters and oscillators. No repaint. Perché ti serve Vedi un movimento pulito sul grafico ed entri. Poche candele dopo il prezzo si ferma, va di lato e ti fa uscire. Il movimento sembrava una tendenza, ma era per lo più avanti e indietro
FREE
Fabii Volatility Bias
Fabien Georges Andre Guillemaud
Scopri quale lato, rialzista o ribassista, guida la volatilità in un unico istogramma centrato sullo zero. No repaint. Qualsiasi mercato, qualsiasi timeframe. Sul tuo grafico in 2 minuti. Demo gratuita nello Strategy Tester. Get more indicators here Baselines, volatility filters and oscillators. No repaint. Perché ti serve Un movimento sembra forte: candele verdi, prezzo in salita. Ma non sai se lo sostiene una vera volatilità rialzista, o se sale a piccoli passi mentre le oscillazioni più gr
Fabii Rsx Ema Oscillator
Fabien Georges Andre Guillemaud
Smetti di indovinare quando il momentum gira: una linea RSX fluida e un incrocio di segnale te lo mostrano. No repaint. Qualsiasi coppia, qualsiasi timeframe. Sul tuo grafico in 2 minuti. Demo gratuita nello Strategy Tester. Get more indicators here Baselines, volatility filters and oscillators. No repaint. Perché ti serve Guardi un oscillatore di momentum e ogni tocco della linea di segnale sembra un'inversione. La linea salta da candela a candela, l'istogramma cambia colore con piccoli movi
Fabii Adxvma Ssl Channel
Fabien Georges Andre Guillemaud
One clean trend line that follows the lows while the trend holds, and flips above price only when the move truly turns. No repaint. Any pair, any timeframe. Every flip is final on bar close. Try it free on your own charts in the Strategy Tester. >> Get more free indicators here Baseline, volatility, oscillators & more — free and premium. No repainting. No guessing. Just clean signals. THE PROBLEM Most trend lines flip too early. A classic SSL channel rides two simple moving averages,
FREE
Fabii Memory Baseline
Fabien Georges Andre Guillemaud
Leggi il trend e quello del timeframe superiore sullo stesso grafico, con una linea che mantiene il suo livello. No repaint. Qualsiasi coppia, qualsiasi timeframe. Sul tuo grafico in 2 minuti. Demo gratuita nello Strategy Tester. Get more indicators here Baselines, volatility filters and oscillators. No repaint. Perché ti serve Una media mobile semplice resta indietro rispetto al prezzo. Dopo un movimento forte, la linea resta lontana dal prezzo. Per vedere il timeframe superiore devi cambiar
FREE
Fabii Yang Zhang Volatility Filter
Fabien Georges Andre Guillemaud
Scopri quando la volatilità basta per operare — dal vivo, senza repaint, su qualsiasi coppia. Qualsiasi coppia, qualsiasi timeframe. Le linee si fissano alla chiusura della candela. Demo gratuita nello Strategy Tester. >> Get more free and premium indicators here Baseline, volatility, oscillators and more. No repainting. No guessing. Just clean signals. IL PROBLEMA Il tuo ingresso può essere giusto e non portare da nessuna parte. Con il mercato fermo, il prezzo va alla deriva, il rumor
Fabii Nma Ssl Channel
Fabien Georges Andre Guillemaud
Get a clear trend line that holds in trends and stays quiet in noise — no repaint. Any pair, any timeframe. Signals lock on bar close. Free to download. Test it in the Strategy Tester before using it live. >> Get more free indicators here Baseline, volatility, oscillators & more — free and premium. No repainting. No guessing. Just clean signals. THE PROBLEM Most SSL channels use a fixed-speed moving average. That means the line reacts the same whether price is trending hard or grindin
FREE
Fabii Ehlers Adaptive Bands
Fabien Georges Andre Guillemaud
Know exactly when the trend flips — before you miss the move. Signals lock on bar close, no repaint. Any pair, any timeframe. Free demo in the Strategy Tester. THE PROBLEM Most trend tools give you a direction — but they keep repainting until the bar closes, or they lag so far behind that the entry is gone by the time they confirm. You end up either chasing or sitting out clean moves. Every bar you misread the regime is a trade you size wrong or skip entirely. THE SOLUTION Fabi
FREE
Fabii Volatility Acceleration Index
Fabien Georges Andre Guillemaud
See at a glance when volatility is speeding up before a move — and when it is fading into a dead market. Any pair, any timeframe. No repaint — signals are final on bar close. Try it free in the Strategy Tester before you buy. THE PROBLEM Most volatility tools tell you how big the range is right now. They do not tell you the one thing that matters for timing: is volatility accelerating or slowing down? You end up entering just as a move runs out of steam, or sitting out while a breakout
FREE
Fabii Adxvma Ssl Pro
Fabien Georges Andre Guillemaud
One adaptive SSL trend line that only flips when the move is real, plus a second SSL baseline from a higher timeframe on the same chart, Buy/Sell arrows, and an ATR filter that blocks weak signals before they reach you. No repaint. Try the free version first: Fabii Adxvma Ssl Channel. THE PROBLEM A classic SSL channel flips on every small push. Even the adaptive ADXVMA version flips too often in choppy markets, fires arrows on signals that reverse the next bar, and shows you only one ti
Fabii Nma Ssl Pro
Fabien Georges Andre Guillemaud
Know the trend direction before you enter — adaptive SSL line with an ATR filter that blocks weak flips. No repaint. Any pair, any timeframe. Signals lock on bar close. Test it free in the Strategy Tester before buying. THE PROBLEM Standard SSL channels flip at every small push against the trend. You take the signal, price reverses immediately, and you stop out. Tighten the filter, you miss real moves. Loosen it, you drown in noise. And watching one timeframe only, you never know whethe
Fabii Responsive Trend Baseline
Fabien Georges Andre Guillemaud
Individua prima le inversioni di tendenza con una baseline a basso ritardo. Cinque medie veloci. No repaint. Qualsiasi coppia, mercato e timeframe. Demo gratuita nello Strategy Tester. Get more indicators here Baselines, volatility filters and oscillators. No repaint. Perché ti serve Una media lenta conferma la tendenza quando il movimento è già in corso. Vedi l'inversione tardi ed entri tardi. Ogni ingresso tardivo ti costa un prezzo peggiore e uno stop loss più lontano. Cosa ottieni Fabii R
Fabii Htf Po3 Candle Projection
Fabien Georges Andre Guillemaud
Guarda la candela del timeframe superiore formarsi accanto al prezzo, con un conto alla rovescia. Senza repaint. Qualsiasi simbolo. Sul tuo grafico in 2 minuti. Test gratuito nello Strategy Tester. Get more indicators here Baselines, volatility filters and oscillators. No repaint. Perché ti serve Operi su M5 o M15, ma la candela giornaliera fissa il quadro della giornata. Per vedere dove ha aperto, quanto si è estesa e quanto tempo le resta, cambi grafico o apri una seconda finestra. Ogni cam
Fabii Memory Distance Oscillator
Fabien Georges Andre Guillemaud
Guarda quanto il prezzo si è allontanato dalla linea base e quando inizia a tornare. Un istogramma, una lettura. No repaint. Qualsiasi coppia, qualsiasi timeframe, qualsiasi mercato. Sul tuo grafico in 2 minuti, gratis. Get more indicators here Baselines, volatility filters and oscillators. No repaint. Perché ti serve Vedi un movimento forte e vuoi entrare. Il prezzo è già lontano dalla sua media, entri tardi e il mercato arretra subito dopo. Oppure aspetti un ritracciamento e non sai disting
Fabii Memory Support Resistance
Fabien Georges Andre Guillemaud
Smetti di indovinare quali zone di supporto e resistenza contano: ognuna mostra quante volte il prezzo l'ha testata. No repaint. Qualsiasi coppia, qualsiasi timeframe. Sul tuo grafico in 2 minuti. Test gratuito nello Strategy Tester. Get more indicators here Baselines, volatility filters and oscillators. No repaint. Perché ti serve Disegni supporto e resistenza a mano, e due trader non disegnano mai gli stessi livelli sullo stesso grafico. Non sai quali livelli meritano la tua attenzione. Met
Fabii Confluence Oscillator
Fabien Georges Andre Guillemaud
Smetti di contare i segnali a occhio: sette indicatori classici votano in un unico punteggio da -100 a +100. No repaint. Qualsiasi coppia, qualsiasi timeframe. Sul tuo grafico in 2 minuti. Test gratuito nello Strategy Tester. Get more indicators here Baselines, volatility filters and oscillators. No repaint. Perché ti serve Sovrapponi più indicatori in sottofinestre e conti i loro segnali a occhio. Uno sale, un altro è piatto, un terzo punta nella direzione opposta. Entri con una maggioranza
Fabii Elder Market Thermometer
Fabien Georges Andre Guillemaud
Scopri quando un mercato tranquillo si risveglia. Un Market Thermometer con avvisi di risveglio e cinque medie. Senza repaint. Qualsiasi coppia, qualsiasi timeframe. Sul tuo grafico in 2 minuti. Test gratuito nello Strategy Tester. Get more indicators here Baselines, volatility filters and oscillators. No repaint. Perché ti serve Apri un'operazione, il prezzo si muove appena e il segnale si spegne in un mercato addormentato. Il mercato non aveva l'energia per seguire il tuo segnale. Un mercat
Fabii Metro Step RSI
Fabien Georges Andre Guillemaud
Smetti di entrare su oscillazioni di momentum che si invertono una candela dopo. Due linee a gradini, un grafico. No repaint. Qualsiasi coppia, qualsiasi timeframe. Sul tuo grafico in 2 minuti. Test gratuito nello Strategy Tester. Get more indicators here Baselines, volatility filters and oscillators. No repaint. Perché ti serve Vedi girare il Relative Strength Index (RSI) e entri. Poche candele dopo si inverte: il segnale era solo rumore. L'RSI si muove a ogni candela, quindi una piccola osc
Fabii Half Trend Mtf Alignment
Fabien Georges Andre Guillemaud
Scopri quando tre timeframe concordano sulla direzione del trend, in una fascia sotto il grafico. Senza repaint. Qualsiasi coppia, qualsiasi timeframe da M1 a W1. Sul tuo grafico in 2 minuti. Test gratuito nello Strategy Tester. Get more indicators here Baselines, volatility filters and oscillators. No repaint. Perché ti serve Entri su un timeframe e quello superiore andava nella direzione opposta. Controllare significa cambiare grafico, e con il mercato veloce lo salti. Le entrate contro il
Filtro:
Nessuna recensione
Rispondi alla recensione