Fabii Memory Support Resistance

Stop guessing which support and resistance zones matter: each one shows how many times price tested it. No repaint.
Any pair, any timeframe. On your chart in 2 minutes. Free to test in the Strategy Tester.


Get more indicators here
Baselines, volatility filters and oscillators. No repaint.


Why you need it

You draw support and resistance by hand, and two traders never draw the same levels on the same chart. You do not know which levels deserve your attention. You place a stop behind a level that price never respected, and you find out only when it breaks.

What you get

Fabii Memory Support Resistance draws support and resistance zones from a rule and counts how many times price tested each one, so you stop guessing which levels matter.

  • Every zone comes from a rule, not from your eye, so you and another trader see the same levels.
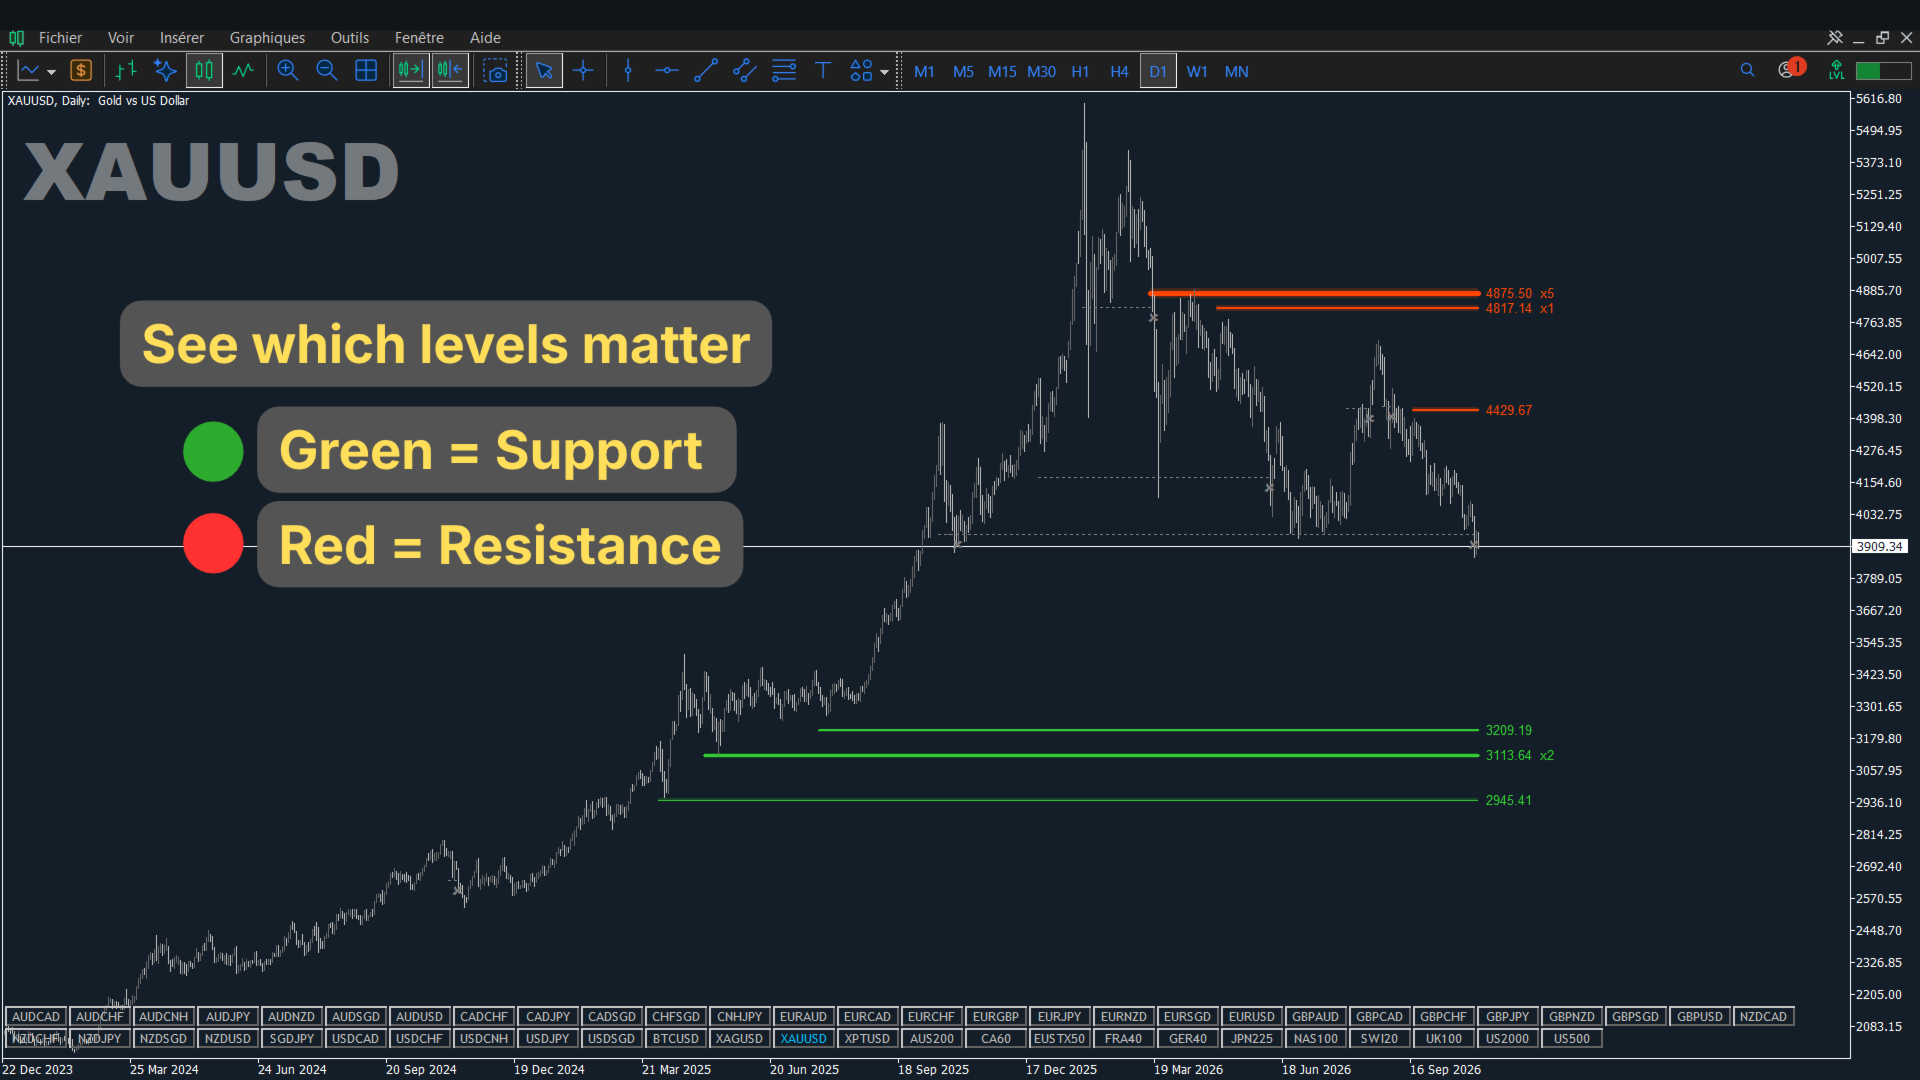
  • Each level shows a touch count (for example x3) and a thicker line the more it is tested, so you see at a glance which levels price respected most.
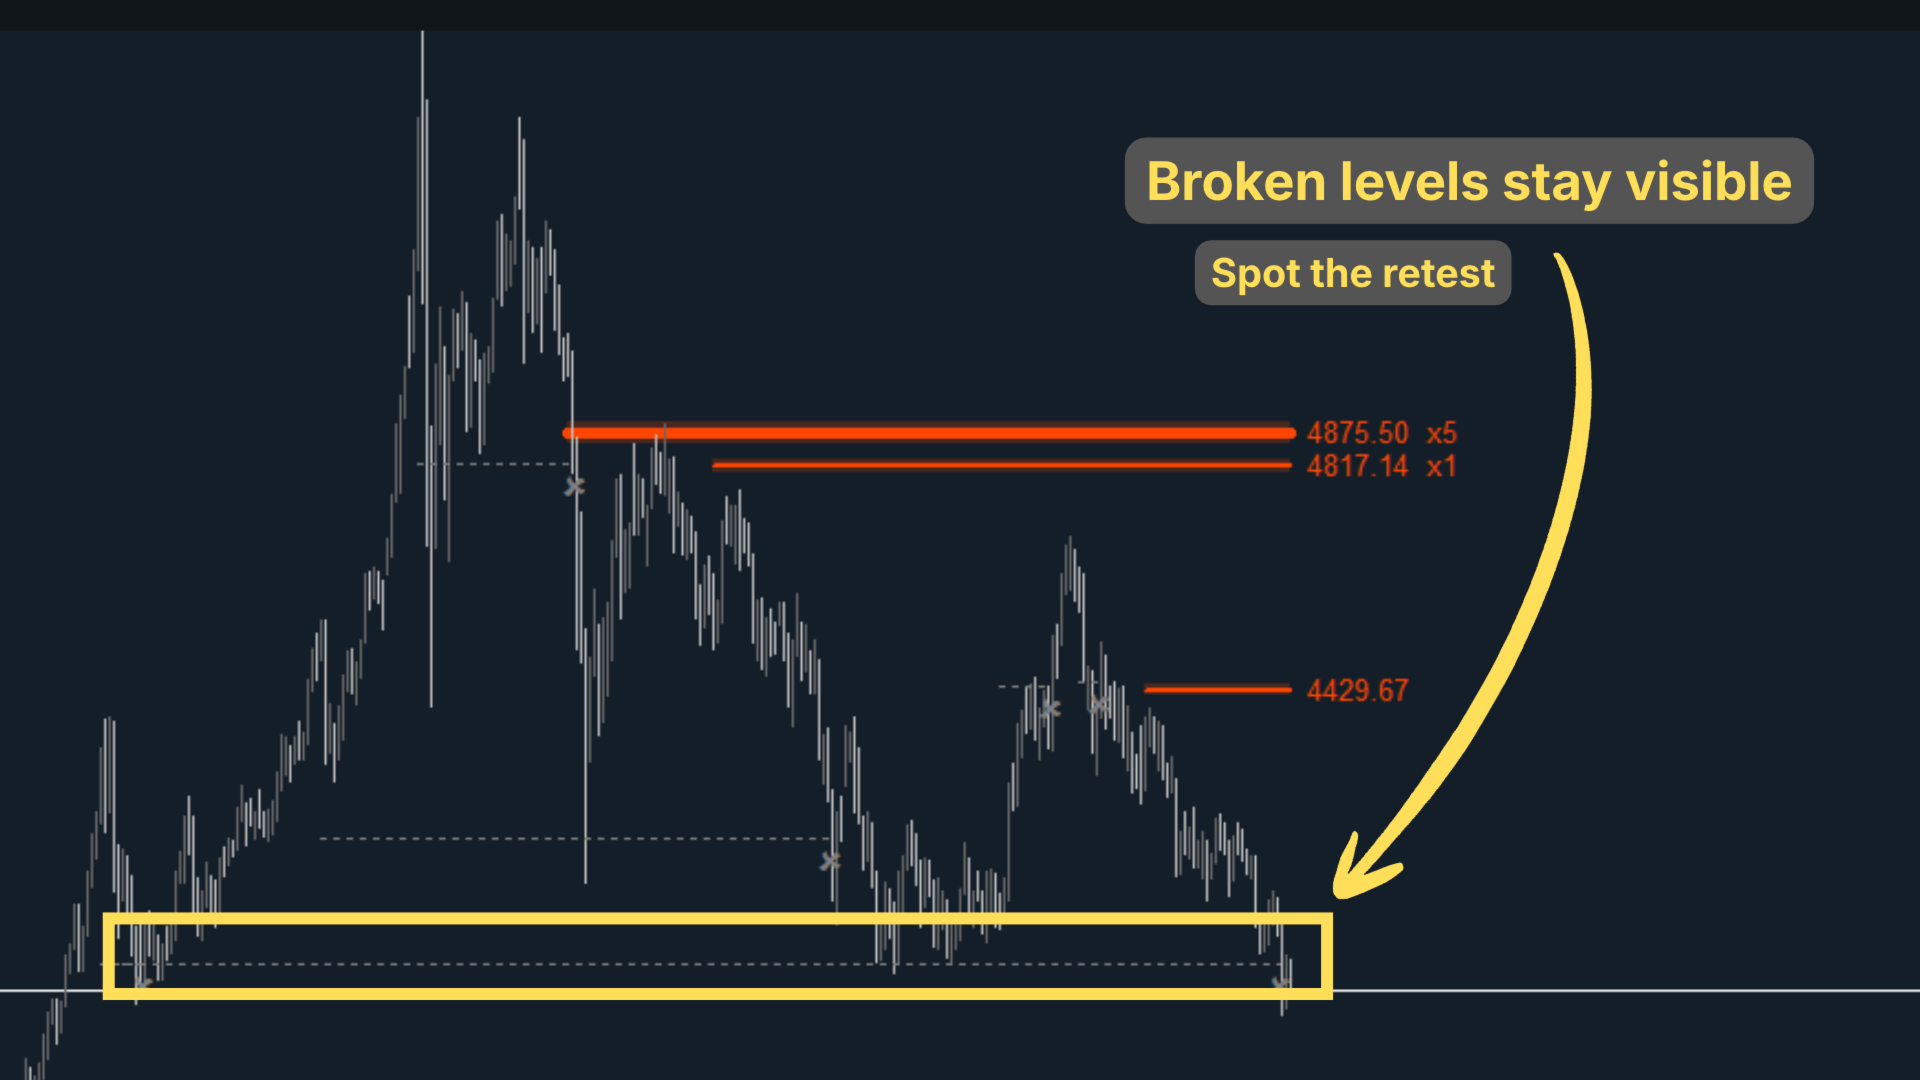
  • Green zones sit under price and red zones above. A broken level becomes a dotted grey line that stops on the bar where it broke, so your chart stays readable.
  • Alerts for a new level, a break, a retest of a broken level and, if you want, a touch, so you do not have to watch the chart.
  • Five buffers for your Expert Advisor: nearest support, nearest resistance, a strength score for each and the bar event, so you can build your own rules.

How it works

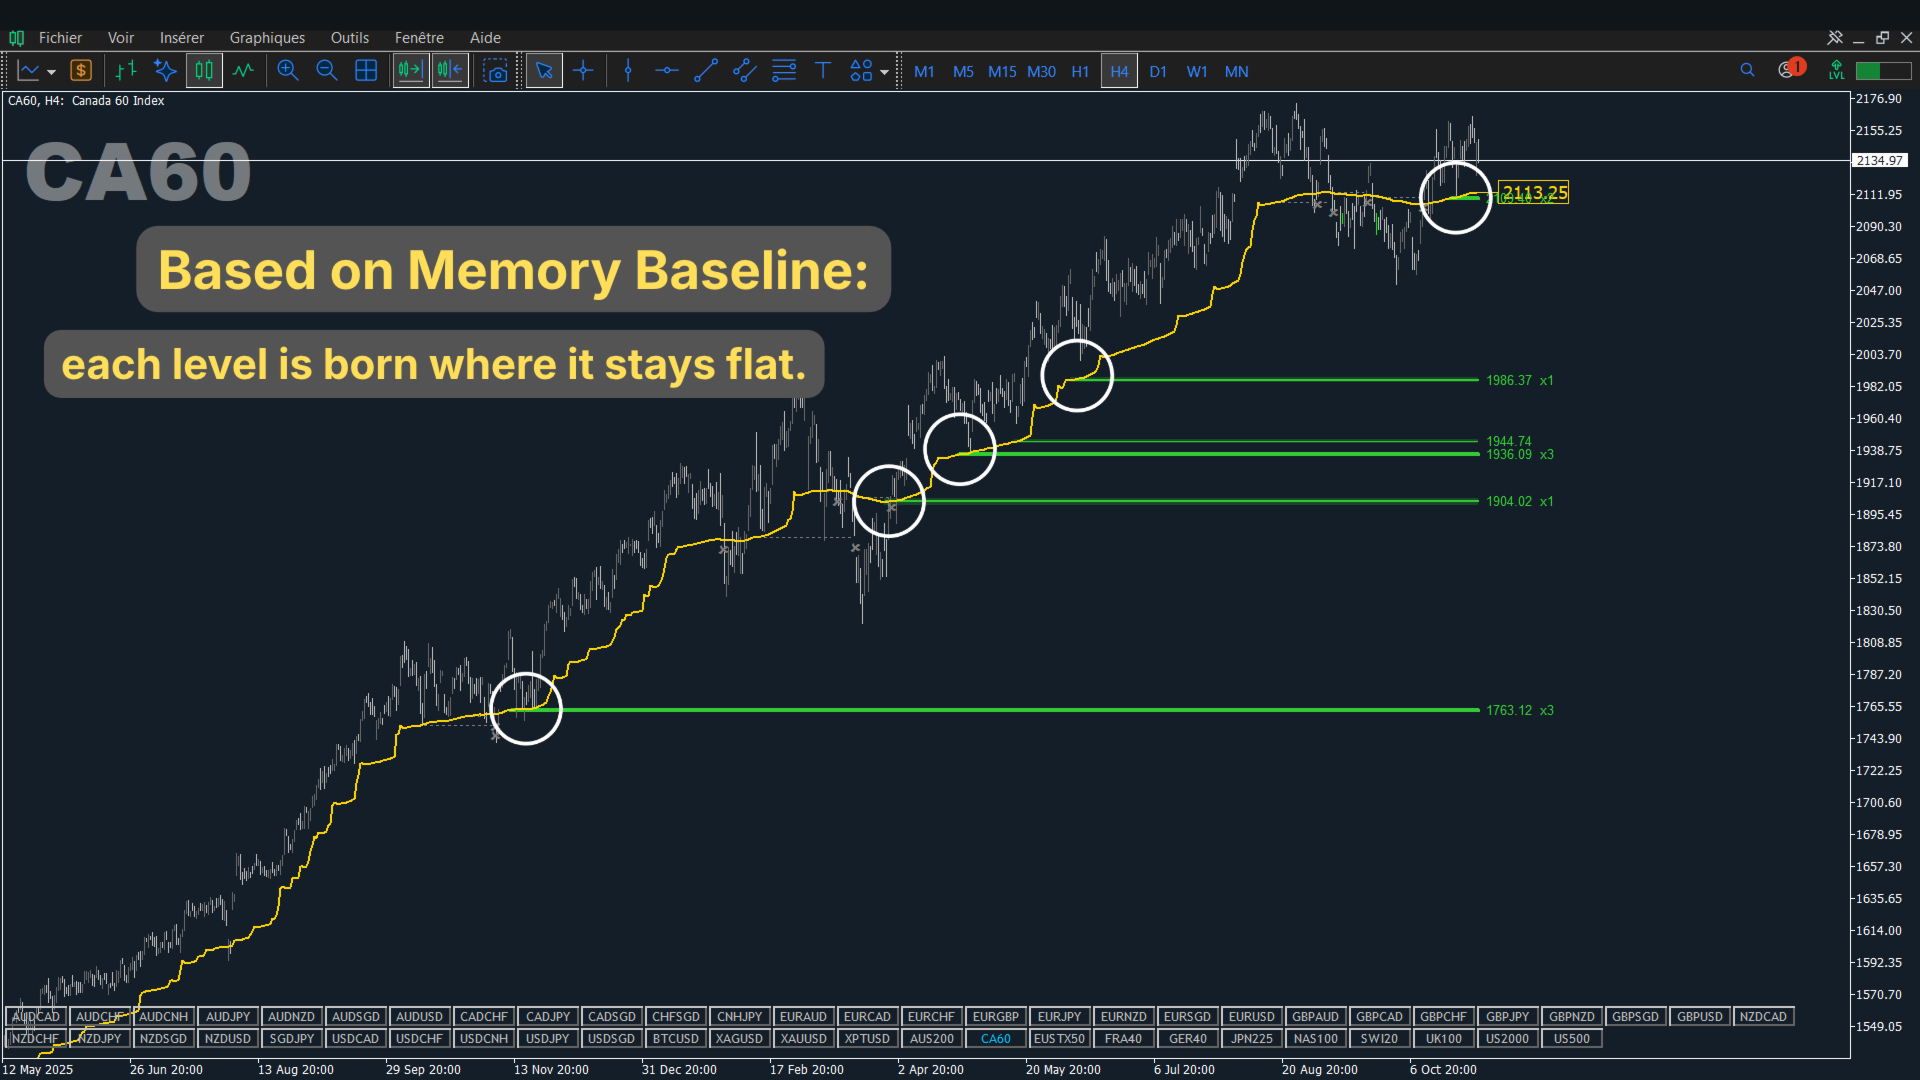
The indicator starts from the Memory Baseline, an adaptive moving average that stays nearly flat while price does not push it enough. When the baseline varies by less than 0.10 times the Average True Range (ATR) over at least 5 closed bars, that plateau becomes a level at the baseline value. It is a support if price closes above it and a resistance if price closes below it. A bar that closes beyond it by 0.25 times the ATR breaks it, and it stays as a dotted grey line up to that bar. A new level within 0.50 times the ATR of an existing one of the same type adds a touch to it instead of a duplicate. Levels use closed bars only.

How to use it

  1. Attach the indicator to any chart.
  2. Read the colors: green under price is a support, red above is a resistance, and the number after the price is how many times price tested it.
  3. Wait for price to reach a zone, then act only when a bar closes back away from it, with your stop on the other side of the zone.
  4. A grey cross marks a break. If price returns to that level, the retest alert tells you.

Key settings

Setting What it does Default
Base MA period Length of the moving average behind the baseline 200
Plateau minimum length (closed bars) Bars the baseline must stay flat before a level exists; fewer bars give more levels 5
Break = close beyond level by x ATR How far a close must go beyond a level to break it 0.25
Zone half-width / touch distance (x ATR) Half-height of the zone and the distance that counts as a touch 0.10
Active levels shown (nearest to price) How many levels are drawn, nearest first 6
Alert on new level / break / retest / touch Choose the events, then pick popup, sound or push Touch off; no channel on

Other settings control colors, zones, labels, markers and the sound file.

Test it before you decide

No repaint is something you can check yourself. Let a bar close, then check that the Data Window values of the nearest support and resistance for that bar do not change. To test it: open the Strategy Tester, select this indicator and run it in visual mode on your pair and timeframe.

Updates are free and included. Every release is listed in the What's new section of this page, so you always know what changed.

Fabii Memory Baseline is a separate indicator that shows the baseline itself, with a higher timeframe overlay and its own alerts. Fabii Memory Distance Oscillator is a separate indicator that shows, in a sub-window, how far price is from the baseline. Follow my profile to be notified when new indicators are published.

Get it and see your first levels on your own chart. Fabii Memory Baseline adds the baseline line and a higher timeframe overlay.

Comments and reviews

Questions? Post a comment on this page or message me and you get an answer within 24 hours.

If this saves you time, a short review that says which pair and timeframe you use helps other traders find it.

Past results do not predict future results. This indicator does not provide financial advice.
More from author
Fabii Universal Trend Baseline
Fabien Georges Andre Guillemaud
Test 18 baselines on one chart and keep the one that fits your market. One dropdown, one logic, no second indicator. No repaint. Any pair, any market, any timeframe. Free demo in the Strategy Tester. Get more indicators here Baselines, volatility filters and oscillators. No repaint. Why you need it The baseline that works on one pair reacts too late on another, or too often in a range. Changing it means loading another indicator and rebuilding your chart. So you keep a baseline that does not
Fabii Half Trend Baseline
Fabien Georges Andre Guillemaud
Stop trading against the higher timeframe trend. Two baselines, one chart. No repaint. Any pair, any timeframe. On your chart in 2 minutes. Free demo in the Strategy Tester. Get more indicators here Baselines, volatility filters and oscillators. No repaint. Why you need it You enter a trade because a line turned green on your chart. Then you open a higher timeframe and see that the bigger trend points the other way. The signal was real. The trend behind it was not on your side. Every trade ta
Fabii Memory Distance Oscillator
Fabien Georges Andre Guillemaud
See how far price has stretched from its baseline, and when it starts to pull back. One histogram, one read. No repaint. Any pair, any timeframe, any market. On your chart in 2 minutes, free. Get more indicators here Baselines, volatility filters and oscillators. No repaint. Why you need it You see a strong move and you want in. Price is already far from its average, you enter late, and the market pulls back right after. Or you wait for a pullback and cannot tell a pause from the end of the t
FREE
Fabii Vwap SSL Baseline
Fabien Georges Andre Guillemaud
Stop guessing which VWAP cross matters: one coloured line shows your side. No repaint. Any pair. Daily, weekly or monthly anchor. On your chart in 2 minutes. Free to test in the Strategy Tester. Get more indicators here Baselines, volatility filters and oscillators. No repaint. Why you need it Most traders read the Volume Weighted Average Price (VWAP) as a single line and argue about every touch. This baseline gives a clear side instead: green when buyers hold the period, red when sellers do.
FREE
Fabii Essential Trend Baseline
Fabien Georges Andre Guillemaud
Stop entering trend flips that have no momentum behind them. One line, one chart, no second indicator. No repaint. Any pair, any market, any timeframe. On your chart in 2 minutes. Free to test in the Strategy Tester. Get more indicators here Baselines, volatility filters and oscillators. No repaint. Why you need it You enter because the line turned green. Price drifts for ten bars, then reverses. The signal was real, but the momentum was not. Every entry on a weak flip costs you a stop loss.
FREE
Fabii Volatility Bias
Fabien Georges Andre Guillemaud
Spot which side, up or down, drives volatility in one zero-centered histogram. No repaint. Any market, any timeframe. On your chart in 2 minutes. Free demo in the Strategy Tester. Get more indicators here Baselines, volatility filters and oscillators. No repaint. Why you need it A move looks strong: green candles, price climbing. But you cannot tell if real upward volatility carries it, or if it creeps up in small steps while the larger swings point down. A normal volatility reading shows how
Fabii Rsx Ema Oscillator
Fabien Georges Andre Guillemaud
Stop guessing when momentum turns: a smooth RSX line and a signal cross show you. No repaint. Any pair, any timeframe. On your chart in 2 minutes. Free demo in the Strategy Tester. Get more indicators here Baselines, volatility filters and oscillators. No repaint. Why you need it You watch a momentum oscillator and every touch of its signal line looks like a turn. The line jumps from candle to candle, the histogram flips color on small moves, and you are left deciding which cross matters. You
Fabii Atr Volatility Zones
Fabien Georges Andre Guillemaud
See if each candle's volatility is low, medium or high for this market, in three colors. No repaint. Any pair, any timeframe, any market. On your chart in 2 minutes. Free to test in the Strategy Tester. Get more indicators here Baselines, volatility filters and oscillators. No repaint. Why you need it The same range means different things on different markets and at different times. You look at the last candle and cannot tell if its range is large or small for this market right now. Fixed Ave
FREE
Fabii Yang Zhang Volatility Filter
Fabien Georges Andre Guillemaud
Know when volatility is enough to trade — live, no repaint, on any pair. Any pair, any timeframe. Lines lock on bar close. Free demo in the Strategy Tester. >> Get more free and premium indicators here Baseline, volatility, oscillators and more. No repainting. No guessing. Just clean signals. THE PROBLEM Your entry can be right and still go nowhere. When the market is quiet, price drifts, stops get tagged by noise and targets take forever. Every bar you trade in a quiet market is a tra
Fabii Nma Ssl Channel
Fabien Georges Andre Guillemaud
Get a clear trend line that holds in trends and stays quiet in noise — no repaint. Any pair, any timeframe. Signals lock on bar close. Free to download. Test it in the Strategy Tester before using it live. >> Get more free indicators here Baseline, volatility, oscillators & more — free and premium. No repainting. No guessing. Just clean signals. THE PROBLEM Most SSL channels use a fixed-speed moving average. That means the line reacts the same whether price is trending hard or grindin
FREE
Fabii Adxvma Ssl Channel
Fabien Georges Andre Guillemaud
One clean trend line that follows the lows while the trend holds, and flips above price only when the move truly turns. No repaint. Any pair, any timeframe. Every flip is final on bar close. Try it free on your own charts in the Strategy Tester. >> Get more free indicators here Baseline, volatility, oscillators & more — free and premium. No repainting. No guessing. Just clean signals. THE PROBLEM Most trend lines flip too early. A classic SSL channel rides two simple moving averages,
FREE
Fabii Adaptive Trend Baseline
Fabien Georges Andre Guillemaud
Stay in the trend with a baseline that slows down in noise and speeds up in moves. Five adaptive averages. No repaint. Any pair, any market, any timeframe. Free demo in the Strategy Tester. Get more indicators here Baselines, volatility filters and oscillators. No repaint. Why you need it A fixed-speed average lags in a strong move and jumps around in noise. You enter late, or you enter on a small swing. Neither entry matches the market you are trading. Every late or noisy entry costs you a s
FREE
Fabii Ehlers Adaptive Bands
Fabien Georges Andre Guillemaud
Know exactly when the trend flips — before you miss the move. Signals lock on bar close, no repaint. Any pair, any timeframe. Free demo in the Strategy Tester. THE PROBLEM Most trend tools give you a direction — but they keep repainting until the bar closes, or they lag so far behind that the entry is gone by the time they confirm. You end up either chasing or sitting out clean moves. Every bar you misread the regime is a trade you size wrong or skip entirely. THE SOLUTION Fabi
FREE
Fabii NNFX Atr Levels
Fabien Georges Andre Guillemaud
Plan every trade with one click: Entry, Take Profit and Stop Loss drawn for you. No repaint. Any pair, any timeframe. On your chart in 2 minutes. Free to test in the Strategy Tester. Get more indicators here Baselines, volatility filters and oscillators. No repaint. Why you need it You plan an Average True Range (ATR) trade by hand. You read the ATR, multiply it, convert it to price, then calculate the lot size. Each step can add an error, and the numbers are different on every trade. A mispl
Fabii Kaufman Efficiency Ratio
Fabien Georges Andre Guillemaud
See at a glance whether price is trending or just moving in noise, on one line from 0 to 1. No repaint. Any pair, any timeframe. On your chart in 2 minutes. Free demo in the Strategy Tester. Get more indicators here Baselines, volatility filters and oscillators. No repaint. Why you need it You see a clean move on the chart and you enter. A few bars later price stalls, drifts sideways and takes you out. The move looked like a trend, but most of it was back and forth. Direction alone does not t
FREE
Fabii Volatility ATR Percentile
Fabien Georges Andre Guillemaud
See if Average True Range (ATR) volatility is quiet or stretched, as a 0 to 100 rank. No repaint. Any pair, any timeframe. On your chart in 2 minutes. Free demo in the Strategy Tester. Get more indicators here Baselines, volatility filters and oscillators. No repaint. Why you need it A raw ATR value such as 0.0040 tells you little. Is that high for this pair right now, or normal? To know, you have to scroll back through weeks of bars and guess. So you enter a trade in a market that is asleep,
FREE
Fabii Volatility Acceleration Index
Fabien Georges Andre Guillemaud
See at a glance when volatility is speeding up before a move — and when it is fading into a dead market. Any pair, any timeframe. No repaint — signals are final on bar close. Try it free in the Strategy Tester before you buy. THE PROBLEM Most volatility tools tell you how big the range is right now. They do not tell you the one thing that matters for timing: is volatility accelerating or slowing down? You end up entering just as a move runs out of steam, or sitting out while a breakout
FREE
Fabii Memory Baseline
Fabien Georges Andre Guillemaud
Read the trend and its higher timeframe on one chart, with a line that holds its level. No repaint. Any pair, any timeframe. On your chart in 2 minutes. Free demo in the Strategy Tester. Get more indicators here Baselines, volatility filters and oscillators. No repaint. Why you need it A plain moving average falls behind price. After a strong move, the line stays far from price and gives you a level that no longer matters. To check the higher timeframe, you switch charts and lose the picture
FREE
Fabii Supertrend NMA
Fabien Georges Andre Guillemaud
Hold the trend through range noise with a SuperTrend on an adaptive center. No repaint. Any pair, any timeframe. On your chart in 2 minutes. Free to test in the Strategy Tester. Get more indicators here Baselines, volatility filters and oscillators. No repaint. Why you need it You enter because the SuperTrend flipped. Price moves sideways for a few bars, the line flips back, and you are out of the trade or you skip the next signal. The classic SuperTrend is centered on median price, so each w
Fabii Adxvma Ssl Pro
Fabien Georges Andre Guillemaud
One adaptive SSL trend line that only flips when the move is real, plus a second SSL baseline from a higher timeframe on the same chart, Buy/Sell arrows, and an ATR filter that blocks weak signals before they reach you. No repaint. Try the free version first: Fabii Adxvma Ssl Channel. THE PROBLEM A classic SSL channel flips on every small push. Even the adaptive ADXVMA version flips too often in choppy markets, fires arrows on signals that reverse the next bar, and shows you only one ti
Fabii Nma Ssl Pro
Fabien Georges Andre Guillemaud
Know the trend direction before you enter — adaptive SSL line with an ATR filter that blocks weak flips. No repaint. Any pair, any timeframe. Signals lock on bar close. Test it free in the Strategy Tester before buying. THE PROBLEM Standard SSL channels flip at every small push against the trend. You take the signal, price reverses immediately, and you stop out. Tighten the filter, you miss real moves. Loosen it, you drown in noise. And watching one timeframe only, you never know whethe
Fabii Responsive Trend Baseline
Fabien Georges Andre Guillemaud
Spot trend flips sooner with a low-lag baseline. Five fast averages, one chart, no second indicator. No repaint. Any pair, any market, any timeframe. Free demo in the Strategy Tester. Get more indicators here Baselines, volatility filters and oscillators. No repaint. Why you need it A slow average confirms the trend after the move is already underway. You see the flip late and you enter late. Every late entry costs you a worse price and a wider stop loss. What you get Fabii Responsive Trend B
Fabii Ehlers Trend Baseline
Fabien Georges Andre Guillemaud
Read the trend on a smoother line with fewer small wiggles. Five signal-processing filters, one chart. No repaint. Any pair, any market, any timeframe. Free demo in the Strategy Tester. Get more indicators here Baselines, volatility filters and oscillators. No repaint. Why you need it A noisy line flips on every small swing. You see a new signal, you enter, and the move reverses. Each false flip costs you a stop loss. What you get Fabii Ehlers Trend Baseline is a baseline indicator with five
FREE
Fabii Coral Trend
Fabien Georges Andre Guillemaud
Know your trend bias on two timeframes at once — no repaint, signals final on bar close. Any pair, any timeframe, any market. Free demo in the Strategy Tester. >> Get more free and premium indicators here Baseline, volatility, oscillators & more. No repainting. No guessing. Just clean signals. THE PROBLEM You know the chart-timeframe trend. But you do not know whether the higher timeframe agrees — until you flip to it, then flip back, and the moment is gone. Entering with the short-t
FREE
Fabii Htf Po3 Candle Projection
Fabien Georges Andre Guillemaud
See the higher timeframe candle form next to price, with a countdown to its close. No repaint. Any symbol. On your chart in 2 minutes. Free to test in the Strategy Tester. Get more indicators here Baselines, volatility filters and oscillators. No repaint. Why you need it You trade on M5 or M15, but the daily candle sets the frame for the day. To see where it opened, how far it has stretched and how long it has left, you switch to another chart or open a second window. Each switch takes your e
Fabii Confluence Oscillator
Fabien Georges Andre Guillemaud
Stop counting signals by eye: seven classic indicators vote in one score from -100 to +100. No repaint. Any pair, any timeframe. On your chart in 2 minutes. Free to test in the Strategy Tester. Get more indicators here Baselines, volatility filters and oscillators. No repaint. Why you need it You stack several indicators in sub-windows and count their signals by eye. One turns up, another is flat, a third points the other way. You enter on a majority that was only one vote deep, price drifts
FREE
Filter:
No reviews
Reply to review