Gravity Magnet MT4
- Indicators
-
Agus Santoso
 DISCLAIMER ON : The author of EA will not be held responsible for your losses or problems of any kind if the EA is directly or indirectly responsible for any losses.
Our software is provided “as is”, without any warranty or condition of any kind, express, implied or statutory. - Version: 1.0
- Activations: 5
MQL5 Blogs : https://www.mql5.com/en/blogs/post/776607
MT4 Version : https://www.mql5.com/en/market/product/198437
MT5 Version : https://www.mql5.com/en/market/product/198438
GRAVITY MAGNET [tambangEA] is an advanced market-structure and liquidity-attraction indicator designed to help traders understand where price may be drawn next and how strong the competing bullish and bearish liquidity forces are.
Instead of relying on a single trend signal, Gravity Magnet analyzes multiple structural liquidity sources, ranks them by strength, distance, freshness, market regime, and trend context, then converts the result into an easy-to-read Market Gravity framework.
The indicator is designed as a decision-support tool, not a prediction engine. Gravity values represent relative market attraction and pressure, not statistical probabilities of future price movement.
Core Concept
Financial markets often move toward areas where liquidity is concentrated.
Gravity Magnet identifies and ranks these areas as potential Liquidity Magnets, including:
- Swing High and Swing Low liquidity
- Equal Highs and Equal Lows
- Major structural swings
- Previous Day High / Low
- Previous Week High / Low
- Repeated rejection structures
- Clustered liquidity zones
Each liquidity pool is continuously evaluated and assigned a dynamic Gravity Score.
The strongest levels are displayed as:
Primary Magnet
Secondary Magnet
Tertiary Magnet
for both the upper and lower sides of the market.
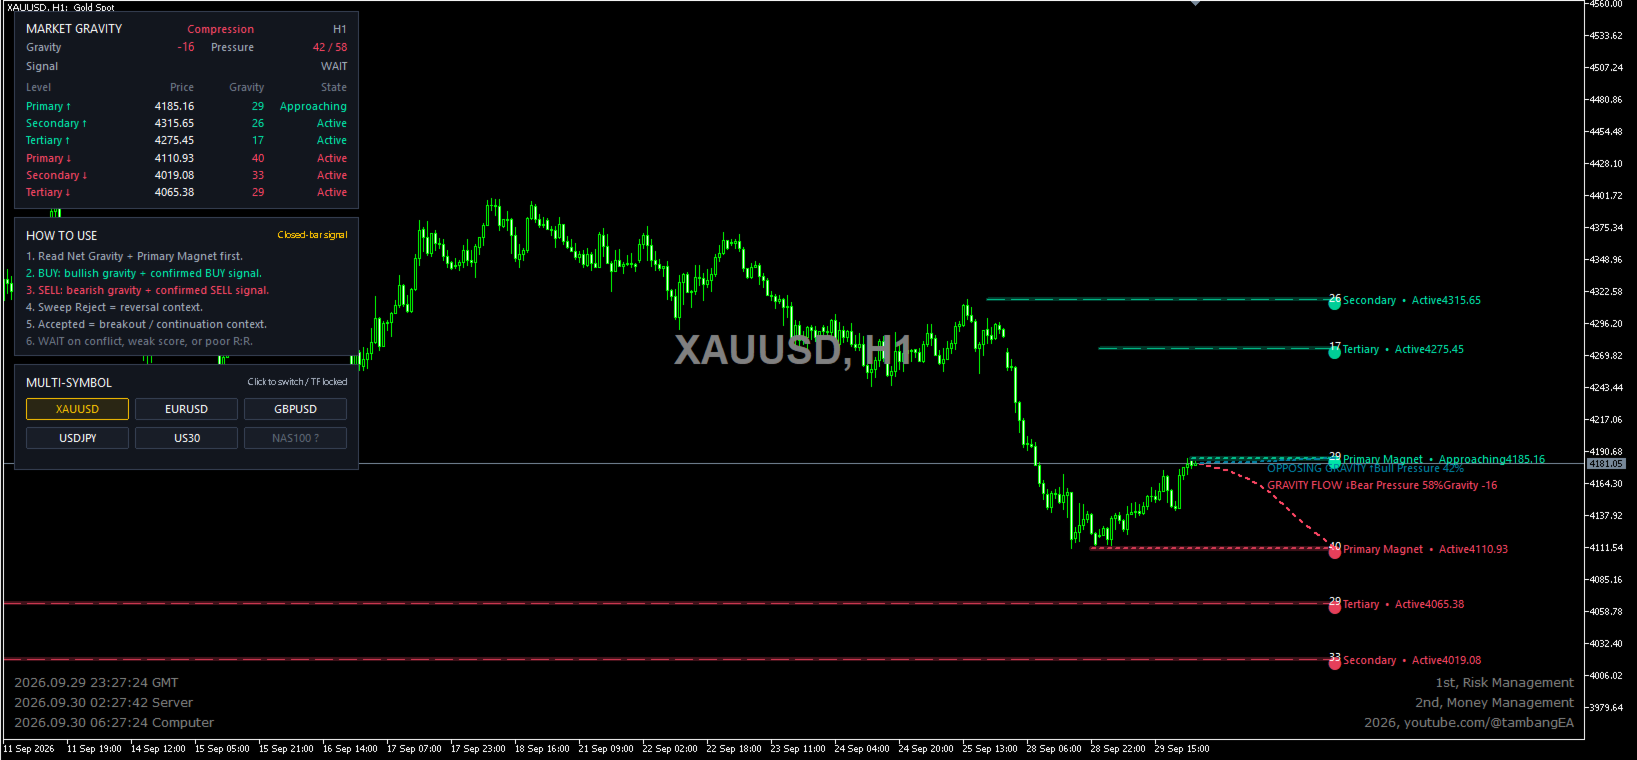
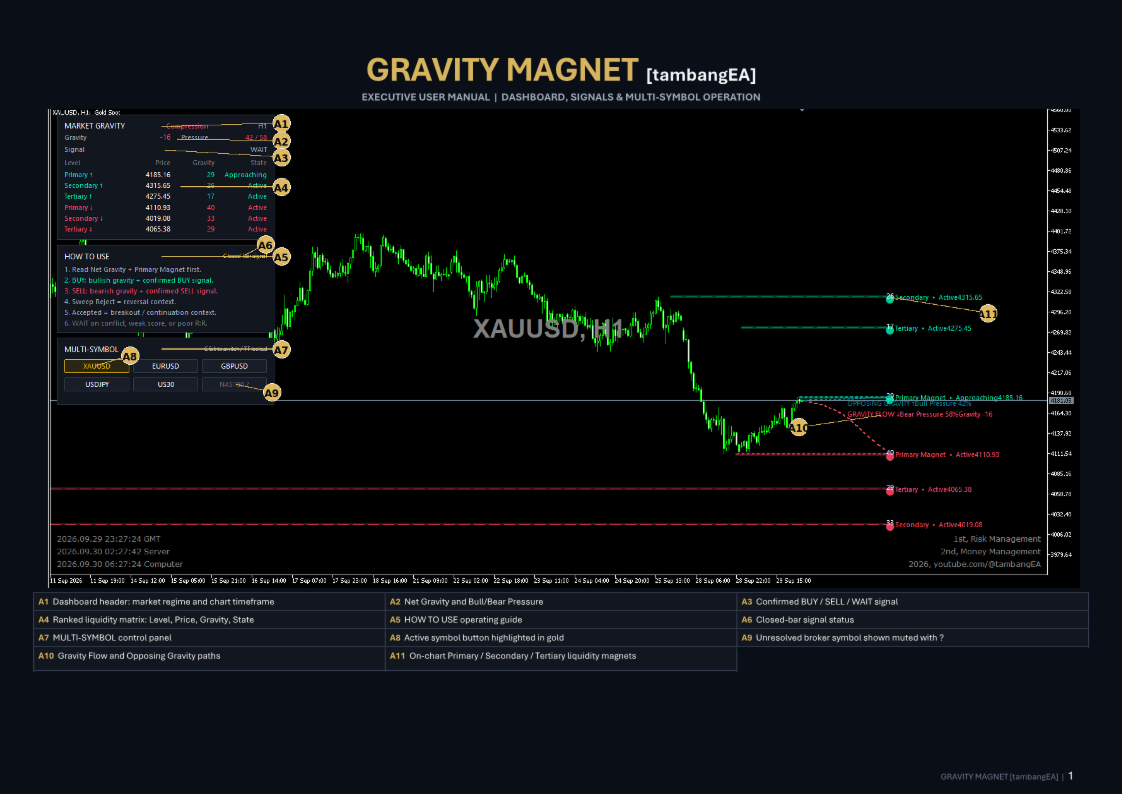
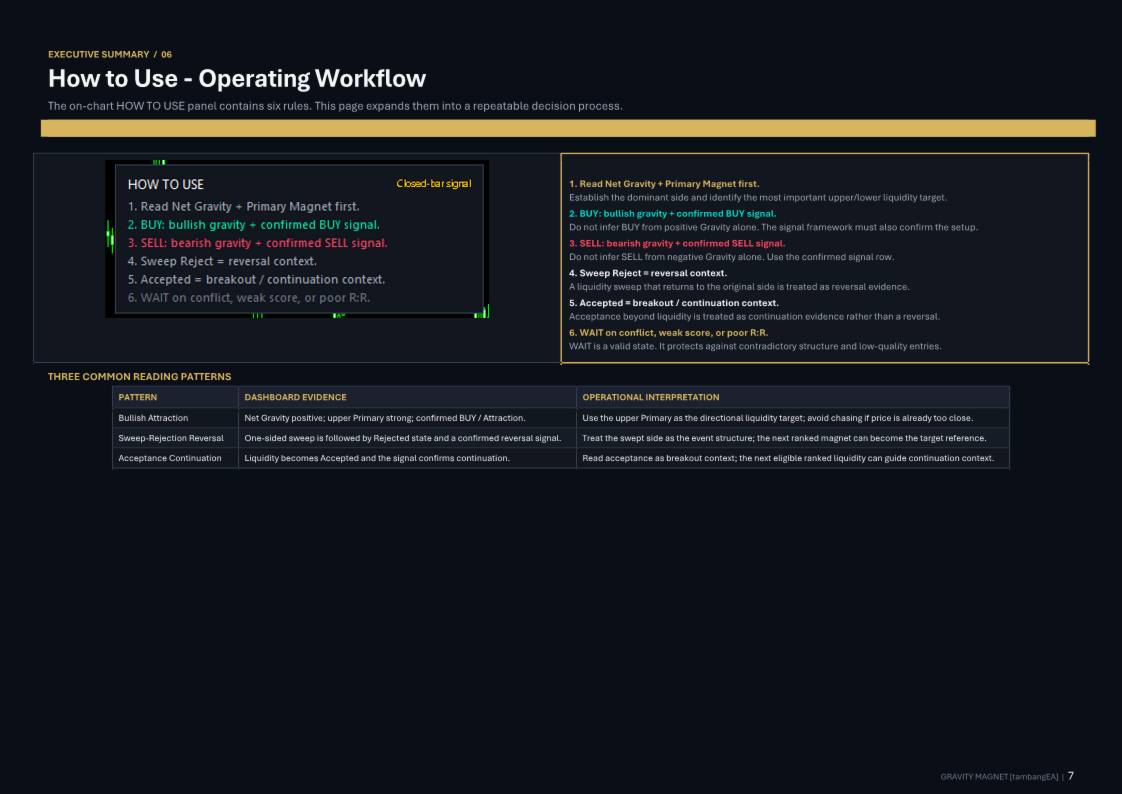
Market Gravity Dashboard
The integrated dashboard provides a compact overview of the current market condition.
Gravity
Displays the current Net Gravity on a scale from approximately:
-100 to +100
Positive values indicate stronger attraction toward upper liquidity.
Negative values indicate stronger attraction toward lower liquidity.
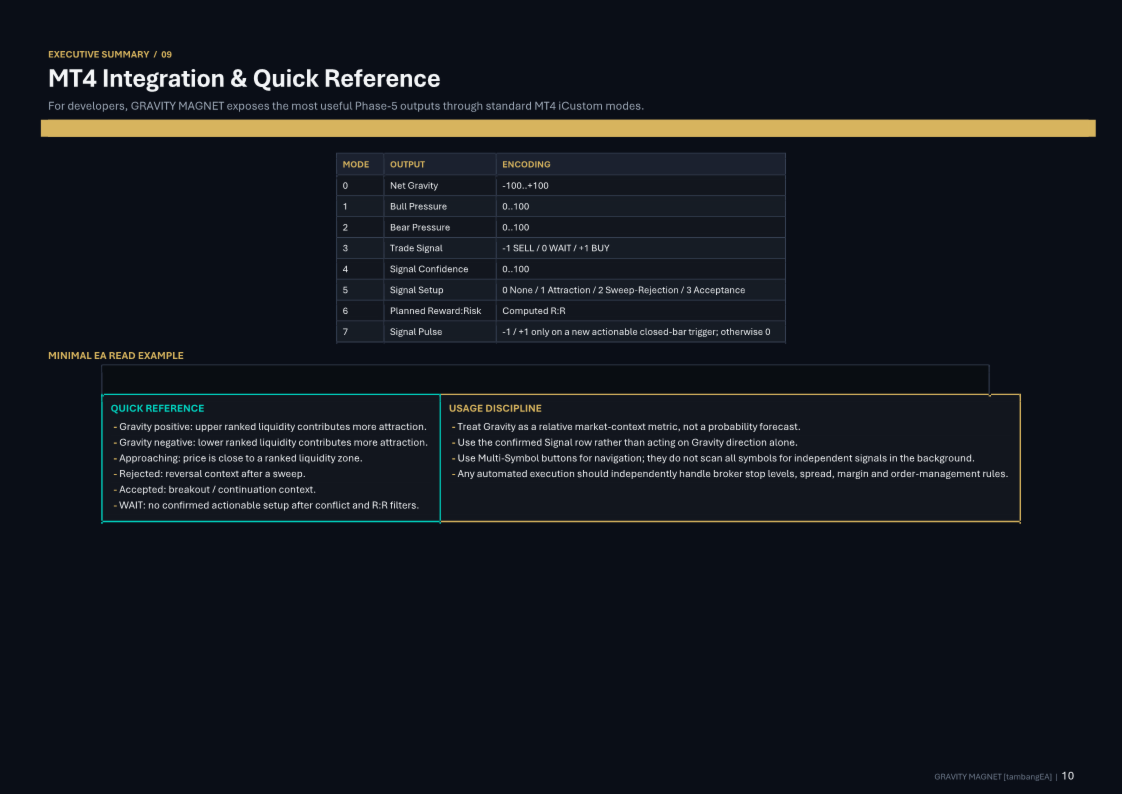
A Gravity reading should be interpreted together with liquidity location, market regime, signal state, and price structure.
Pressure
Displays the relative balance between:
Bull Pressure / Bear Pressure
Example:
42 / 58
means bearish liquidity pressure is currently stronger than bullish pressure.
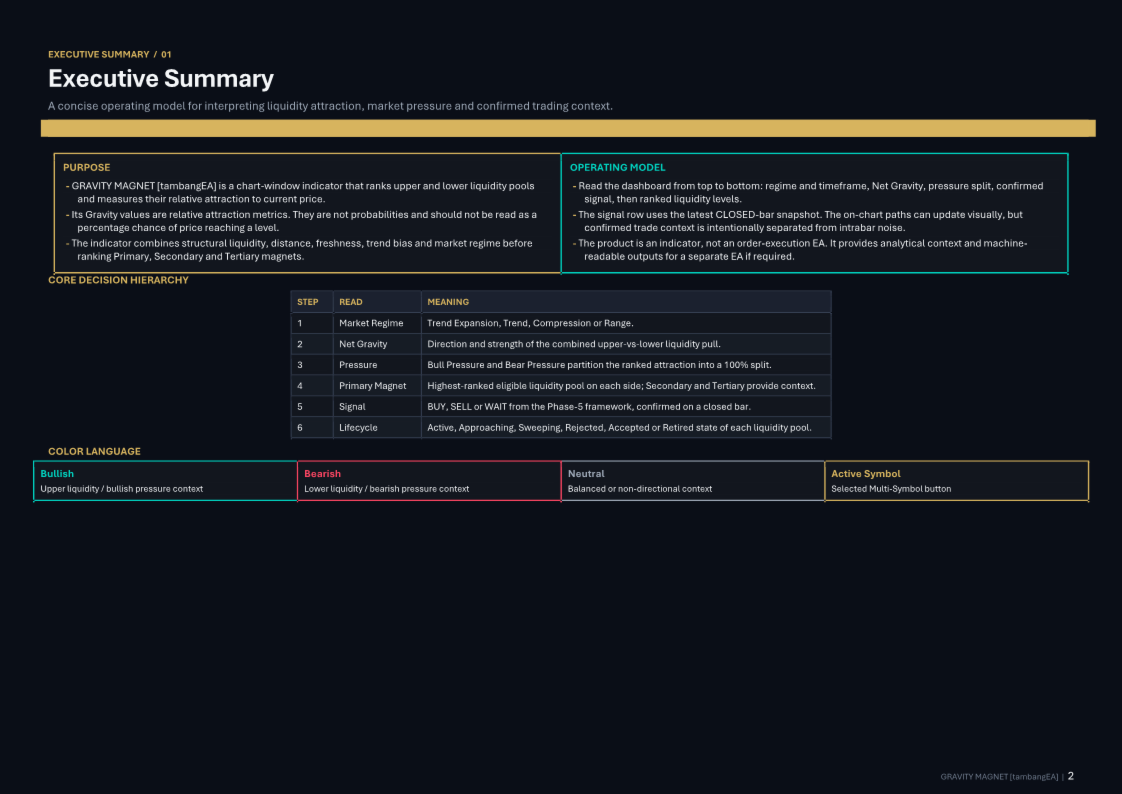
Market Regime Detection
Gravity Magnet automatically classifies the current market environment as:
- Range
- Compression
- Trend
- Trend Expansion
The regime engine combines volatility and directional-strength information to adjust how liquidity attraction is interpreted.
This is important because liquidity behaves differently during consolidation, compression, and strong directional expansion.
Liquidity Magnet Ranking
Gravity Magnet continuously ranks the strongest liquidity targets on both sides of the market.
Each level displays:
- Level hierarchy
- Price
- Gravity Score
- Lifecycle State
The hierarchy is:
Primary → Secondary → Tertiary
The Primary Magnet represents the strongest currently ranked liquidity attraction according to the indicator's internal scoring model.
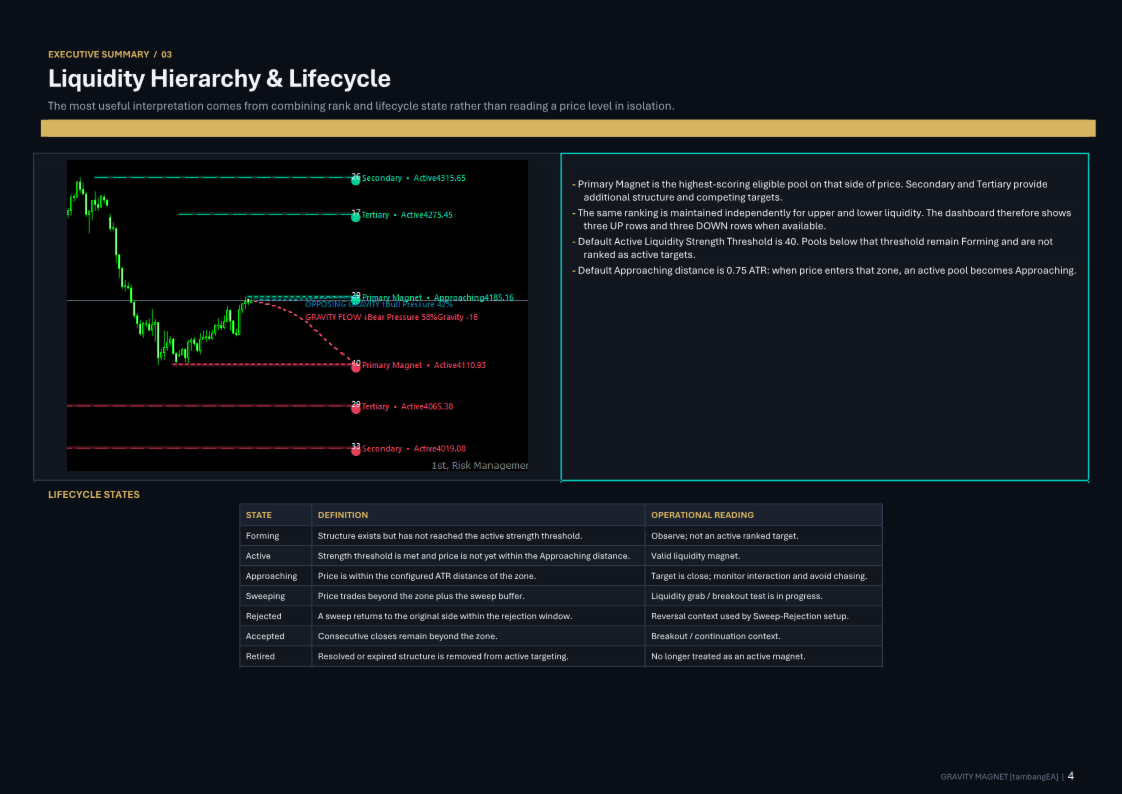
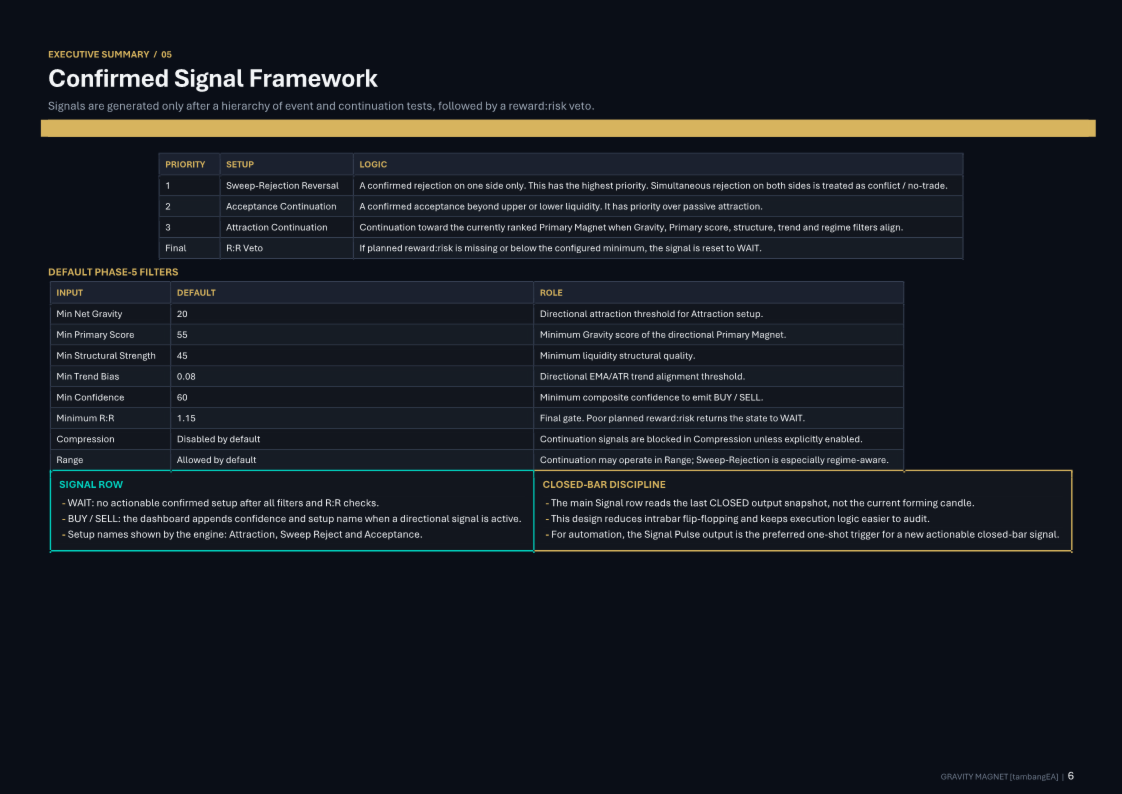
Liquidity Lifecycle
Each detected liquidity structure moves through a lifecycle.
Forming
The liquidity structure has been identified but has not yet reached the minimum structural-strength requirement.
Active
A valid liquidity pool exists and remains available as a potential market magnet.
Approaching
Price has entered the configured proximity zone around the liquidity pool.
Sweeping
Price has penetrated beyond the liquidity zone and is actively testing the available liquidity.
Rejected
The market swept the liquidity but returned to the original side of the structure.
This can provide a reversal context.
Accepted
Price moved through the liquidity zone and maintained closes beyond it.
This can provide a breakout or continuation context.
Retired
The liquidity structure is no longer considered active.
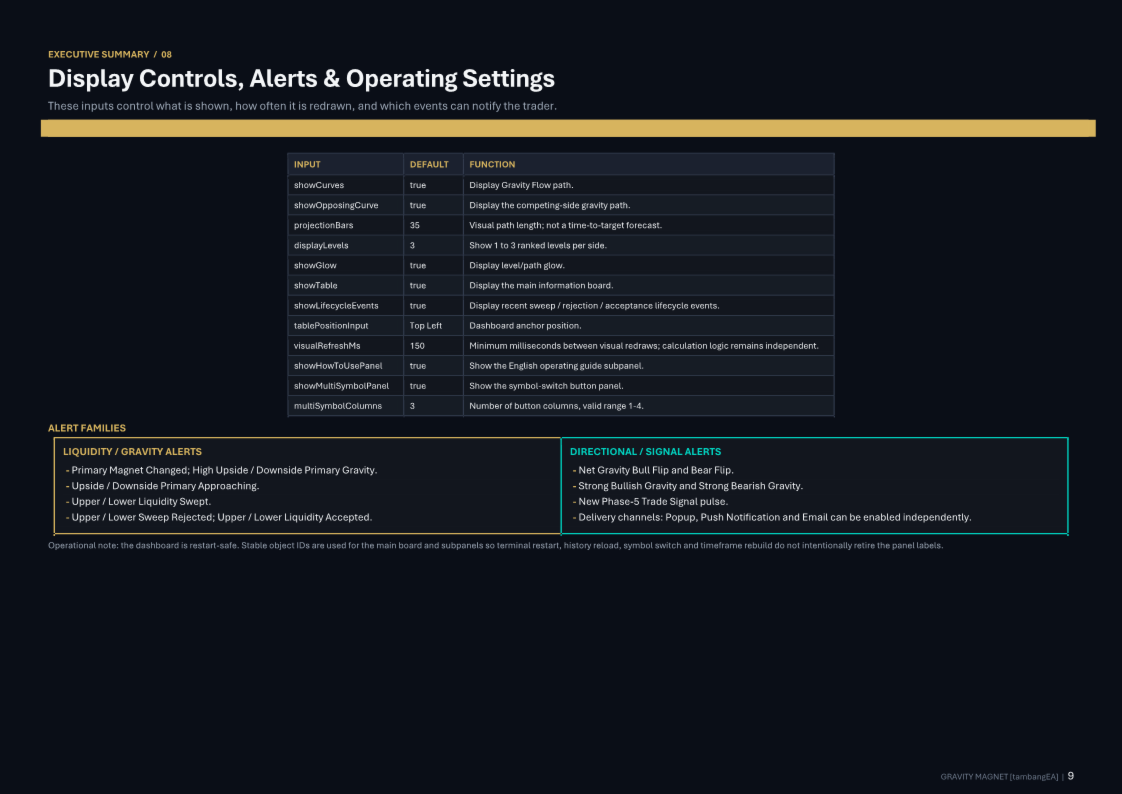
GRAVITY FLOW
The projected Gravity Flow visually connects current price with the dominant Primary Magnet.
It represents the current directional attraction model.
It is important to understand that the curve is a visual projection of market attraction, not a prediction of the exact future price path or timing.
Gravity Flow can display:
- directional gravity
- Bull/Bear Pressure
- Net Gravity value
OPPOSING GRAVITY
Markets normally contain liquidity on both sides.
The Opposing Gravity path displays the competing liquidity force against the dominant Gravity Flow.
This helps traders avoid viewing the market as a simple one-directional signal.
A strong Primary Magnet may exist while significant opposing liquidity remains active on the other side.