
GRAVITY MAGNET

MQL5 Blogs : https://www.mql5.com/en/blogs/post/776607
MT4 Version : https://www.mql5.com/en/market/product/198437
MT5 Version : https://www.mql5.com/en/market/product/198438
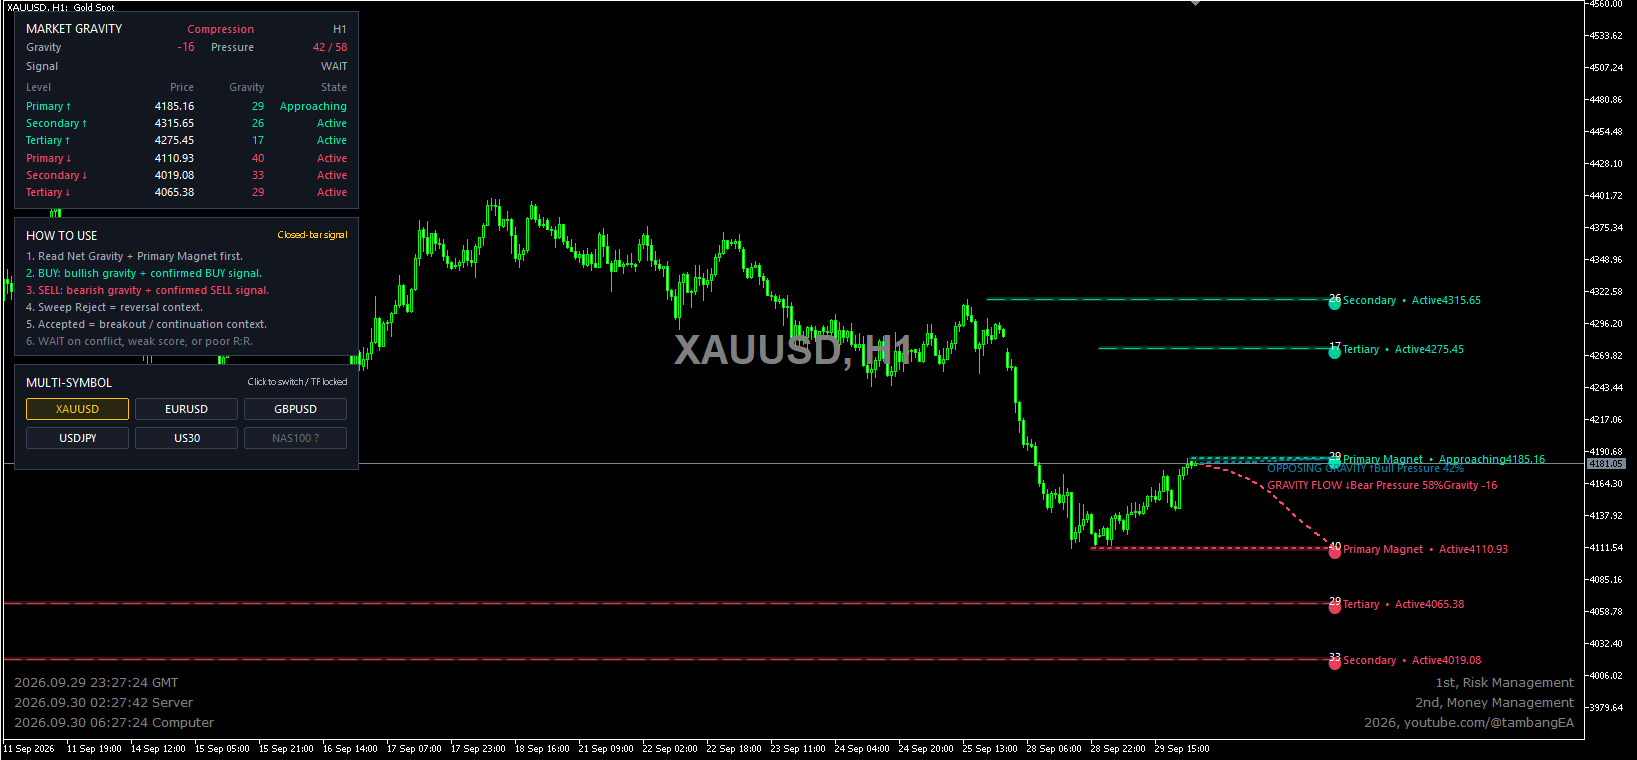
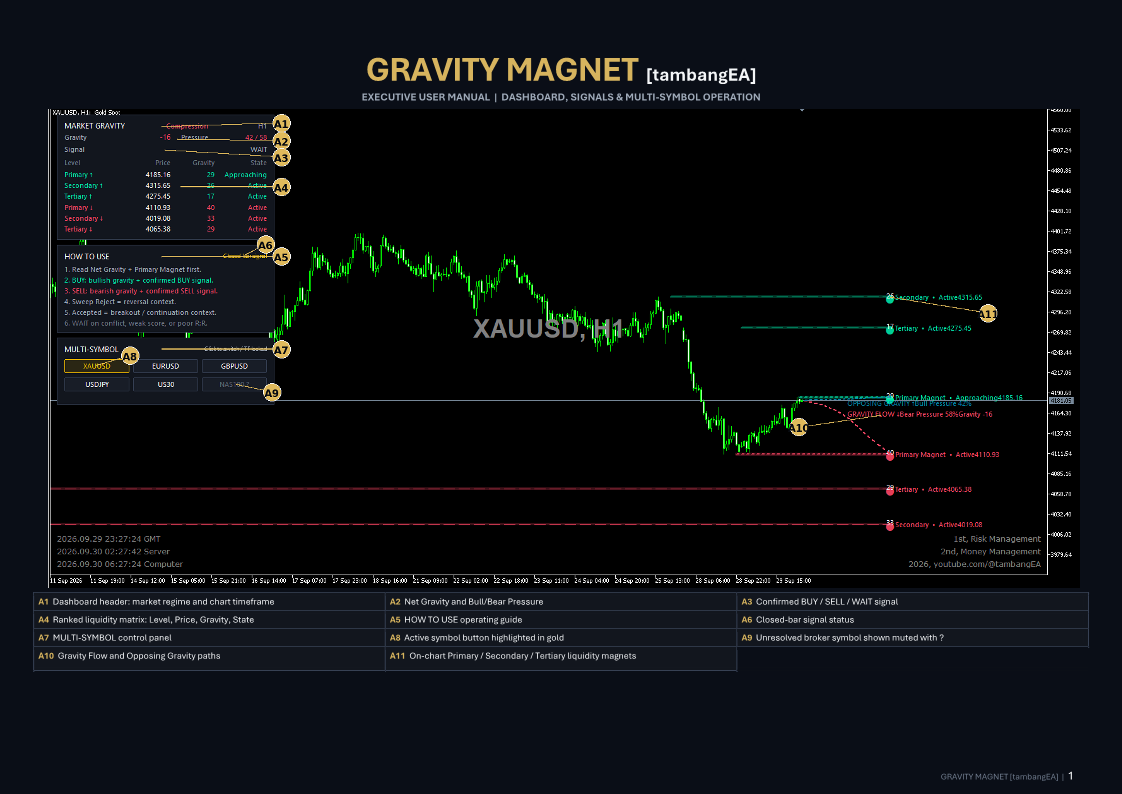
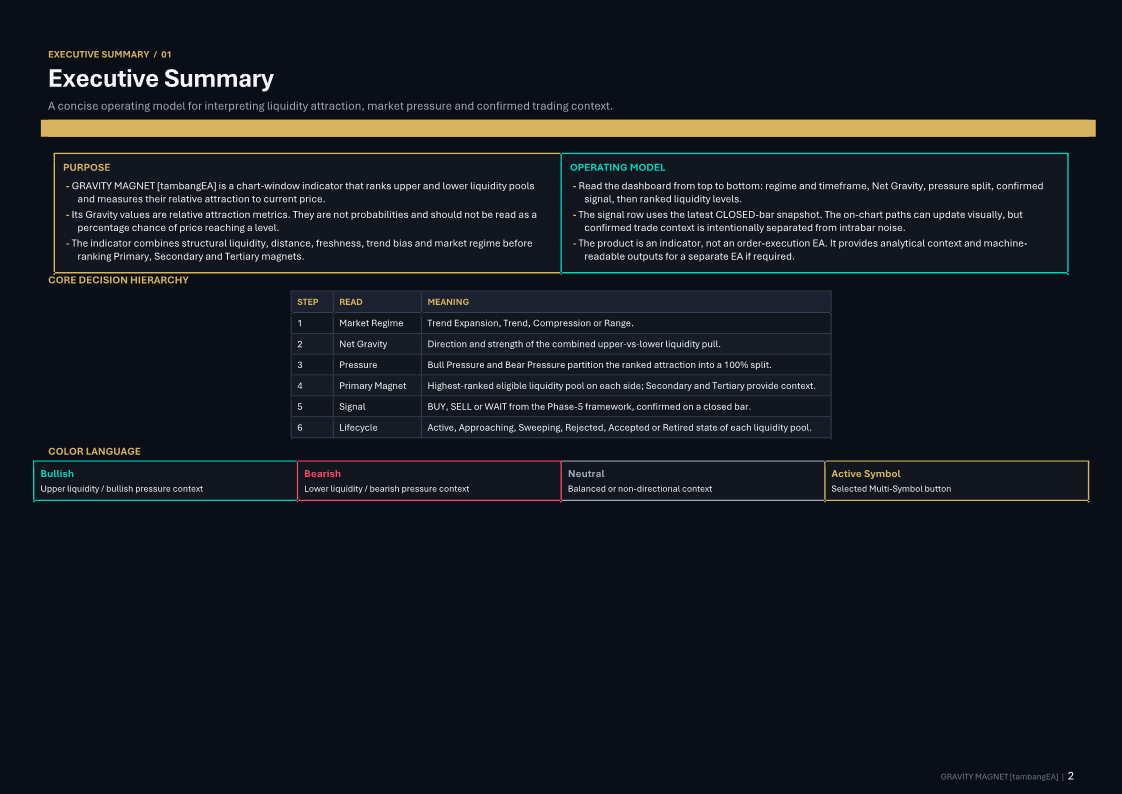
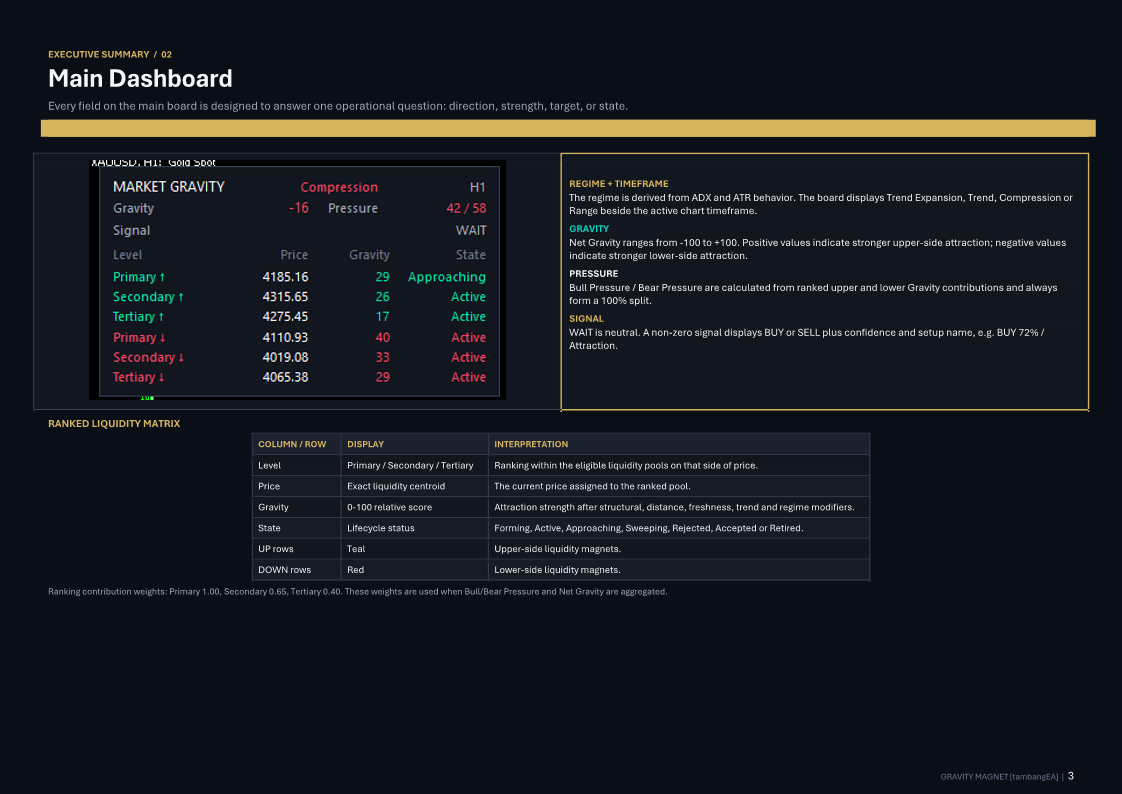
GRAVITY MAGNET [tambangEA] is an advanced market-structure and liquidity-attraction indicator designed to help traders understand where price may be drawn next and how strong the competing bullish and bearish liquidity forces are.
Instead of relying on a single trend signal, Gravity Magnet analyzes multiple structural liquidity sources, ranks them by strength, distance, freshness, market regime, and trend context, then converts the result into an easy-to-read Market Gravity framework.
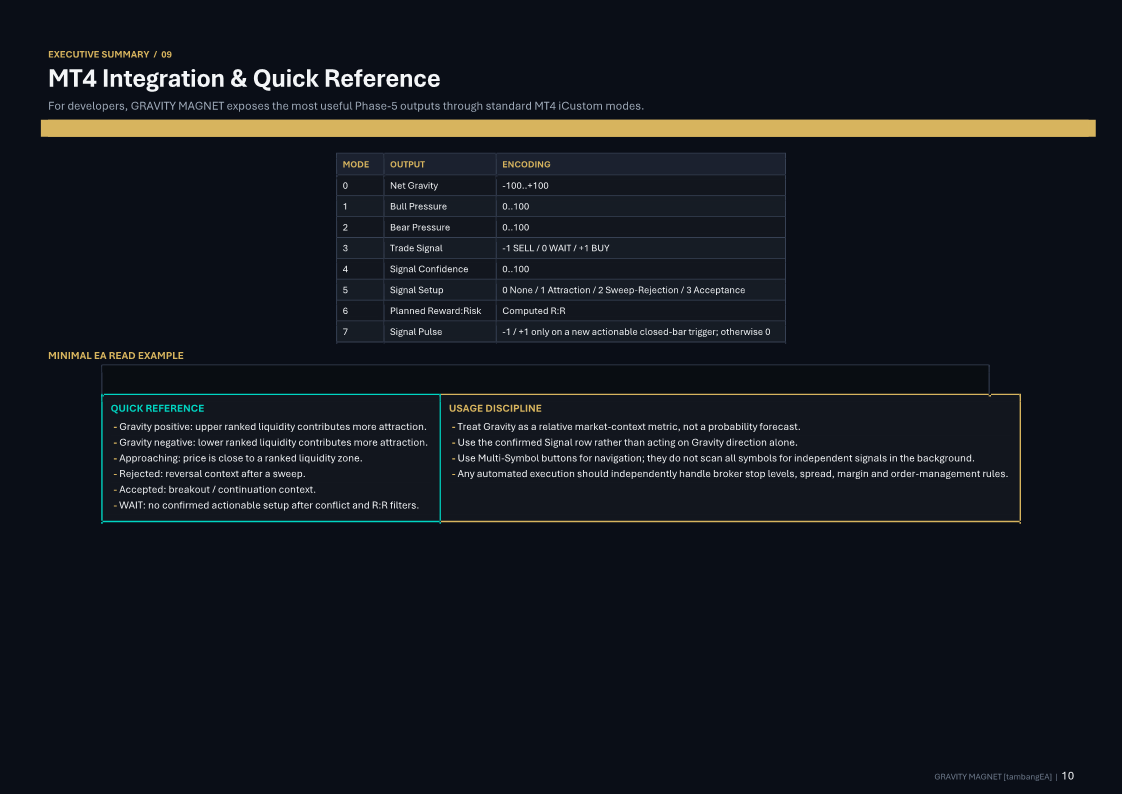
The indicator is designed as a decision-support tool, not a prediction engine. Gravity values represent relative market attraction and pressure, not statistical probabilities of future price movement.
Core Concept
Financial markets often move toward areas where liquidity is concentrated.
Gravity Magnet identifies and ranks these areas as potential Liquidity Magnets, including:
- Swing High and Swing Low liquidity
- Equal Highs and Equal Lows
- Major structural swings
- Previous Day High / Low
- Previous Week High / Low
- Repeated rejection structures
- Clustered liquidity zones
Each liquidity pool is continuously evaluated and assigned a dynamic Gravity Score.
The strongest levels are displayed as:
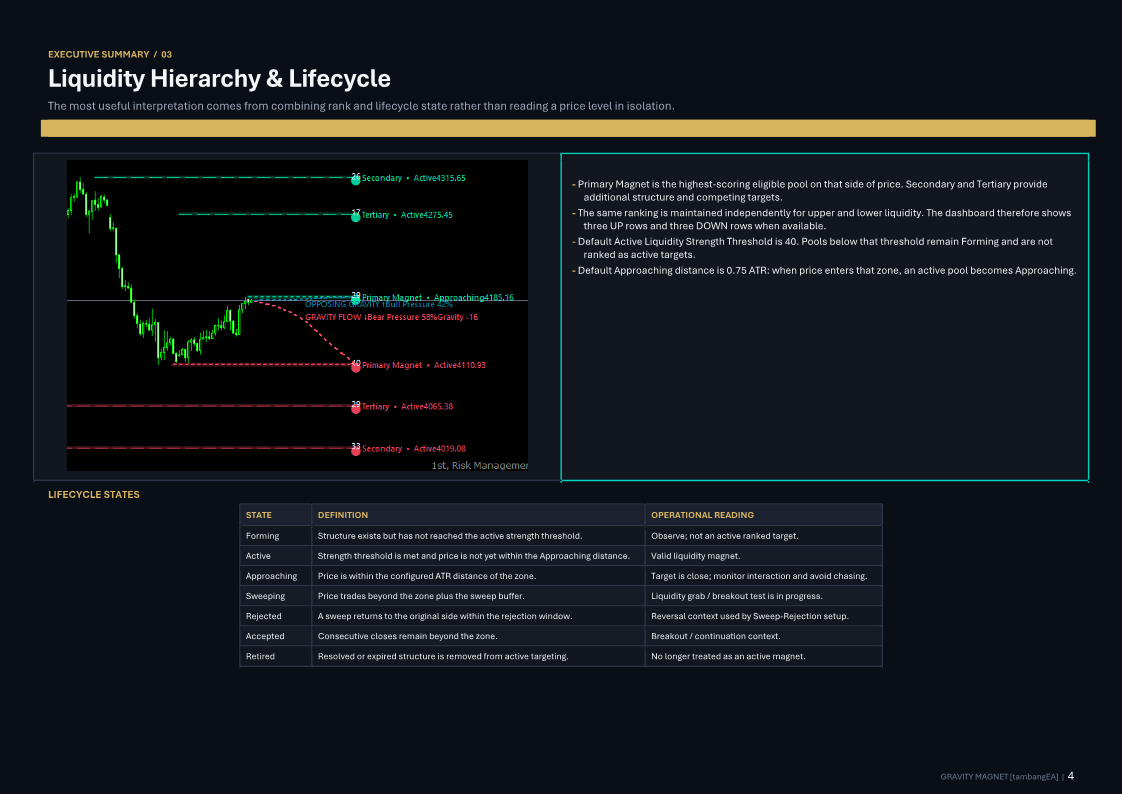
Primary Magnet
Secondary Magnet
Tertiary Magnet
for both the upper and lower sides of the market.
Market Gravity Dashboard
The integrated dashboard provides a compact overview of the current market condition.
Gravity
Displays the current Net Gravity on a scale from approximately:
-100 to +100
Positive values indicate stronger attraction toward upper liquidity.
Negative values indicate stronger attraction toward lower liquidity.
A Gravity reading should be interpreted together with liquidity location, market regime, signal state, and price structure.
Pressure
Displays the relative balance between:
Bull Pressure / Bear Pressure
Example:
42 / 58
means bearish liquidity pressure is currently stronger than bullish pressure.
Market Regime Detection
Gravity Magnet automatically classifies the current market environment as:
- Range
- Compression
- Trend
- Trend Expansion
The regime engine combines volatility and directional-strength information to adjust how liquidity attraction is interpreted.
This is important because liquidity behaves differently during consolidation, compression, and strong directional expansion.
Liquidity Magnet Ranking
Gravity Magnet continuously ranks the strongest liquidity targets on both sides of the market.
Each level displays:
- Level hierarchy
- Price
- Gravity Score
- Lifecycle State
The hierarchy is:
Primary → Secondary → Tertiary
The Primary Magnet represents the strongest currently ranked liquidity attraction according to the indicator's internal scoring model.
Liquidity Lifecycle
Each detected liquidity structure moves through a lifecycle.
Forming
The liquidity structure has been identified but has not yet reached the minimum structural-strength requirement.
Active
A valid liquidity pool exists and remains available as a potential market magnet.
Approaching
Price has entered the configured proximity zone around the liquidity pool.
Sweeping
Price has penetrated beyond the liquidity zone and is actively testing the available liquidity.
Rejected
The market swept the liquidity but returned to the original side of the structure.
This can provide a reversal context.
Accepted
Price moved through the liquidity zone and maintained closes beyond it.
This can provide a breakout or continuation context.
Retired
The liquidity structure is no longer considered active.
GRAVITY FLOW
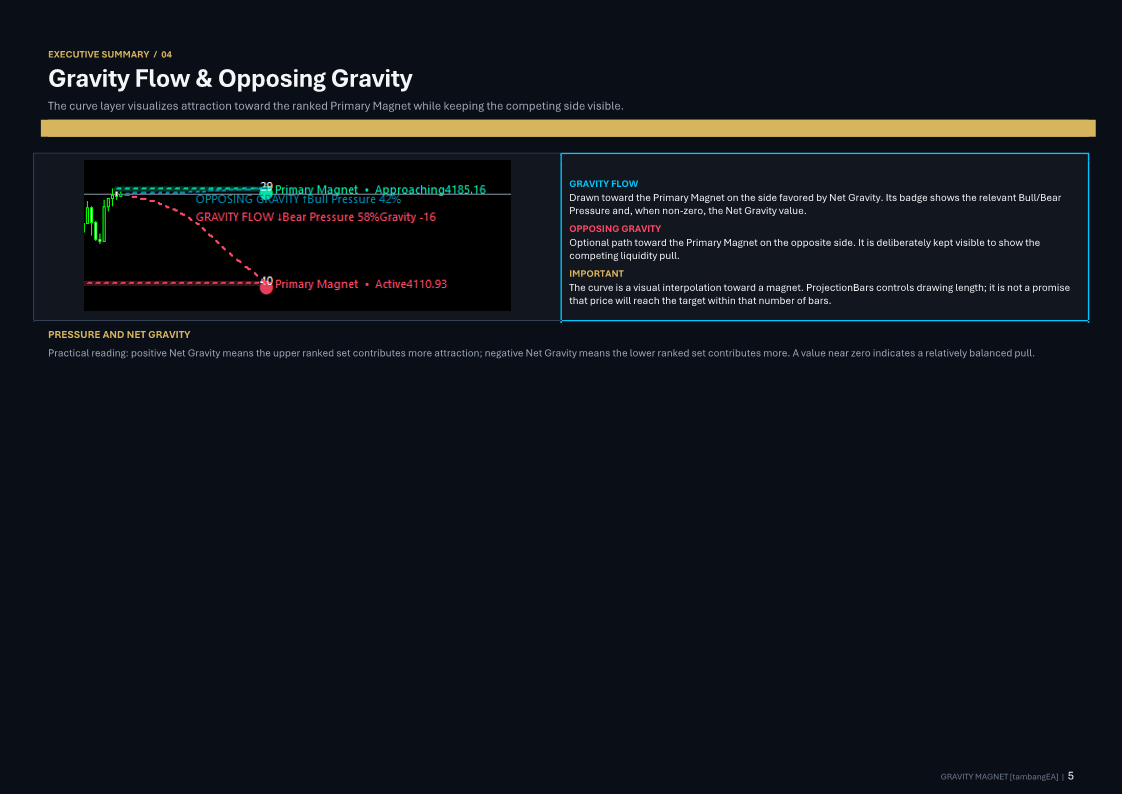
The projected Gravity Flow visually connects current price with the dominant Primary Magnet.
It represents the current directional attraction model.
It is important to understand that the curve is a visual projection of market attraction, not a prediction of the exact future price path or timing.
Gravity Flow can display:
- directional gravity
- Bull/Bear Pressure
- Net Gravity value
OPPOSING GRAVITY
Markets normally contain liquidity on both sides.
The Opposing Gravity path displays the competing liquidity force against the dominant Gravity Flow.
This helps traders avoid viewing the market as a simple one-directional signal.
A strong Primary Magnet may exist while significant opposing liquidity remains active on the other side.
Trading Signal Framework
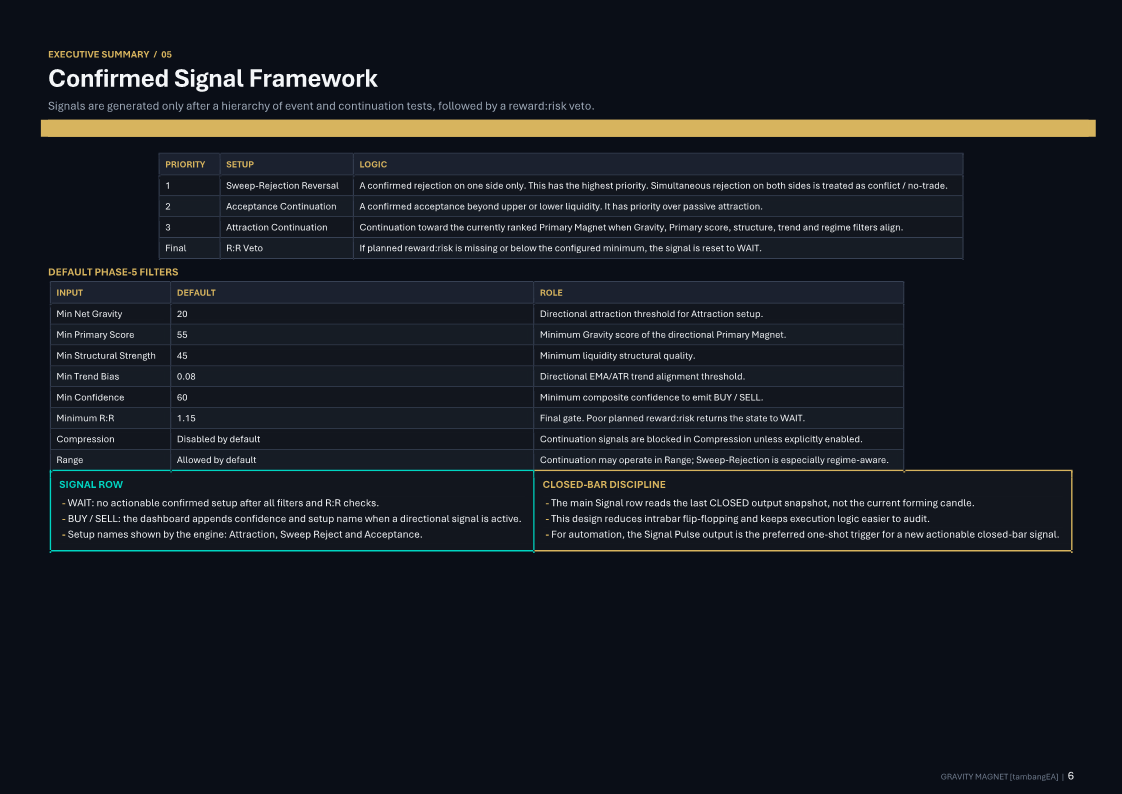
Gravity Magnet includes a structured signal engine with three main setup categories.
1. Attraction
A continuation setup in which market structure, trend context, Net Gravity, and the Primary Magnet support movement toward the dominant liquidity target.
2. Sweep Reject
A liquidity pool is swept but price returns to the original side.
This represents a potential liquidity-grab reversal context.
3. Acceptance
Price moves through a liquidity pool and confirms acceptance beyond the structure.
This represents a potential breakout / continuation context.
The dashboard displays:
BUY
SELL
or
WAIT
A BUY or SELL signal is generated only when the internal requirements for structure, gravity, trend, regime, confidence, and reward-to-risk are satisfied.
WAIT Is an Important Signal
Gravity Magnet intentionally outputs WAIT when market conditions do not meet the required confirmation criteria.
Examples include:
- conflicting liquidity forces
- insufficient Gravity Score
- weak structural liquidity
- unsuitable market regime
- insufficient trend confirmation
- poor projected Reward-to-Risk
- no clear directional advantage
The indicator is designed to filter conditions rather than continuously produce trading signals.
Built-In Reward-to-Risk Filter
Gravity Magnet evaluates a reference trading plan before confirming a directional signal.
The framework considers:
- structural stop location
- ATR-based stop limits
- liquidity target
- fallback target when applicable
- projected Reward-to-Risk
The default minimum planned Reward-to-Risk is:
1.15
If the target is already too close relative to the required stop distance, the signal can be rejected and returned to WAIT.
This helps reduce late entries when price has already moved too close to the magnet.
Closed-Bar Signal Confirmation
Trading signals are designed around closed-bar confirmation.
The dashboard clearly identifies this behavior with:
Closed-bar signal
This helps reduce intrabar signal instability and provides a more disciplined framework for discretionary or automated integration.
Anti-Backpaint Structure
Pivot-derived liquidity levels are available only after the required pivot confirmation has occurred.
The indicator distinguishes between:
- the original structural pivot
- the bar where that structure became confirmed
This prevents historical charts from visually implying that a pivot-derived liquidity level was known before it was actually confirmed.
Multi-Symbol Dashboard
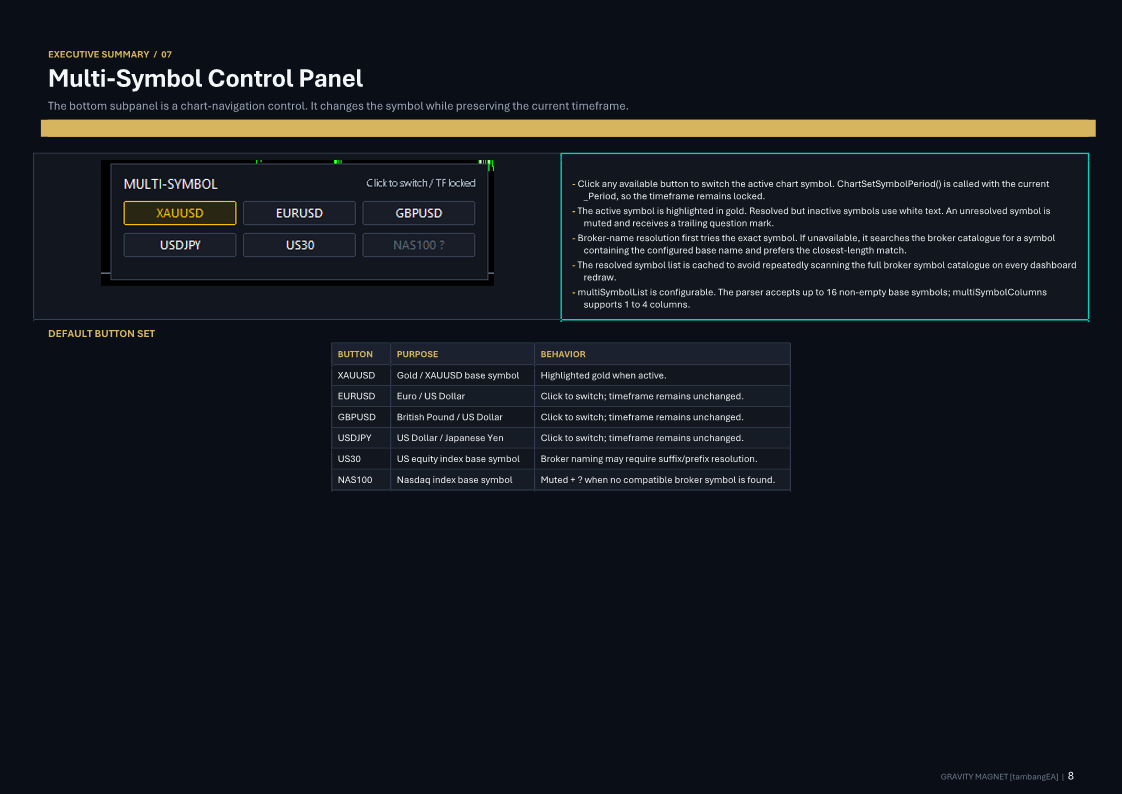
Gravity Magnet includes an interactive Multi-Symbol panel.
Default symbols include:
- XAUUSD
- EURUSD
- GBPUSD
- USDJPY
- US30
- NAS100
Simply click a symbol button to change the current chart symbol.
The current timeframe remains unchanged.
The active symbol is highlighted for quick identification.
The indicator also attempts to resolve broker-specific symbol formats such as:
XAUUSDm
XAUUSD.a
mEURUSD
EURUSD.pro
and similar prefix/suffix variations.
The symbol list can be customized from the indicator inputs.
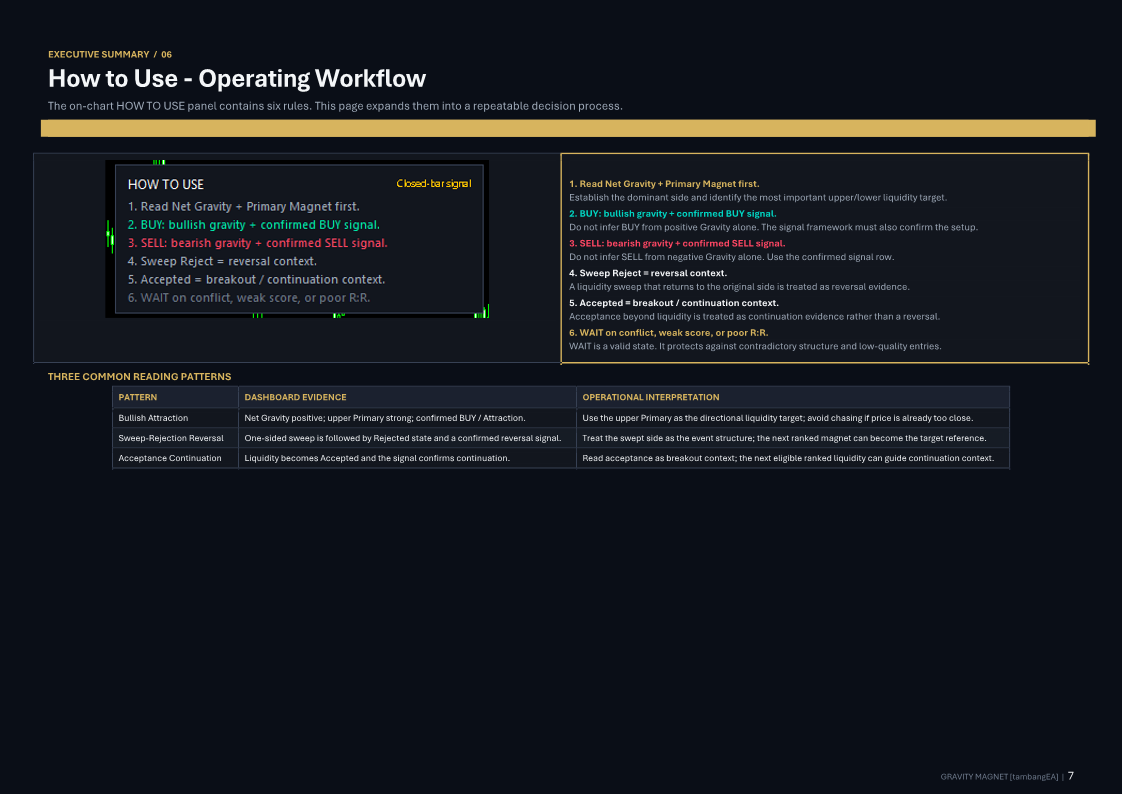
Integrated How-To-Use Panel
The dashboard provides a compact usage guide directly on the chart:
- Read Net Gravity and the Primary Magnet first.
- BUY: bullish gravity + confirmed BUY signal.
- SELL: bearish gravity + confirmed SELL signal.
- Sweep Reject = reversal context.
- Accepted = breakout / continuation context.
- WAIT when conditions conflict, scores are weak, or Reward-to-Risk is poor.
Key Features
- Advanced liquidity-attraction model
- Primary, Secondary and Tertiary liquidity ranking
- Upper and lower liquidity mapping
- Net Gravity calculation
- Bull / Bear Pressure measurement
- Gravity Flow visualization
- Opposing Gravity visualization
- Liquidity lifecycle engine
- Sweep detection
- Sweep rejection detection
- Liquidity acceptance detection
- Trend context using adaptive EMA structure
- ATR-normalized calculations
- ADX / volatility-based market regime
- Closed-bar trading signals
- BUY / SELL / WAIT framework
- Signal confidence scoring
- Reward-to-Risk filtering
- Confirmation-safe pivot processing
- Anti-backpaint visual logic
- Previous Day High / Low analysis
- Previous Week High / Low analysis
- Equal High / Low detection
- Repeated rejection detection
- Major swing analysis
- Dynamic liquidity clustering
- Interactive Multi-Symbol dashboard
- Broker prefix/suffix symbol detection
- Click-to-switch symbols
- Timeframe preserved during symbol switching
- Integrated How-To-Use panel
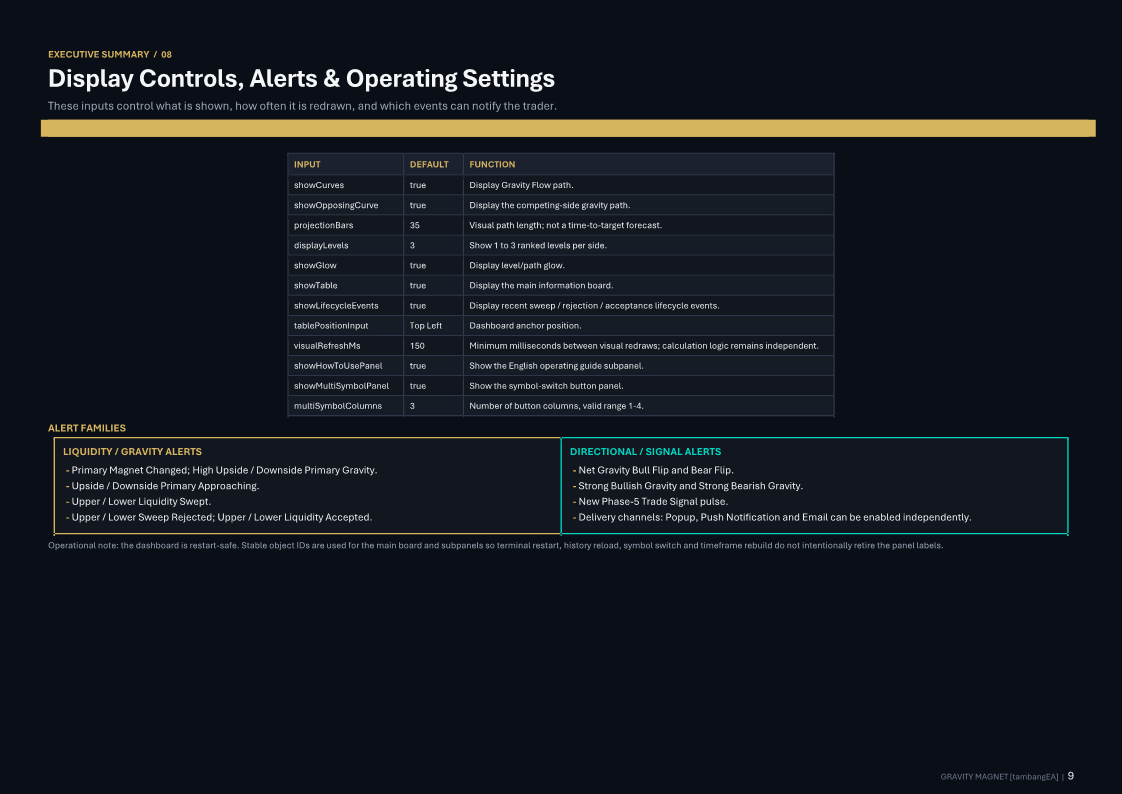
- Popup, Push and Email alert options
- Optimized persistent chart-object rendering
Recommended Workflow
A practical workflow is:
1. Identify the market regime.
Check whether the market is in Range, Compression, Trend, or Trend Expansion.
2. Read Net Gravity.
Determine whether upper or lower liquidity currently has the stronger attraction.
3. Locate the Primary Magnet.
Observe its price, Gravity Score, and lifecycle state.
4. Compare Bull and Bear Pressure.
Avoid interpreting Gravity without considering the competing side.
5. Observe Gravity Flow and Opposing Gravity.
This provides a visual representation of the competing liquidity structure.
6. Wait for the confirmed signal.
Use BUY, SELL, or WAIT as the final framework output.
7. Confirm the setup type.
Understand whether the trade context comes from Attraction, Sweep Rejection, or Acceptance.
Example Interpretation
Suppose the dashboard shows:
Gravity: -25
Pressure: 37 / 63
Signal: SELL
with a strong lower Primary Magnet.
This means bearish liquidity attraction currently dominates the ranking model.
The Primary Magnet can then be used as the principal structural target reference.
However, the trader should still evaluate price action, spread, volatility, execution conditions, and personal risk management before taking a trade.
Designed for Multiple Trading Styles
Gravity Magnet can be used as a market-context tool for:
- Scalping
- Intraday trading
- Swing trading
- Breakout analysis
- Mean-reversion analysis
- Liquidity-sweep trading
- Discretionary trading
- Algorithmic strategy development
Its ATR-normalized architecture allows the same core logic to adapt across different symbols and volatility environments.
Important Notes
Gravity Score is not a probability.
For example, a Gravity Score of 70 does not mean there is a 70% probability that price will reach the liquidity level.
The score represents the relative strength of the liquidity attraction model.
Gravity Flow is not an exact price forecast.
The projected curve visualizes attraction toward the Primary Magnet. It does not predict the exact path, number of candles, or timing required to reach the target.
This indicator does not guarantee profitable trades.
It should be used as an analytical and decision-support tool together with appropriate risk management and trading discipline.



