Practice Simulator MT5 LiveAI

Practice Simulator for MetaTrader 5 combines simulated practice in the Strategy Tester with live trading using the same interface. Practice your strategy with historical market data, then use the same interface for live trading with risk management and trade management tools.

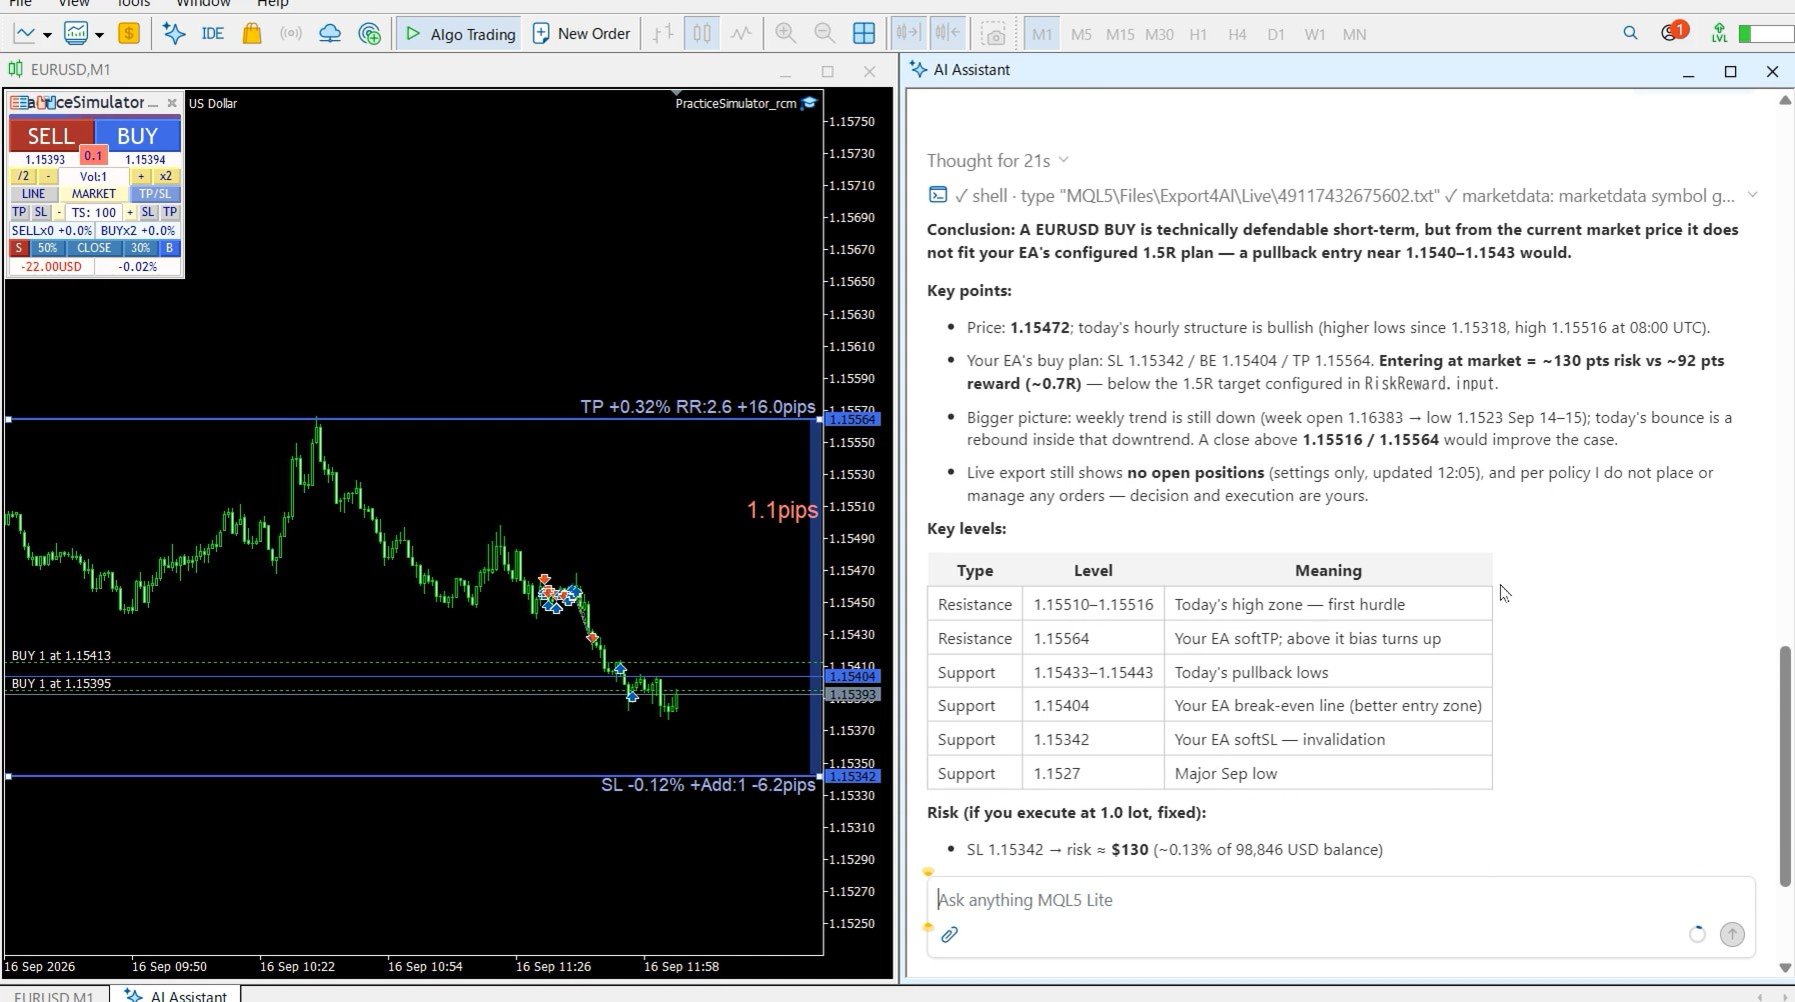
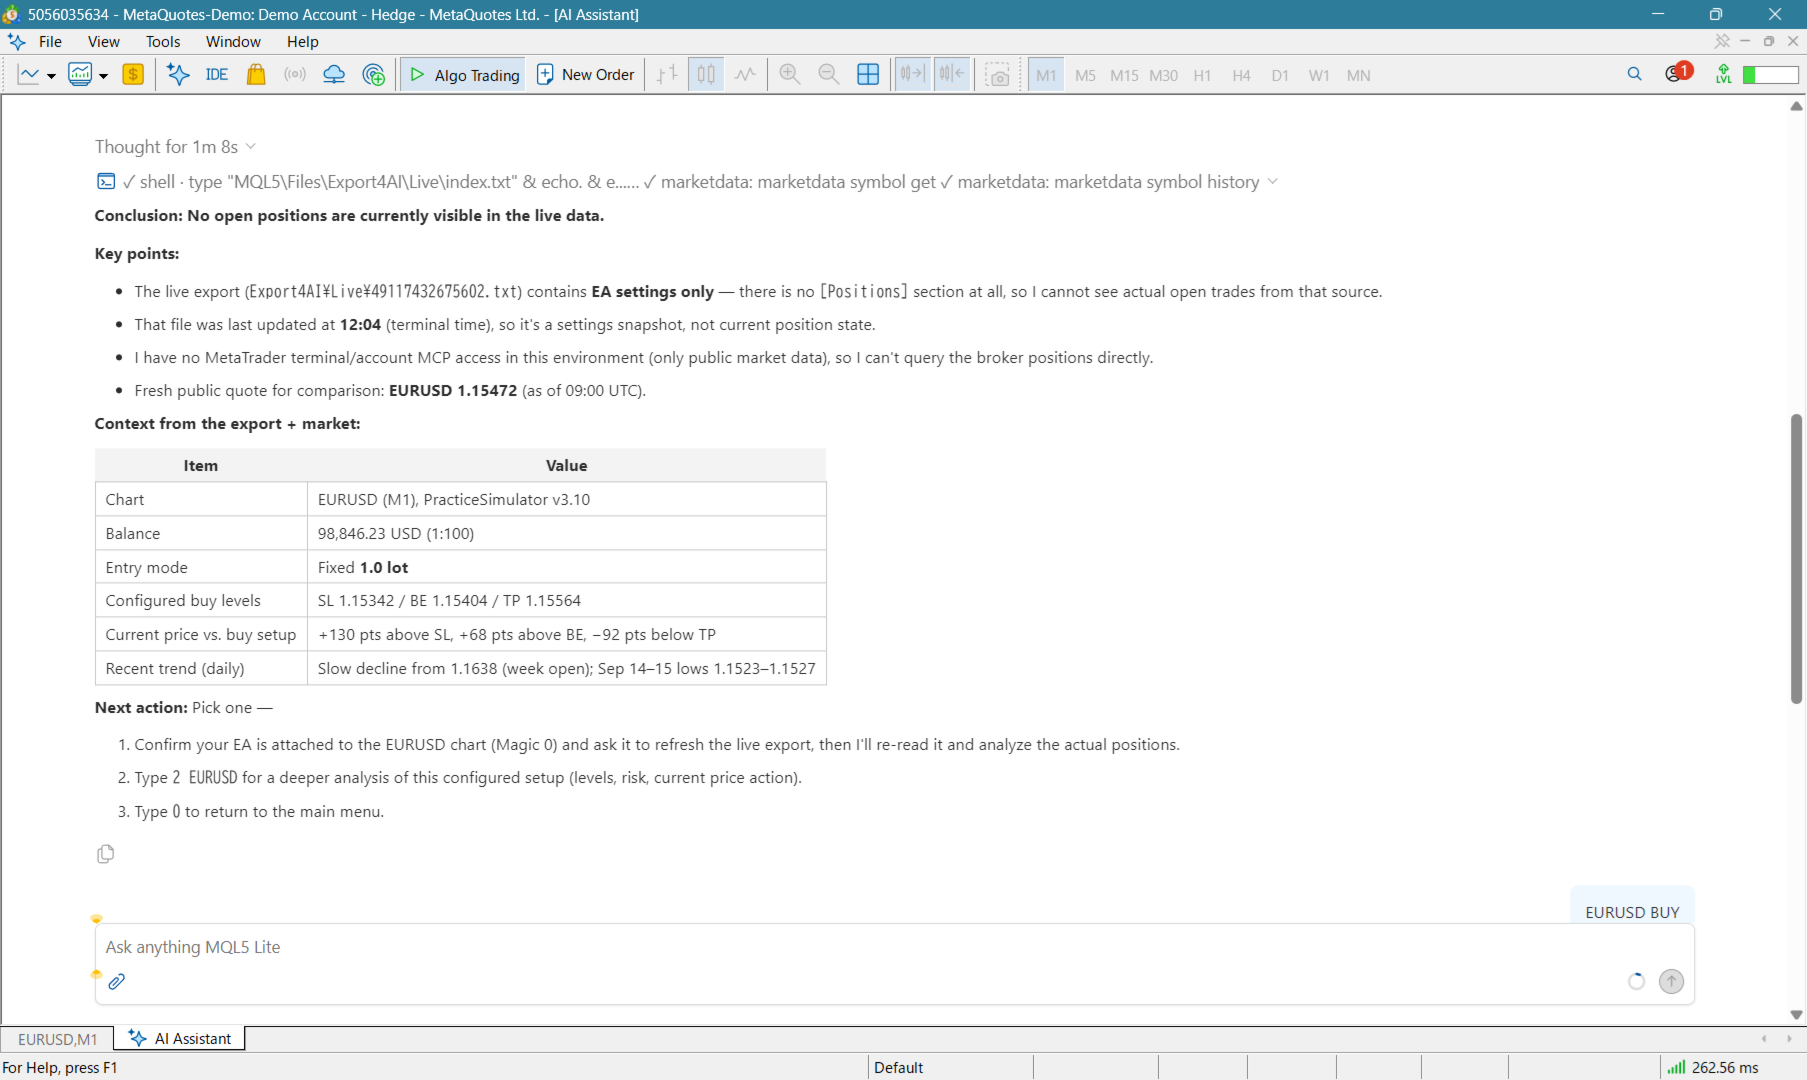
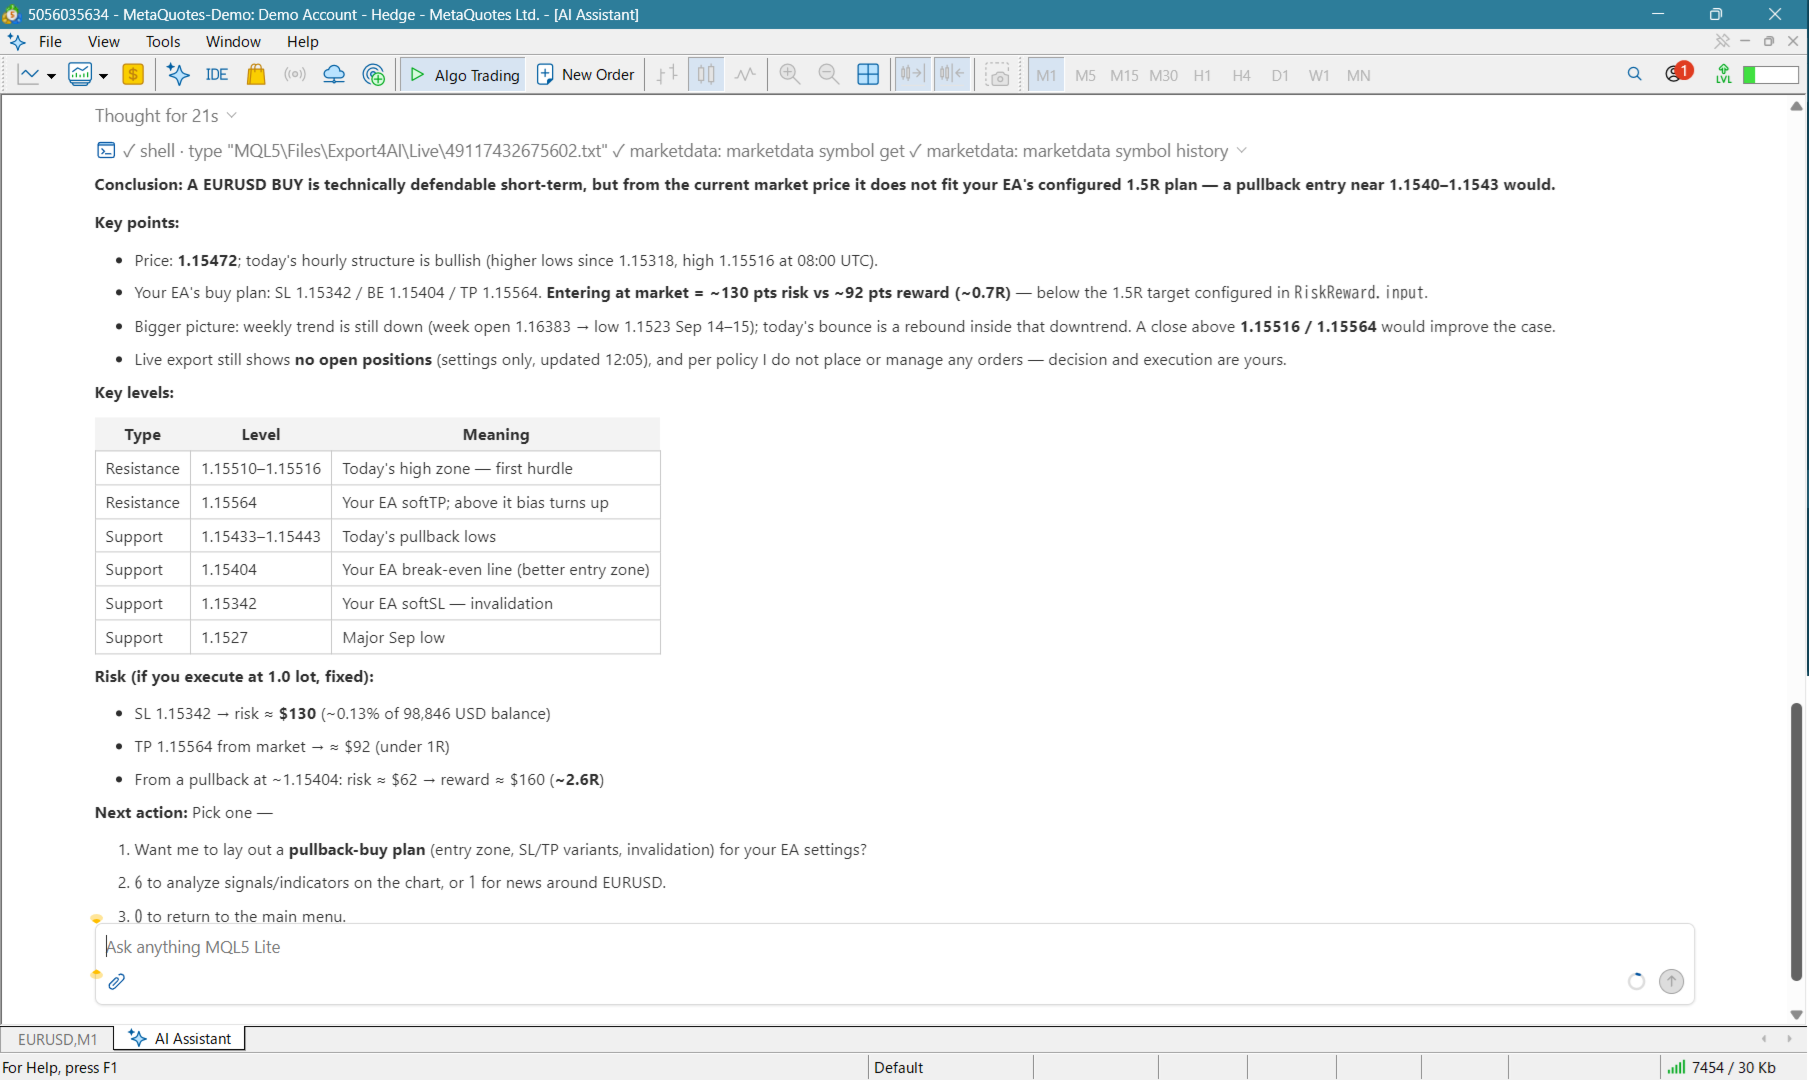
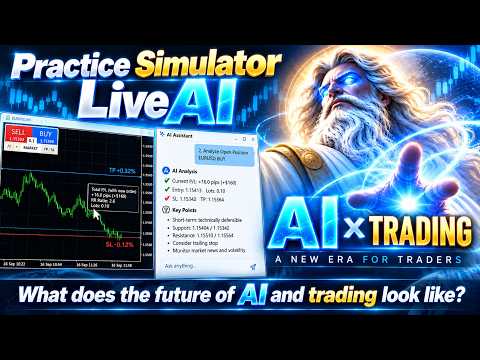
Practice Simulator for MT5 includes LiveAI, an integration with the MT5 AI Assistant. Ask about the market, your open positions, entries, or exits in plain language. The assistant reads the current Chart Information and uses PracticeSimulator information and functions when responding. Trading data can also be exported and analyzed with the MT5 AI Assistant and other generative AI services through AI Judgement.

For detailed information, visit Setup & User Guide.

Key Features

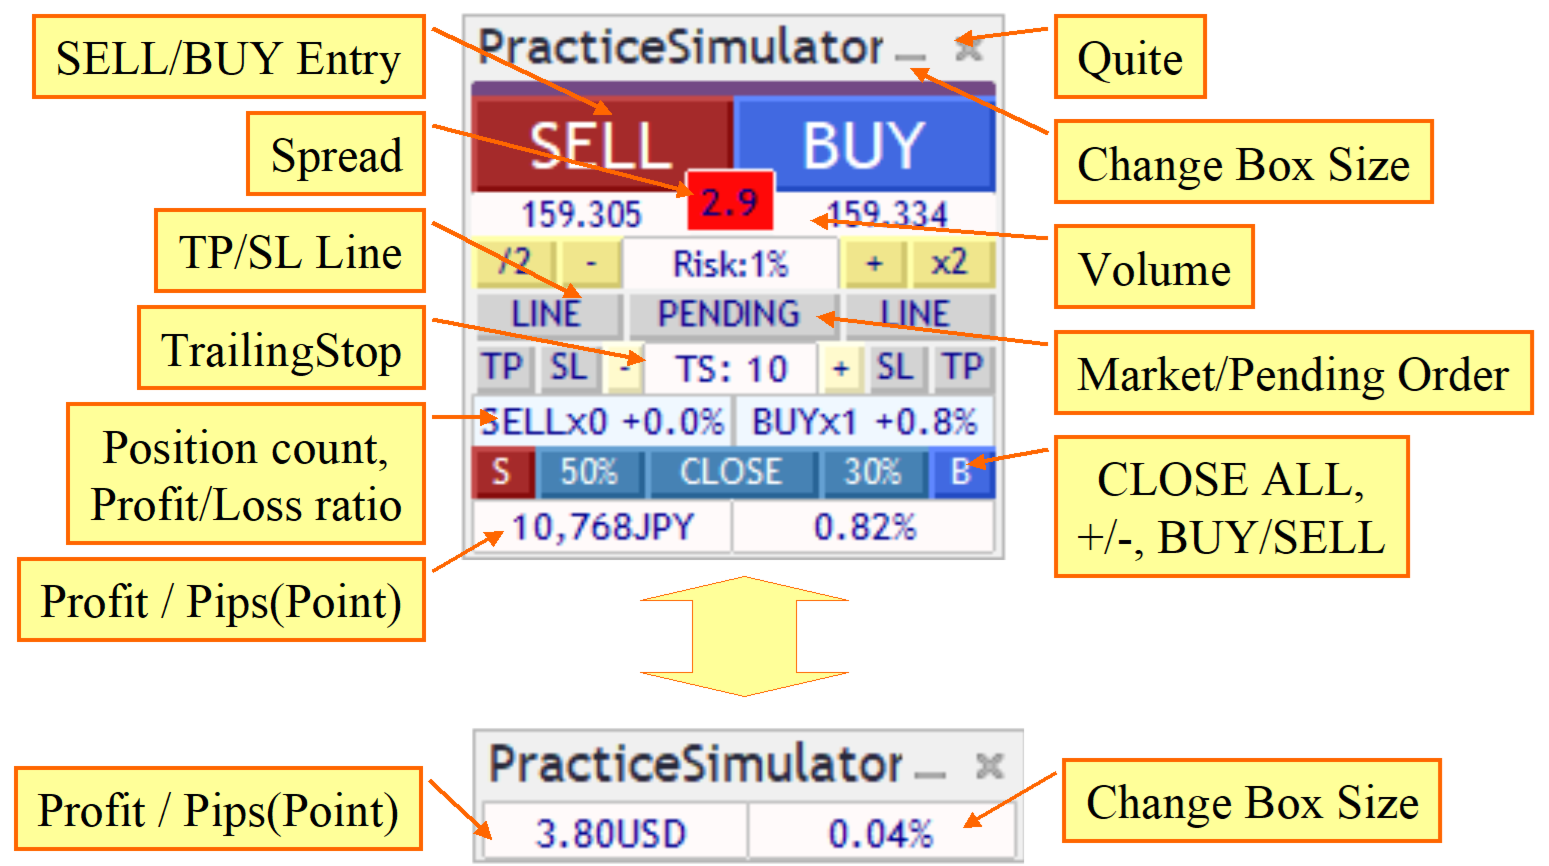
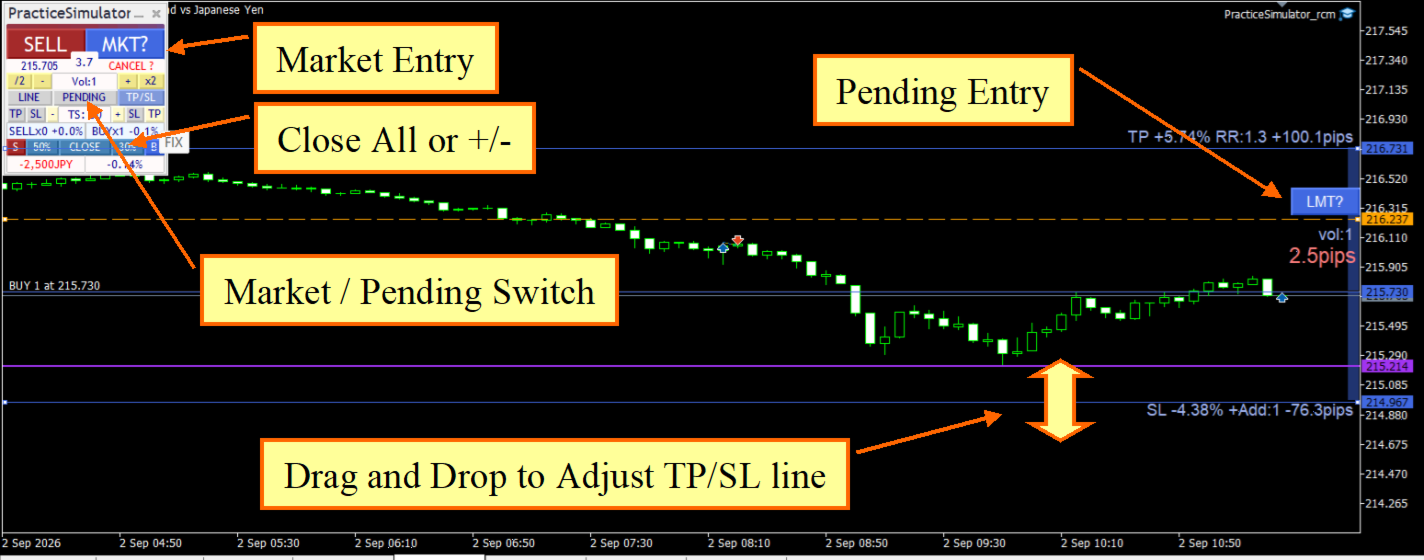
  • Live Trading – Trade live with one-click market orders, limit/stop orders, drag-and-drop TP/SL lines, and bulk closing.
  • LiveAI – Use the MT5 AI Assistant to analyze current Chart Information, open positions, entries, exits, signals, and indicators using PracticeSimulator information and functions.
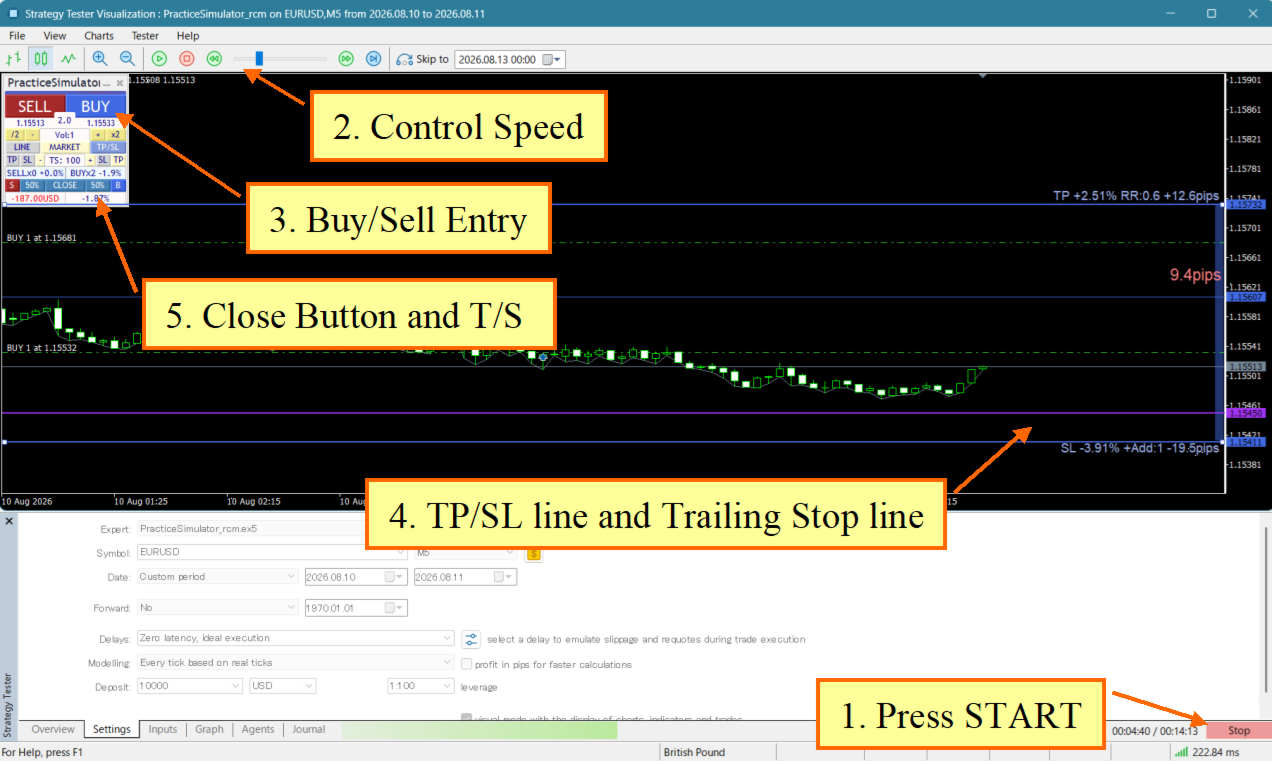
  • Simulated Practice – Practice in the Strategy Tester with Visual Mode using historical market data.
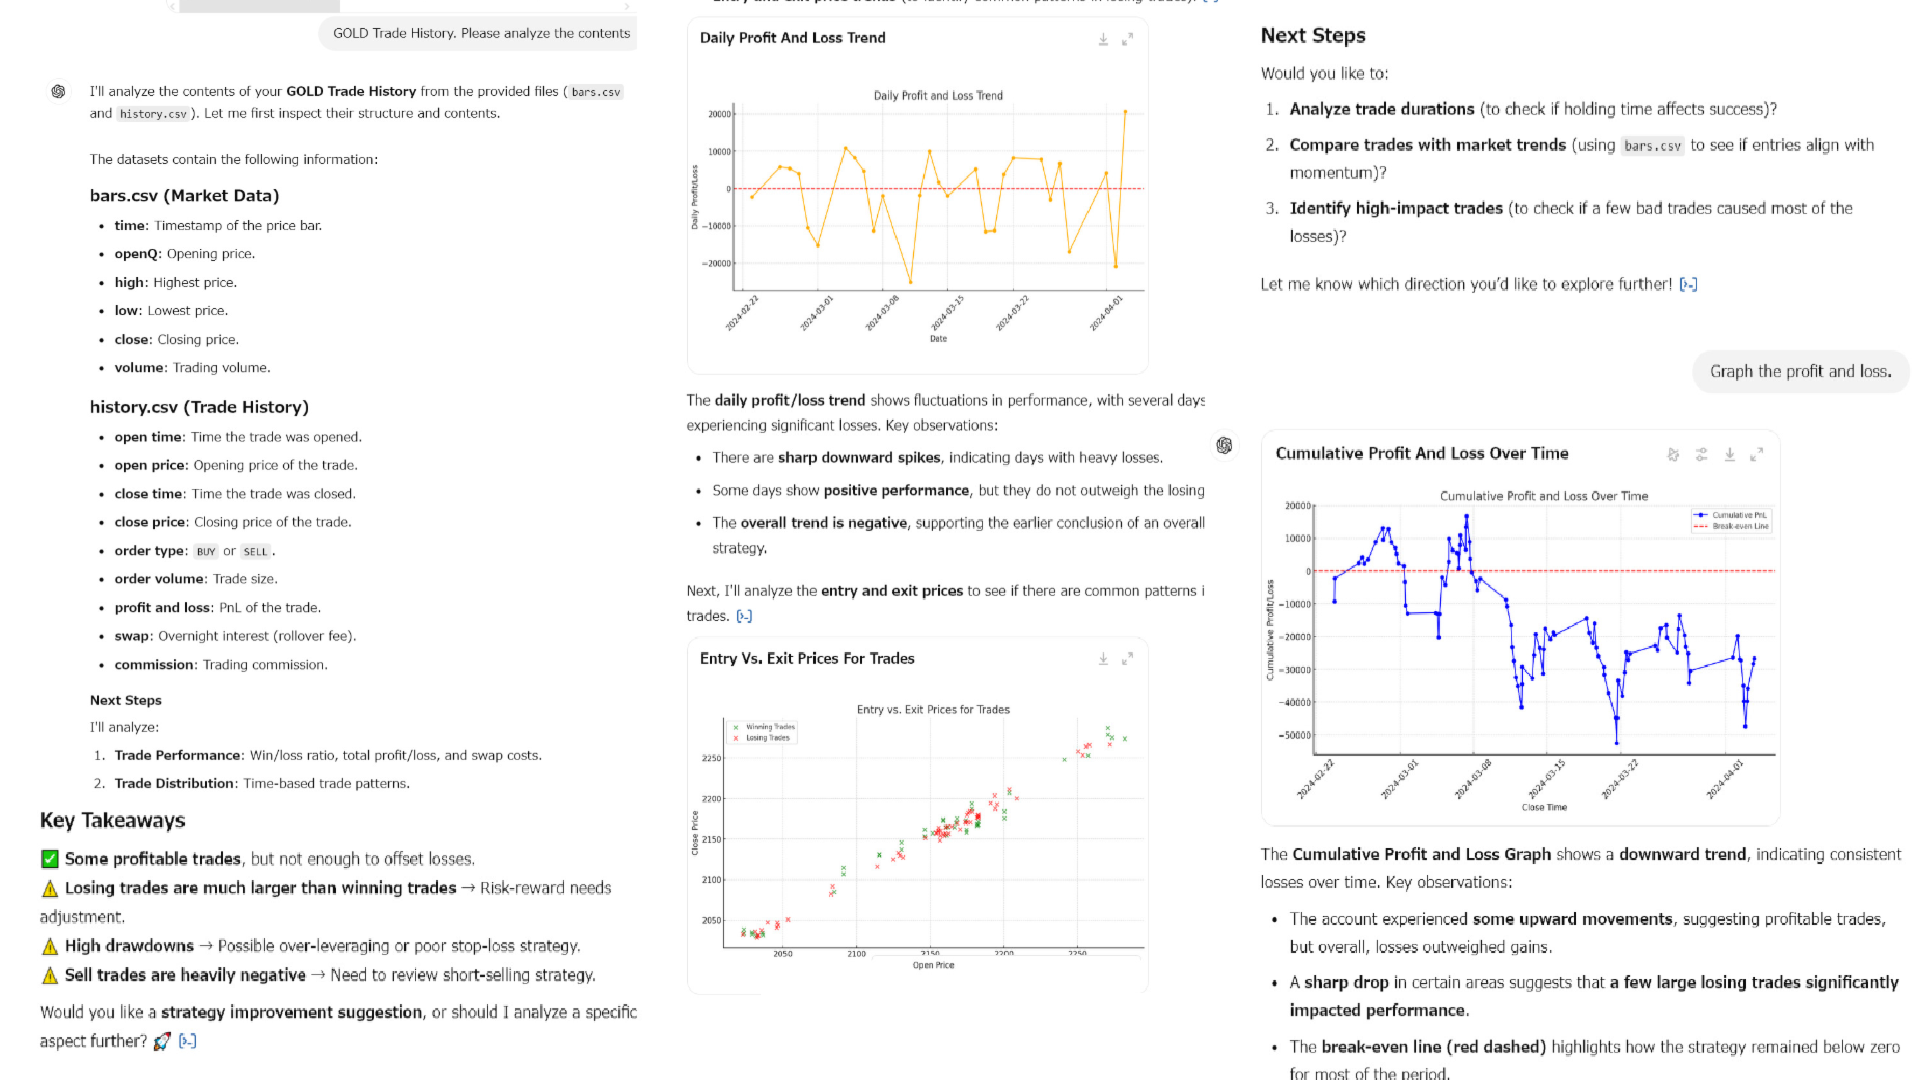
  • AI Judgement – Export your trading data for analysis with the MT5 AI Assistant and other generative AI services.
  • Risk Management – Automatic lot calculation by risk percentage, dynamic TP/SL, and multiple trailing stop methods including Fixed, Shrink, Moving Average, Bollinger Bands, SAR, Chandelier Exit, and Protect Break Even.
  • Strategic Close – Configure full close, partial close, line reset, trailing stop, and additional order actions when TP/SL lines are reached.
  • Entry Assist – Delays the actual order based on short-term ASK/BID/mid-price movement. Four settings are available: OFF, Soft, Medium, and Hard.
  • Smart Tooltips – Hover over order buttons or TP/SL lines to preview order volume, expected profit/loss, risk percentage, RR, and breakeven information before executing.
  • Trading Interface – Color-coded buy/sell controls, spread information, stop-out reference line, and customizable panel.

Strategy Tester and Live Trading

Practice Simulator for MT5 has different capabilities in the Strategy Tester and in live trading.

In the Strategy Tester, the focus is on basic practice with historical market data and market-order execution. Some interactive live-trading functions are not available in the tester, including dragging TP/SL lines and placing pending orders by moving LMT/STP lines.

In live trading, the trade-management interface includes interactive TP/SL lines, pending orders, Smart Tooltips, risk-based position sizing, StrategicClose, flexible trailing stops, and Entry Assist.

LiveAI with MT5 AI Assistant

LiveAI connects PracticeSimulator with the MT5 AI Assistant. The assistant can read current Chart Information from the terminal environment and use PracticeSimulator information when analyzing live trading.

You can select analysis tasks from a menu, ask about open positions, discuss entries or exits, review trading, and analyze signals and indicators. You can also ask ordinary questions, and the assistant re-reads the current chart information when responding.

AI Judgement

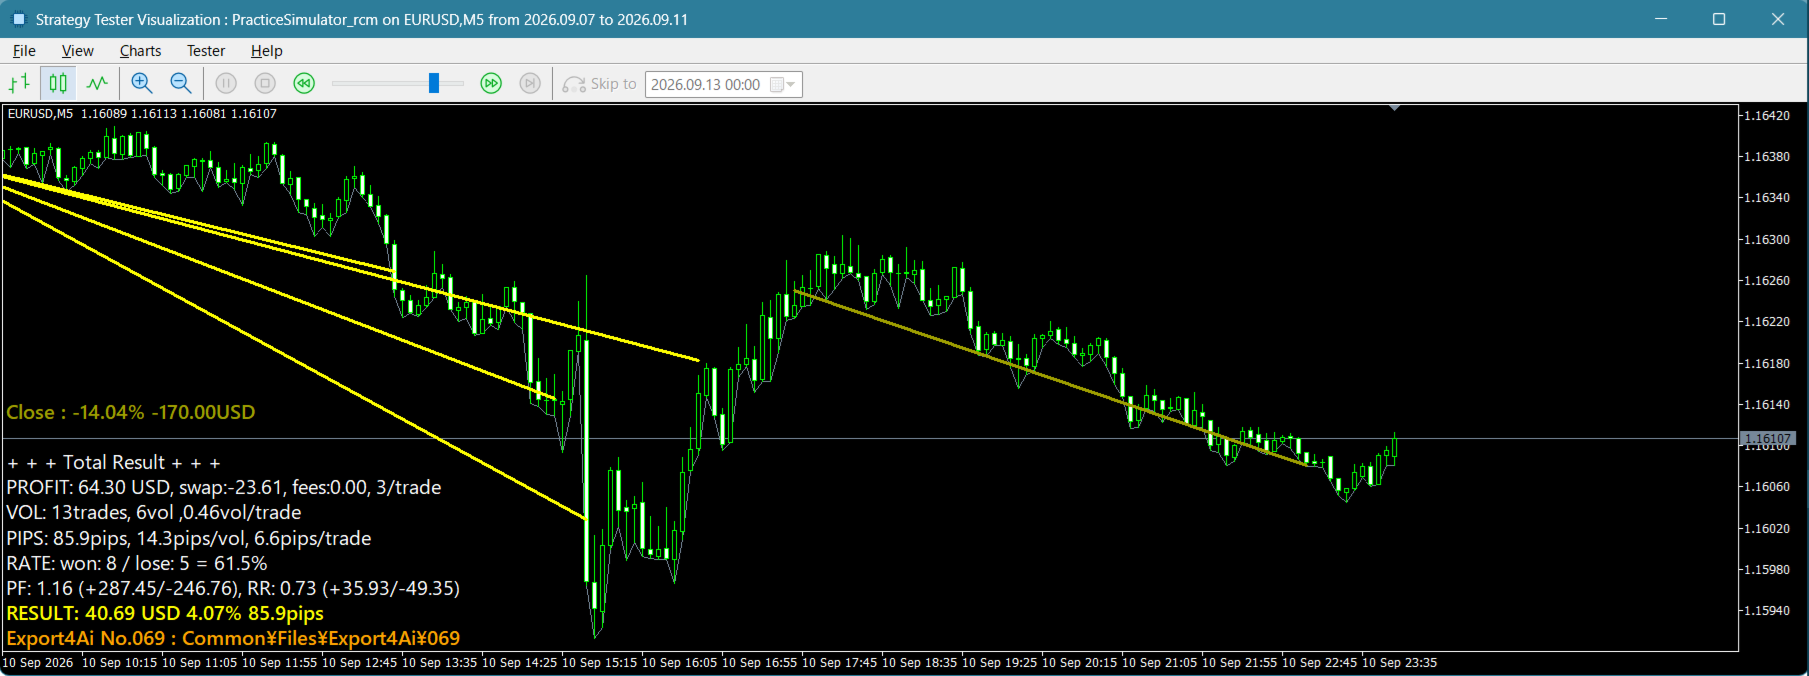
After a practice session, PracticeSimulator exports trading data for AI analysis. In the MT5 Strategy Tester, the trading data is exported automatically when the test finishes.

The exported data can be analyzed with the MT5 AI Assistant or other generative AI services of your choice. Available analyses include AI scoring, trade statistics, improvement suggestions, HTML reports, and free-form questions about the trading data.

Getting Started

Practice Mode:

  1. Launch the Strategy Tester, select "PracticeSimulator", and enable "Visual Mode".
  2. Choose your symbol, period, and spread, then start simulated trading.
  3. When the test finishes, the trading data is exported automatically.
  4. Use AI Judgement with the MT5 AI Assistant or another compatible generative AI service to analyze the exported trading data.

Live Trading Mode:

  1. Attach "PracticeSimulator" to a live chart and start trading with the same interface.
  2. Launch the MT5 AI Assistant and use LiveAI to analyze the current chart and trading situation.
  3. Ask about news, open positions, entries, closing trades, signals, or indicators using ordinary language.

Additional Information

  • Historical data is required for simulated trading.
  • In the Strategy Tester, dragging TP/SL lines and placing limit/stop orders by moving LMT/STP lines are available only in live trading.
  • LiveAI requires the MT5 AI Assistant and a chart running PracticeSimulator.
  • AI Judgement can also be used with other generative AI services by providing the exported trading data.

For setup instructions and detailed usage information, see the Setup & User Guide.

More from author
Trade Simulator MT5
Sajiro Yoshizaki
4.4 (5)
Trade Simulator is not just a trade panel. It allows you to practice realistic trading using historical data, with interactive chart control. You can place trades, adjust stop levels, and monitor results as if trading live. You can also place and manage orders directly in the MT5 Strategy Tester. The same tool and interface can be used directly on live charts for actual trading. For detailed information, visit Setup & User Guide .  Also, take a look at the MT4 version and the  Advanced edition .
FREE
Trade Simulator MT4
Sajiro Yoshizaki
5 (3)
Trade Simulator is not just a trade panel. It allows you to practice realistic trading using historical data, with interactive chart control. You can place trades, adjust stop levels, and monitor results as if trading live. You can also place and manage orders directly in the MT4 Strategy Tester. The same tool and interface can be used directly on live charts for actual trading. For detailed information, visit Setup & User Guide .  Also, take a look at the MT5 version and the  Advanced edition .
FREE
This tool adds an original time scale with a specified or automatically calculated time difference to the bottom of the chart. By using this handy tool, you can improve the readability of the chart and reduce mental stress by displaying it in a time format familiar to you or your country. Even if you don't need to calculate time differences, simply replacing the default time scale with Local_Time can improve the chart's readability. Local_Time supports various time formats such as "DD.MM hh:m
FREE
SyncObjects is a tool that allows you to synchronize objects drawn on multiple charts in real-time within MetaTrader. Objects such as trend lines, horizontal lines, and text labels can be automatically reflected on other charts. It enables seamless analysis across different timeframes and currency pairs, enhancing the efficiency of your trading environment. Additionally, it works well with trade practice and testing tools like PracticeSimulator , allowing you to conduct chart analysis and testin
FREE
ClickDrag draws lines and moves objects on the chart easily. Click and then Drag to start drawing a trend line. Moving the mouse horizontally draws a price line. Moving the mouse vertically draws a date line. Existing lines and objects can be moved by Click&Drag. Displays the price and time difference between the start point to end point. After start Click&Drag, Shake left and right to change the color. Shake up and down to delete. - What is Click & Drag ? 1. press the left mouse button (pre
FREE
This tool offers two major benefits: it enhances the usability of MT5 economic indicators and enables seamless sharing of the data with MT4. For example, it allows you to effectively use economic indicator data from more than 10 years ago for training and backtesting. Additionally, it is compatible with MT4's PracticeSimulator , making it a valuable tool for everything from practicing trades with historical data to live trading on MT4. For seamless sharing of economic indicators with MT4 . >> MT
FREE
TradeSnap
Sajiro Yoshizaki
TradeSnap automatically captures and saves the screen when a BUY/SELL order is executed. Simply set it on the chart and it will be saved automatically without any extra work. Lines, arrows, etc. on the chart are also saved as they are in the image. The image size that can be 10000x10000 pixels, so you can save a horizontal image that shows the price movement history. Press the "s" key to save the current chart. Parameter info --Event Parameter-- Magic number (0=ALL):  Set Mugic Number if y
FREE
Chart Buddy MT5
Sajiro Yoshizaki
Chart Buddy is an entertainment tool designed to add fun to your trading charts. A character moves along the right side of the chart, giving the impression that it's cheering on the price movement, adding a unique and enjoyable touch to your trading experience. While it doesn't affect your trades directly, the animations provide a lighthearted distraction and make it feel like you have a personal supporter. Key Features: Price Movement Supporter : The character moves in response to price directi
FREE
It works fine in the strategy tester. Try it out with the FREE DEMO.(build 1353 ) How to run the FREE DEMO => https://www.mql5.com/en/blogs/post/749299 Msg2Discord posts free text and captures from a text box to Discord. If you write lines, marks or comments on the graph, the image will be sent. A very useful and simple tool. - Sending Free Messages 1. enter free text in the EDIT box. 2. Press the SEND button. - Sending a free message + image capture 1. enter text in the EDIT box. 2. 2. pr
FREE
Msg2Slack is the tool that sends messages from MT4/MT5 text boxes to Slack. With just one click on the button located on the right side of the text box, you can easily send text and chart images to your Slack channel. Even if you draw lines, marks, comments, and more on the chart, the image will be posted. Whether you want to send messages to yourself or a group, this simple yet powerful tool makes it incredibly easy to capture chart images and send messages on the fly. The Msg2Slack tool is d
FREE
Chart Buddy MT4
Sajiro Yoshizaki
Chart Buddy is an entertainment tool designed to add fun to your trading charts. A character moves along the right side of the chart, giving the impression that it's cheering on the price movement, adding a unique and enjoyable touch to your trading experience. While it doesn't affect your trades directly, the animations provide a lighthearted distraction and make it feel like you have a personal supporter. Key Features: Price Movement Supporter : The character moves in response to price directi
FREE
This tool adds an original time scale with a specified or automatically calculated time difference to the bottom of the chart. By using this handy tool, you can improve the readability of the chart and reduce mental stress by displaying it in a time format familiar to you or your country. Even if you don't need to calculate time differences, simply replacing the default time scale with Local_Time can improve the chart's readability. Local_Time supports various time formats such as "DD.MM hh:m
FREE
ArwByIdx MT5
Sajiro Yoshizaki
This product receives information from indicators/signal tools and displays arrows or notifications when specific conditions are met. For example, arrows and notifications are shown when MA25 and MA50 cross, when SAR reverses, when MACD changes its plus/minus, or when the closing price crosses the Bollinger Bands. Please refer to the sample settings image for specific configurations. For detailed manuals and configuration files: https://www.mql5.com/en/blogs/post/755082 A free version is als
FREE
TradeSnap automatically captures and saves the screen when a BUY/SELL order is executed. Simply set it on the chart and it will be saved automatically without any extra work. Lines, arrows, etc. on the chart are also saved as they are in the image. The image size that can be 10000x10000 pixels, so you can save a horizontal image that shows the price movement history. Press the "s" key to save the current chart. Parameter info --Event Parameter-- Magic number (0=ALL):  Set Mugic Number if y
FREE
Practice Simulator Sync
Sajiro Yoshizaki
4.5 (2)
This module synchronizes with the Practice Simulator to display chart time and position information, not only for the same currency pair, but also display synchronized charts for various timeframes and different currency pairs. Note: This module does not work by itself. "Practice Simulator" is required. Practice Simulator https://www.mql5.com/en/market/product/98348 Two synchronisation modes are available. Simple synchronisation mode: You can easily create a synchronised chart by opening t
FREE
This tool offers two major benefits: it enhances the usability of MT5 economic indicators and enables seamless sharing of the data with MT4. For example, it allows you to effectively use economic indicator data from more than 10 years ago for training and backtesting. Additionally, it is compatible with MT4's PracticeSimulator , making it a valuable tool for everything from practicing trades with historical data to live trading on MT4. Important Notice This tool requires economic indicator data
FREE
Msg2Slack is the tool that sends messages from MT4/MT5 text boxes to Slack. With just one click on the button located on the right side of the text box, you can easily send text and chart images to your Slack channel. Even if you draw lines, marks, comments, and more on the chart, the image will be posted. Whether you want to send messages to yourself or a group, this simple yet powerful tool makes it incredibly easy to capture chart images and send messages on the fly. The Msg2Slack tool is d
FREE
ClickDrag draws lines and moves objects on the chart easily. Click and then Drag to start drawing a trend line. Moving the mouse horizontally draws a price line. Moving the mouse vertically draws a date line. Existing lines and objects can be moved by Click&Drag. Displays the price and time difference between the start point to end point. After start Click&Drag, Shake left and right to change the color. Shake up and down to delete. - What is Click & Drag ? 1. press the left mouse button (pre
FREE
ArwByIdx MT4
Sajiro Yoshizaki
This product receives information from indicators/signal tools and displays arrows or notifications when specific conditions are met. For example, arrows and notifications are shown when MA25 and MA50 cross, when SAR reverses, when MACD changes its plus/minus, or when the closing price crosses the Bollinger Bands. Please refer to the sample settings image for specific configurations. For detailed manuals and configuration files: https://www.mql5.com/en/blogs/post/755082 A free version is als
FREE
SpeedManager
Sajiro Yoshizaki
This is a playback speed management tool that enables efficient testing and analysis in the Strategy Tester. It enhances the usability of the Strategy Tester and can be used as a means to streamline the development and evaluation of trading strategies. Features of the tool: Playback speed control: Users can freely change the playback speed in the Strategy Tester, allowing them to fast forward, speed up and pause at any point. One bar, one tick forward: The 'Next Bar' button allows users to adva
FREE
Msg2Line sends free text and captures from a text box to "LINE Messenger". If you write lines, marks or comments on the graph, the image will be sent. You can address it to yourself or to a group. A very useful and simple tool. - Sending Free Messages 1. enter free text in the EDIT box. 2. Press the SEND button. - Sending a free message + image capture 1. enter text in the EDIT box. 2. 2. press the w/img button. - Sending a Captured Image 1. simply press the w/IMG button. *Requires LINE
FREE
Practice Simulator is an all-in-one trade simulator for backtesting, trading practice, and live trading. Whether you are a beginner needing practice or an experienced trader analyzing data, this tool supports all levels. Focus on Forex Trading, Market Analysis, or Strategy Optimization. Practice Simulator offers simulated trading anytime, even on market holidays, with a simple yet feature-rich interface for risk management and trade assistance. For detailed information, visit Setup & User Guide.

This tool does not work with the Strategy Tester. Test version: https://www.mql5.com/en/blogs/post/753244 This tool allows you to visualize account performance by showing key metrics based on your account balance. You can select the lines, drag and drop them to instantly see key metrics at different price points. If you ever want to return to the original position after moving the lines, simply double-click, and they will snap back to their original parameters. This tool can notify you when t
The "Binary Lab Simulator" is a tool designed for practicing and verifying trading strategies. This tool operates 24/7, including weekends and non-trading hours, and supports various expiration periods such as 30 seconds, 1 minute, and 3 minutes, creating an environment similar to real trading. It is compatible with external tools for analyzing entry results. Multiple templates can be saved easily, allowing for seamless testing from the online environment to the simulator. "Binary Lab Simulator"
PL Graph Visualizer is a utility that displays real-time graphs of your account's profit and loss. The graph can be viewed separately by currency pair or by magic number, allowing you to see the changes in profit and loss of each position at a glance. This tool can be used in conjunction with the integrated close tool, which can be found here, to further enhance its functionality. https://www.mql5.com/en/market/product/116884 The real-time graphs show not only the total profit and loss of the
FREE
This tool does not work with the Strategy Tester. Test version: https://www.mql5.com/en/blogs/post/753244 This tool allows you to visualize account performance by showing key metrics based on your account balance. You can select the lines, drag and drop them to instantly see key metrics at different price points. If you ever want to return to the original position after moving the lines, simply double-click, and they will snap back to their original parameters. This tool can notify you when t
Filter:
No reviews
Reply to review