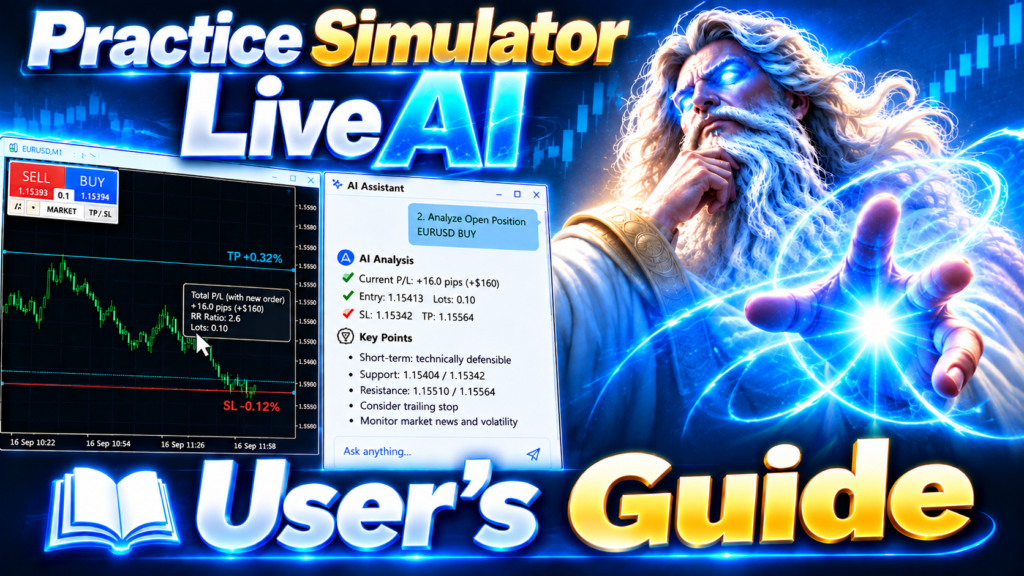
"PracticeSimulator" is a powerful trade simulator designed for beginners starting today to advanced traders.
Practice trading 24/7, even on holidays! With simple-click entry, bulk closing, and drag-and-drop TP/SL, execution is seamless. This all-in-one solution allows strategy refinement with real-market conditions.
The AI judgment system enhances performance analysis and decision-making. Live trading is available for same operations after purchase.
Maximize your potential with "PracticeSimulator"!
Product Links
Practice Simulator MT5 LiveAI 🤖
Enhanced live trading with AI Assistant for MetaTrader 5.
English | Русский | 中文 | Español | Português | 日本語 | Deutsch | 한국어 | Français | Italiano | TürkçePractice Simulator MT4 VirtualRepetitiveTraining 💪
Enhanced practice and simulation for MetaTrader 4.
English | Русский | 中文 | Español | Português | 日本語 | Deutsch | 한국어 | Français | Italiano | TürkçeInitial Setup After Download
This guide is for the MT5 version.
Startup Procedure:
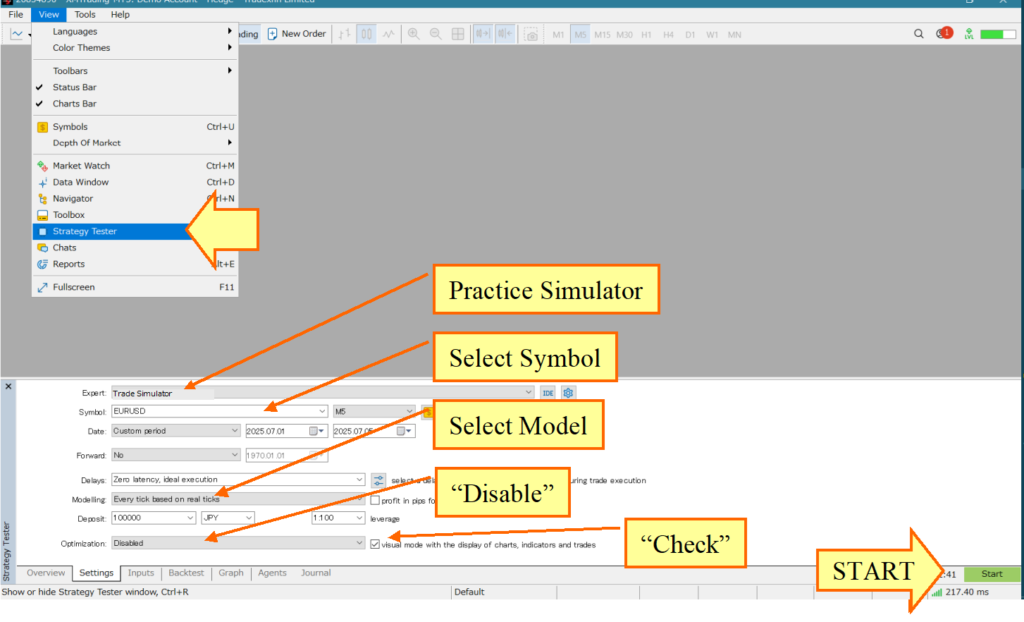
- Launch Strategy Tester: Open the Strategy Tester and select "PracticeSimulator" from the Experts tab.
- Set Parameters: Choose your symbol, period, and spread.
- Model Selection: For scalping, select "Every tick"; otherwise, choose "Control points." (Note: "Every tick" provides the most accurate data but increases the load.)
- Visual Mode: Check the "Visual mode" box and set the slider to the far right at 32.
- Optimization: Ensure the "Optimization" box is unchecked.
- Historical Data: You can specify the testing period, but ensure you have the necessary historical data.
Note for the Strategy Tester: In the Strategy Tester, adjusting the TP/SL lines by dragging and placing limit/stop orders (moving the LMT/STP lines) are not available. These operations are available only in live trading.
Once the chart starts moving, it will operate as shown in the following image.
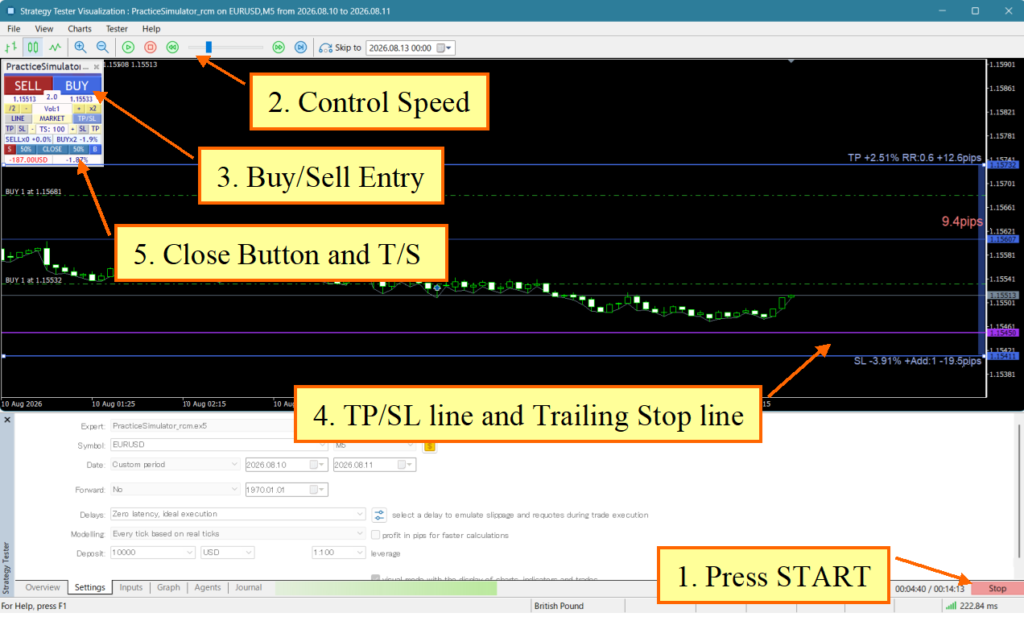
how to operate
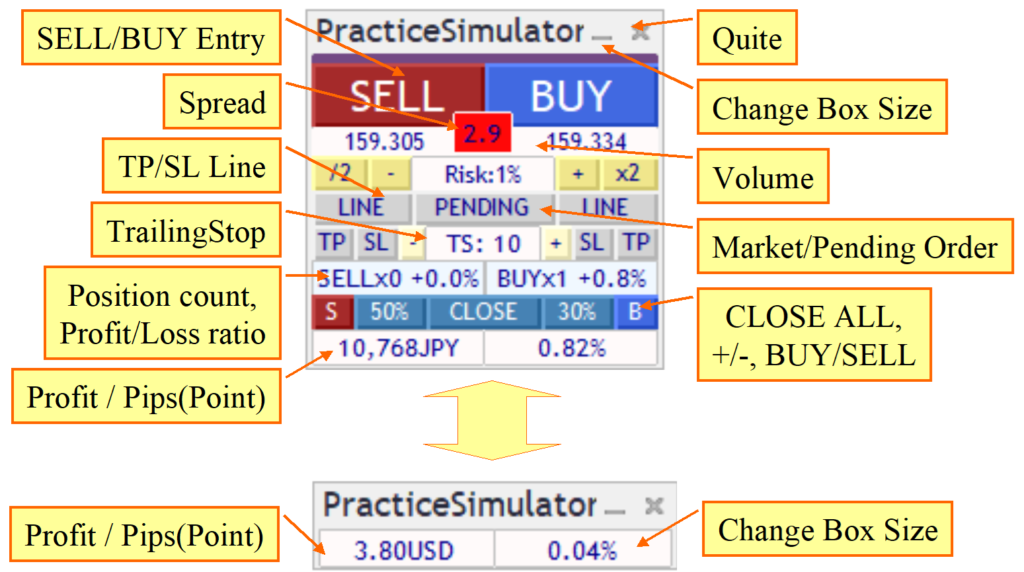
Parameters
- MagicNumber: using for online trade, 0:all MagicNumer
- Initial lot size and increment: lot size
- Point scaling factor(0:auto): The meaning of "auto" is governed by pips.
- TakeProfit w/Scaling: TP (include Point scaling factor)
- StopLoss w/Scaling: SL (include Point scaling factor)
- TrailingStop w/Scaling: SL (include Point scaling factor)
----
- SL Strategy: Please specify the action for the SL line. For details, refer to Strategic Close.
- SL Partial Close Rate: Close rate (Held Lot %)
- SL Type of TrailingStops: Please select the type of trailing stop. For details, refer to Trailing Stop.
----
- TP Strategy: Please specify the action for the TP line. For details, refer to Strategic Close.
- TP Partial Close Rate: TP Close rate (Held Lot %)
- TP Type of TrailingStops: Please select the type of trailing stop. For details, refer to Trailing Stop.
----
- OneClick Entry: true: market order with one click, false: limit or market order selectio.
- Entry Assist: Specify the strength of the automatic assist at entry.
- Use ASK line: If true, use the ASK line as usual; if false, simulate the ASK line to the BID line.
- Show Trade history: Display past trade history on the chart.
----
- BUY/SELL color: Color for Button, Line and Rect.
- Line width: Width for TP/SL Line.
- Box pos, size: Position and size of the control box
- Box font scaling: If the text is too small or too large, adjust the size.
- Font size/Seconds to display: for Message.
- Smooth rendering (false if heavy): Display when moving TP/SL etc. Set to false if the movement is heavy.
- Caution message displayed at startup: Displays a reminder message when trading online. If you do not need it, please set it to false.
How to Enter a Trade
Learn how to enter a trade efficiently with the integrated TP/SL line display and order execution process.
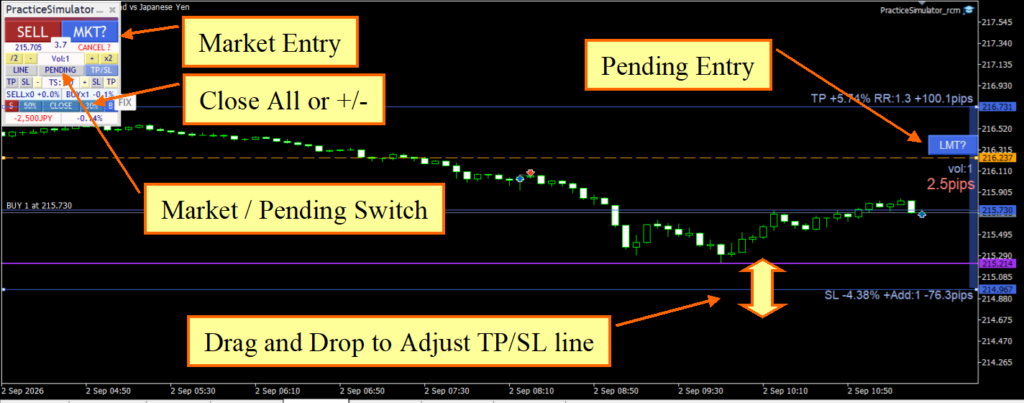
- Entry Start: Press the order button to display the TP (Take Profit) and SL (Stop Loss) lines.
- Display Market/Limit/Stop Order Buttons: The order button will switch to a market order button (MKT button). Simultaneously, the chart will display limit (LMT)/stop (STP) order buttons for placing pending orders.
- Adjust TP/SL Lines: Move the TP/SL lines to your desired positions using the mouse. These lines are fully interactive and can be freely repositioned. (Available only in live trading.)
- Market Order: Press the market order button (MKT button) to place the order.
- Limit/Stop Order: Move the LMT/STP Line and Press the limit order button (LMT button) or the stop order button (STP button) to place the pending order. (Available only in live trading.)
Smart Tooltips
Hovering the mouse over an order button (BUY / SELL / LMT / STP) or a TP/SL line displays a Smart Tooltip with detailed order information. The contents are updated in real time as you adjust the TP/SL lines. It's only live chart.
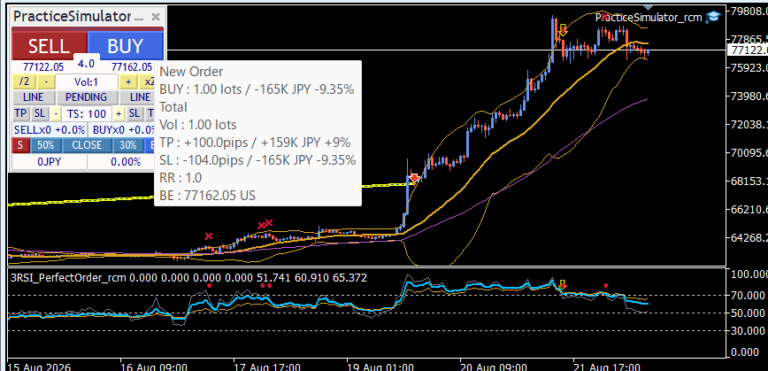
Order Button Tooltips (BUY / SELL / LMT / STP):
The tooltip of a market order button (MKT) or a pending order button (LMT/STP) shows the following:
- Header: "New Order" for market orders, "New Pending Order" for limit/stop orders.
- Order line: e.g. "BUY : 0.50 lots / +1.23M USD +1%" — direction, order volume, expected profit/loss amount with a +/- sign, and risk percentage. Large amounts are abbreviated (K / M / B), and percentages use 3 significant digits (1.23% / 12.3% / 123%).
- Total: Summary of the position after the additional order.
- Vol: Total volume including the additional order.
- TP / SL: Distance in pips from the entry price, expected profit/loss amount with +/- sign, and percentage of the account balance.
- RR: Risk-reward ratio.
- BE: Breakeven price (placed at the end of the tooltip).
TP/SL Line Tooltips:
Hovering over a TP line or SL line shows:
- Price: The line price and its currency.
- Distance: The distance in pips from the current price.
- Amount: The expected profit/loss amount in the account currency.
- Percentage: The percentage of the account balance.
Note: MT5 tooltips are limited to approximately 160 characters, so a compact notation is used — K/M/B abbreviations for large amounts, 3-digit percentages, and a "+" sign for positive values. Lines that may be cut off are placed at the end of the tooltip.
TP/SL Line Control
Manage your trades effectively with the dynamic control of TP (Take Profit) and SL (Stop Loss) lines.
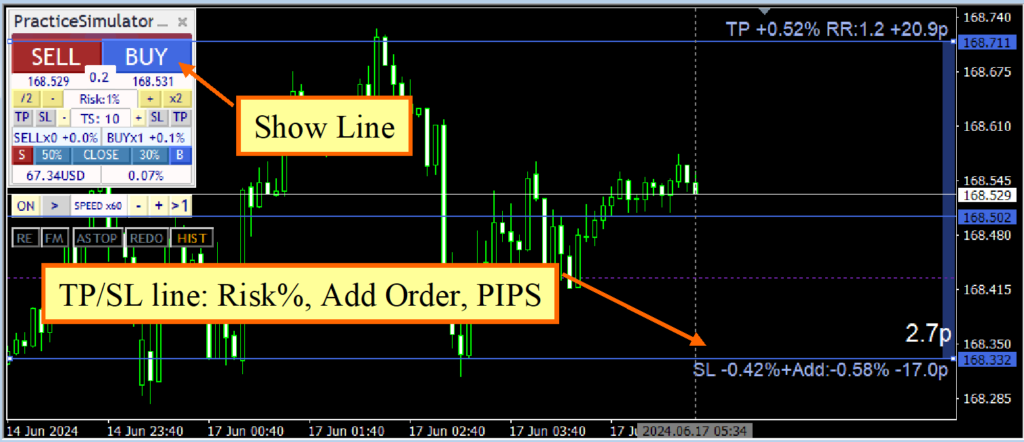
- Position Holding: When holding a position, the TP/SL lines display:
- Profit/Loss Percentage: The expected profit or loss at the time of closing the position.
- Orderable Percentage: Based on the order quantity or risk percentage.
- PIPS from Breakeven Line: Distance in PIPS from the breakeven point.
- No Position: If no position is held, the lines display:
- Orderable Percentage: From the current price.
- PIPS from Current Price: Distance in PIPS from the current market price.
- Interactive Adjustment: Move the TP/SL lines with the mouse to your desired positions. Risk percentage, PIPS, and the number of additional orders that can be placed based on the adjusted risk percentage are automatically recalculated. (Available only in live trading.)
- Removing TP/SL Lines: If no position is held, pressing the cancel button will remove the TP/SL lines. Pressing the order button again will display the TP/SL lines with initial values.
- Restart Behavior: TP/SL lines will not be displayed upon restart if a position is held. Ensure the lines are visible for settlements to occur.
Important Notes:
- Visibility: Ensure TP/SL lines are displayed for accurate trade management and settlement.
- Restart Impact: Remember that lines will need to be re-enabled after a platform restart to ensure proper functioning.
Stop Out Line (Reference Only): The stop-out line displayed on the chart is an approximate estimate of the price level where the account equity would reach the broker's stop-out level, calculated from the current balance, margin, and the account's stop-out percentage. It is updated tick by tick, but it is provided for reference only and may differ from the actual stop-out price executed by the broker, especially when dynamic leverage (per-symbol or equity-based), multiple open positions, or server-side margin calculations are involved. Always manage your positions with sufficient margin and do not rely on this line as an exact stop-out guarantee.
Using Automatic Quantity Calculation by Risk Percentage
This feature allows traders to switch the entry volume calculation from a fixed quantity to a risk percentage based on their account balance. By using this tool, traders can manage their risk more effectively and maintain consistent risk levels across different trades.
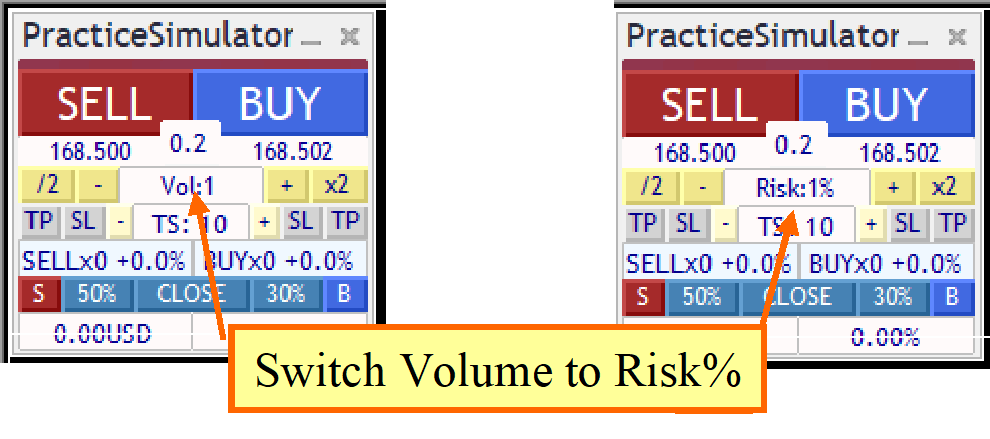
- Set Risk Percentage: Define the percentage of your account balance you are willing to risk on each trade.
- Automatic Calculation: The tool automatically calculates the appropriate entry volume based on the current account balance and the specified risk percentage.
- Apply to Trades: Use the calculated entry volume for your trades to ensure consistent risk management.
Important Note: While this tool can help in managing risk, it does not guarantee profits or prevent losses. Always use it in conjunction with a well-thought-out trading strategy.
StrategicClose
When the TP/SL lines are touched, the strategic close can trigger one or more actions.
- CLOSE ALL: Close all positions.
- CLOSE specified %: Partially close the position by the specified percentage.
- TrailingStop: Enable the trailing stop.
- LineReset: Reset the TP/SL lines.
- Additional Order: Place an additional order with the current parameters.
These actions can be combined. The available combinations can be selected from the dropdown menu in the control panel.
Examples:
- CLOSE specified % + LineReset: Partially closes at the specified percentage, then resets the TP/SL lines.
- CLOSE specified % + TrailingStop: Partially closes at the specified percentage, then enables the trailing stop.
- Additional Order + LineReset: Resets the TP/SL lines and places an additional order with the current parameters. When ordering by risk percentage, additional orders are often not placed. As this method averages down, it may result in infinite orders; please specify the maximum number of positions.
When the TP/SL lines are reset, they are reconfigured based on the parameters set relative to the current price.
For example, if the SL line's parameter value is 10 pips and the strategic close is triggered at the SL line, the SL line will move 10 pips from the current price.
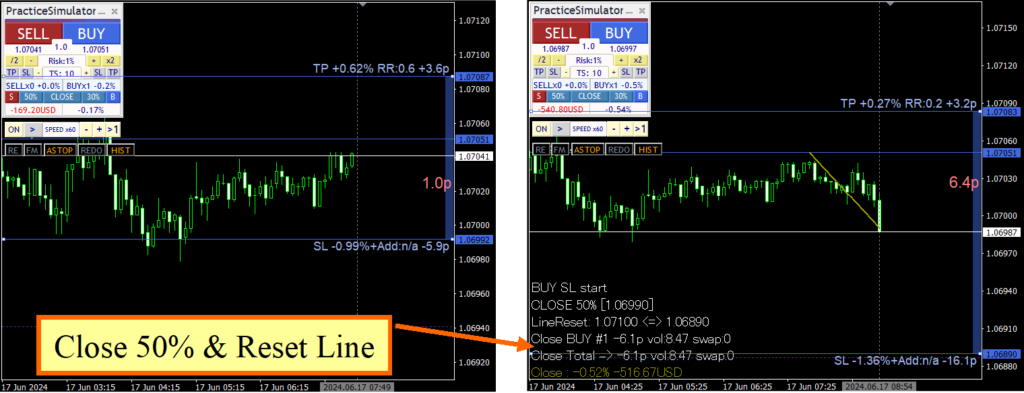
Similarly, the TP line is reset based on the SL line's risk-reward ratio, but when the reset is triggered by the SL line, it moves only to the breakeven line.
Note: If only the line reset is selected without partial close, the SL line will continue to move down, so please be cautious.
Flexible Trailing Stop
The TS block on the control panel allows you to toggle each trailing stop on or off. From left to right, there are settings for SELL TP, SELL SL, TS value, followed by BUY SL and BUY TP, enabling you to control four trailing stops separately. The trailing stop lines are displayed in purple when a position is held. They appear as dashed lines when off and solid lines when on. The detection of maximum values now occurs from the moment they are turned on. Turning them on or off recalculates the maximum value from the current point.
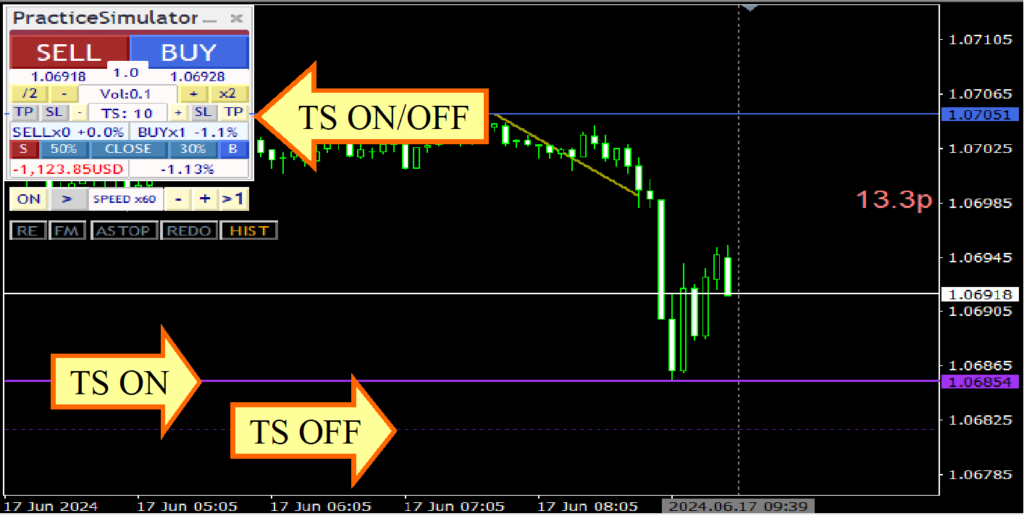
You can choose from the following trailing stops:
- None(NONE): No trailing stop is used.
- Fixed(FIX): Based on the highest price since the trailing stop was turned on, the position is closed when the price falls to or below the specified value. This is the same as a general trailing stop.
- Shrink(SHRINK): The basic operation is the same as FIX, but the high price is compared at each price update or tick. If the high price is not updated, the trailing stop distance is narrowed based on the number of times. If the high price is updated, the value returns to the TP or SL value. If the price drops sharply after reaching a high, the follow-up is delayed, but there is a grace period before settlement, so you can also expect the price to rise again.
- Average(AVG): Based on the value at the time it is turned on and the TP or SL value, the current value is added at each price update or tick, and the average is calculated over the number of TS values. The smaller the TS value, the more closely it follows changes in the current price; the larger it is, the more slowly it follows. AVG has no reset, and compared to FIX and SHRINK, it always follows price movements, so unless the high price continues to be updated, settlement tends to occur earlier. Even during large price movements, it follows quickly and settles reliably.
- Moving Average (MA): Closes the position when the price touches the moving average line for the specified period. This occurs at trend reversals. The TS value represents the moving average period, such as MA20.
- Bollinger Bands (BB): Closes the position when the price touches the upper or lower Bollinger Band for the specified period. For buys, it closes at the lower band; for sells, it closes at the upper band. The TS value represents the period, such as MA20. The deviation is fixed at 2 and cannot be changed.
- Stop & Reverse Points (SAR): Closes the position when the price touches the Parabolic SAR for the specified step. Developed by J.W. Wilder, SAR indicates trend reversals. The TS value is 1/1000 of the specified step. For example, a default value of 10 corresponds to 0.01, while 1 corresponds to 0.001. Use the standard Parabolic SAR indicator to verify the values.
- Chandelier Exit : Chandelier Exit uses the ATR (Average True Range) to widen the stop width in strongly moving markets and keep the stop tight in quiet markets, allowing it to follow the trend reliably while avoiding excessive profit-taking and stop-losses. The TS value represents a multiplier of 1/10, and the ATR period is fixed at 14.
- Protect Break Even (ProtectBE): When the price exceeds the breakeven line and reaches the TS + ATR value, the settlement line is pushed further into profit beyond the breakeven line. Even if the breakeven line moves due to additional orders, it follows and keeps the settlement line in sync. This is mainly intended for pushing up the SL line to eliminate losses once profit is confirmed.
Entry Assist
The Entry Assist feature detects fluctuations based on ASK, BID, and mid-price to predict price movements a few seconds into the future. This allows it to automatically delay actual orders until the optimal timing after the entry button is pressed.
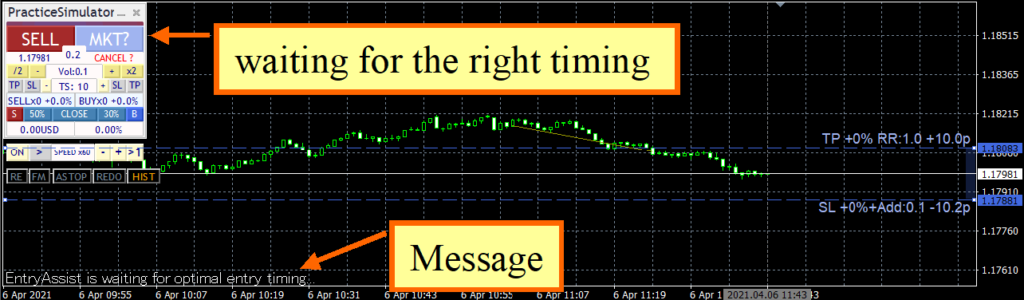
The parameters include four strength levels: OFF, Soft, Medium, and Hard.
Entry Timing Illustration for Buy Orders:
- Soft: Entry when price movement stops (price has bottomed out)
- Medium: Entry when price reversal occurs and an uptrend begins
- Hard: Entry when the price is clearly rising
Judgment Display
The status of the Entry Assist can be viewed on the color bar at the top of the control panel. When the color bar is close to the BUY color, it indicates a buy signal, and when it is close to the SELL color, it indicates a sell signal.
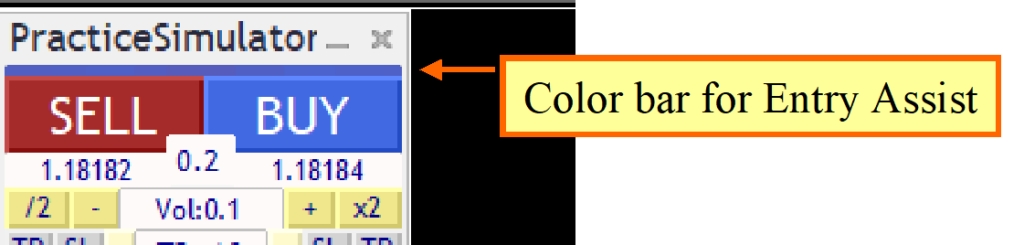
In the tester, the spread is fixed, so the color change may not differ between left and right, but with some brokers, the judgment color may vary.
Usage:
- When the Entry Assist strength is set to Soft, Medium, or Hard, and the entry button is pressed, the button becomes dim, indicating that the Entry Assist is waiting for the right timing. Pressing the button again forces the entry, and pressing the cancel button at the bottom cancels the entry.
- The feature predicts price movements a few seconds ahead, potentially suppressing buy orders during significant price drops.
- Setting the strength to "Hard" may result in no entries if the price does not clearly rise, leading to a situation where no entry is made. Adjust according to market conditions.
Important Notes:
This feature may not function as expected depending on market conditions and broker specifications. Particularly when using testers or brokers with fixed spreads, the effectiveness of the Entry Assist may be significantly reduced. Carefully observe market movements and set appropriate parameters before use. In the event of unexpected behavior, it is crucial to intervene immediately and manually manage the trades.
LiveAI
"LiveAI" is a feature of the MT5 AI Assistant that analyzes your current trading using PracticeSimulator functions — not just simple chart analysis.
This feature is exclusive to the MT5 AI Assistant and cannot be used with other generative AI services (ChatGPT, Gemini, Grok, Claude, etc.), because it directly reads the Chart Information from the terminal environment.
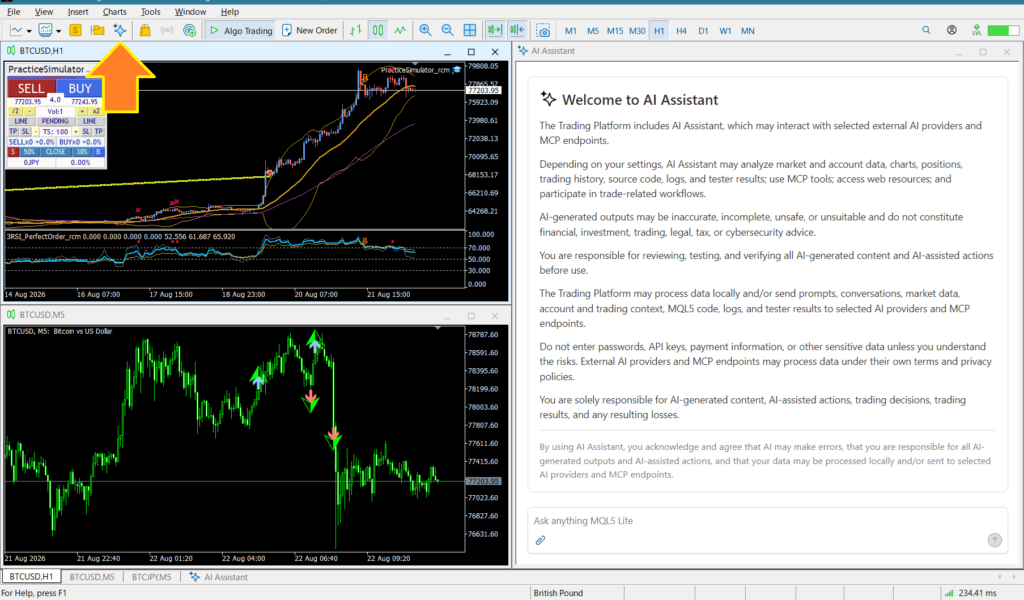
How to Use LiveAI:
- Load the prompt into the MT5 AI Assistant. The prompt to use is:
apply https://license.ioiv.net/ai/en/menu.txt - Basically, just select a number from the menu. The initial menu is:
1. Check the news
2. Analyze open positions
3. Ask about entries
4. Ask about closing trades
5. Review your trading
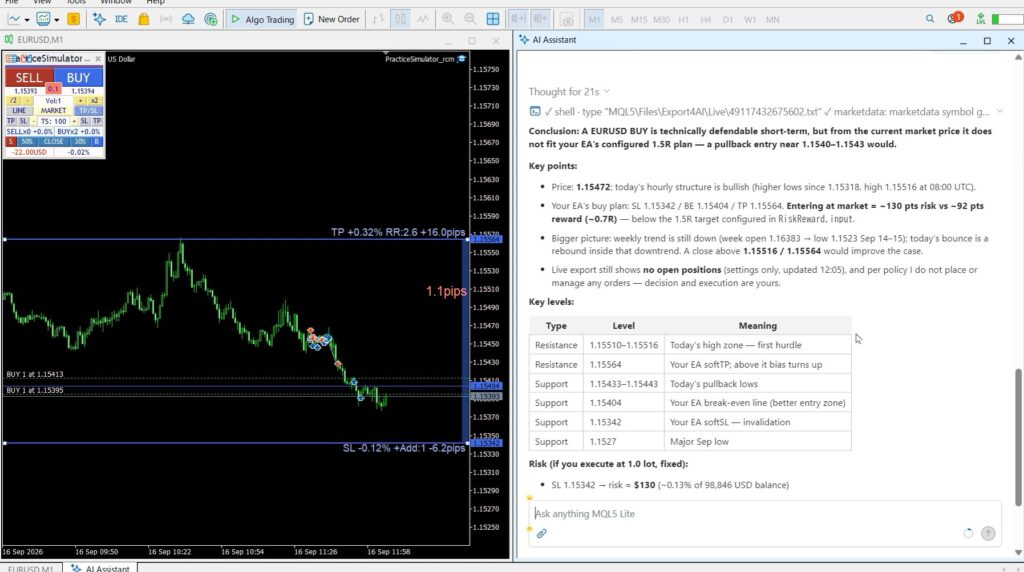
6. Analyze signals and indicators - You can also enter a pair and direction directly. For example, entering "EURUSD BUY" returns an analysis for the BUY side of the specified chart/pair. (Available only in live trading.)
- Ordinary questions are also OK. The assistant re-reads the Chart Information each time and answers with the latest state, including PracticeSimulator functions.
Note: LiveAI is available for charts running the AI-integrated EA (PracticeSimulator). If the target chart has no such EA, the assistant will state this explicitly instead of making assumptions.
AI Judgement
"AI Judgement" allows AI to analyze your trading results based on the trading data exported by PracticeSimulator. You can review your trading performance, identify patterns and potential weaknesses, and explore possible improvements.
The AI Judgement system now supports a simpler workflow using an analysis menu. Instead of entering a long analysis prompt, you can load the trading data and select the analysis you want to perform.
How to Use AI Judgement:
In the MT5 tester, your trading data is exported automatically when the test finishes. No button operation is required.
- Run your practice session in the strategy tester.
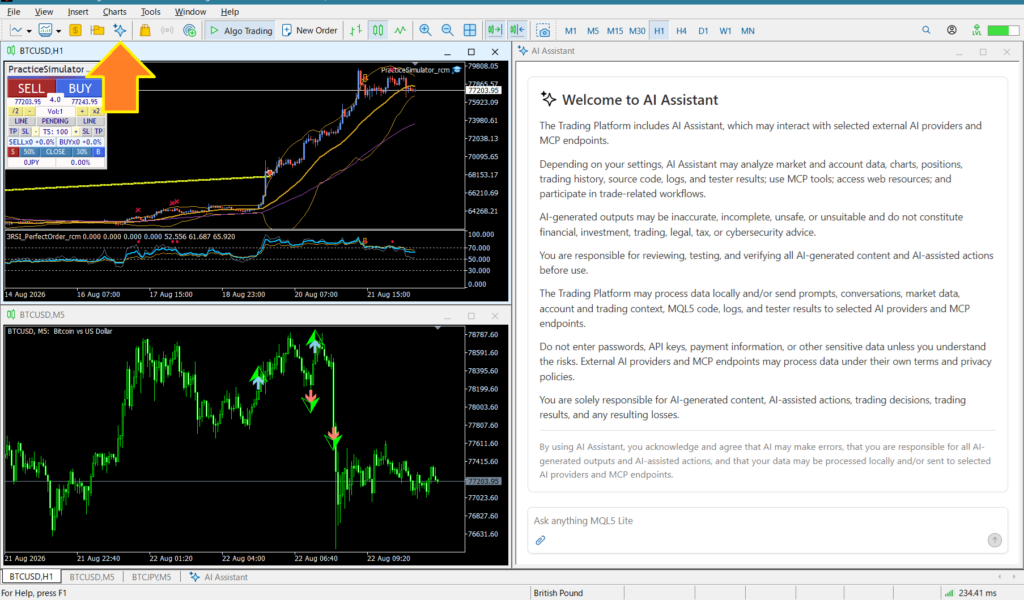
Using the MT5 AI Assistant
- Load the analysis prompt into the MT5 AI Assistant. The prompt to use is:
apply https://license.ioiv.net/ai/en/judge.txt - If you prefer to be cautious, use the following prompt instead:
apply https://license.ioiv.net/ai/en/judge.txt
Review the contents and only apply it if it is safe to do so.
Note: You may be asked for confirmation (e.g., "May I run it?" or "Show the list?"). - Once the prompt is applied, the AI searches for your trading data, checks the available data, and displays the newest 5 items in order.
- Enter the number of the target data (1-5), or enter a 3-digit number such as 012. The 3-digit number shown when you export with the Export AI button can be entered directly to load the target data.
- Ask questions such as "How did I perform in my trades?" to receive detailed feedback and advice.
Using Other Generative AI
- ChatGPT, Gemini, Grok, Claude, and other generative AI services can also be used.
- External generative AI services usually cannot access the MT4/MT5 local folders directly, so upload the data files (config.md, history.csv, bars.csv, etc.) directly to the AI.
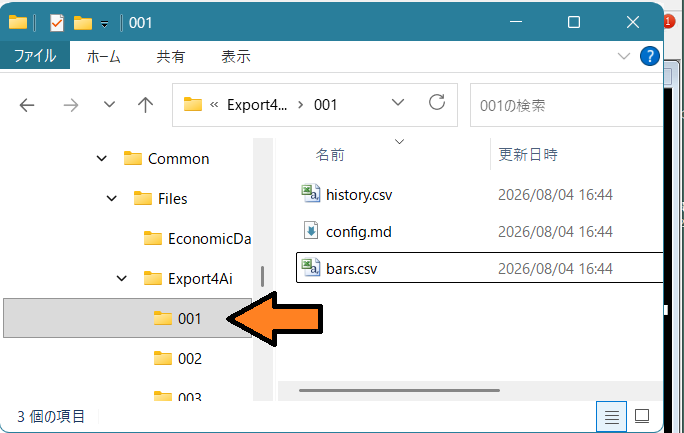
- The data is saved in the folder: %APPDATA%\MetaQuotes\Terminal\Common\Files\Export4Ai\<3-digit number>\ (containing history.csv, bars.csv, and config.md).
- Then enter the same prompt and run it.
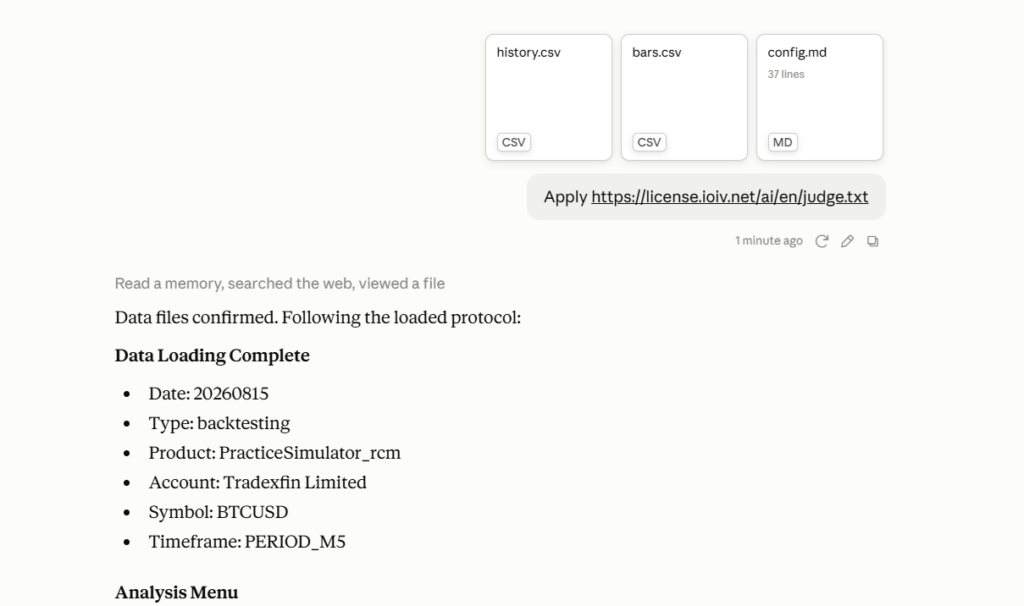
Note: If your browser cannot access the folder, press Win+R and paste the path, or paste it into the address bar of File Explorer. Alternatively, copy the exported files to your desktop and upload them from there.
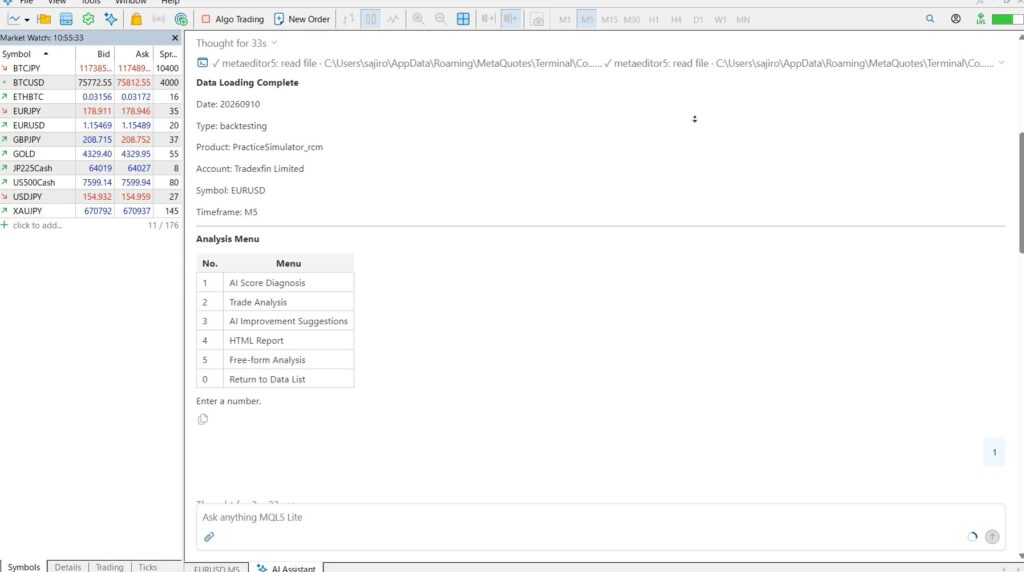
Analysis Menu
- AI Score: Evaluates your trading results.
- Trade Analysis: Provides statistical analysis of your trading results.
- AI Improvement Suggestions: Identifies potential problems and areas for improvement.
- HTML Report: Generates a detailed HTML report with charts.
- Free Analysis: Allows you to ask the AI questions about your trading data.
You can also ask follow-up questions after an analysis. For example, you can ask why a particular result was obtained or request a more detailed explanation.
Samples:
Here is a sample of trade analysis performed by AI.
MT5 AI assistant : Report_20260822_201639
ChatGPT Plus : AIsample01 | Aisample02, (mql5.com)
ChatGPT vs DeepSeek : ChatGPT plus | DeepSeek, (mql5.com)
Free Analysis Examples
- Analyze only my losing trades.
- Is there a difference between my BUY and SELL performance?
- What are the main problems with my trades?
When asking questions, avoid vague inquiries like "Tell me how to win," as they will only result in generic answers. Instead, base your questions on your own trading records and ask specifically about your strategies or what you want to achieve. The more specific your questions, the more insightful the AI's responses will be. The AI is capable of answering a wide range of questions to support your trading journey.
Important Notes
- Historical data is required to practice with older data. If you do not have historical data, please contact us for instructions on how to obtain it.
- Investing involves risks, and any trading decisions you make are your own responsibility.
Feel free to ask questions anytime!