Spread Hunter MT5
- Indicators
- Version: 1.30

Spread Hunter MT5 – Current and Historical Spread Indicator
Purpose
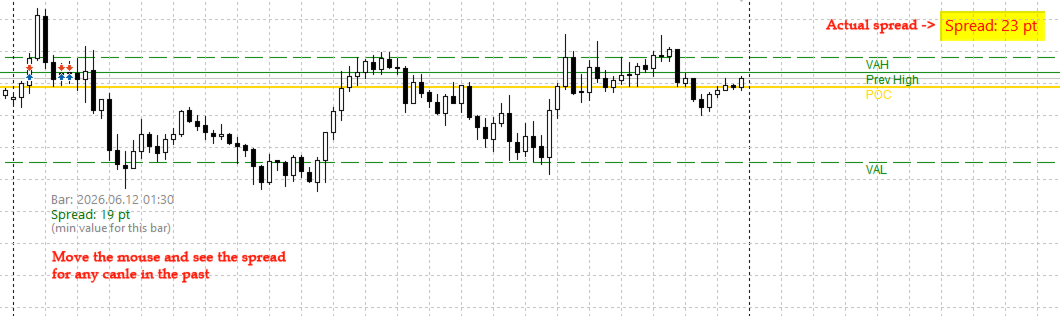
The indicator displays the current spread value in points as a compact panel in the upper right corner of the chart. When hovering the cursor over any candle, it shows the historical spread for that bar.
The tool is indispensable for traders whose strategies are sensitive to spread size: scalping, news trading, working with high-volatility instruments.
Key Features
Current Spread
Constantly displayed in the upper right corner. Updates in real time (once per second).
Historical Spread
When hovering the mouse over any candle, a tooltip appears with the following information:
-
Bar time
-
Spread value in points
-
A note that the minimum spread for the bar period is shown (a feature of historical data storage by brokers)
Color Indication
-
Green – spread within normal range (≤ set threshold)
-
Red – spread is high (> threshold)
The threshold is user-configurable (default is 20 points).
Interpretation
-
Low spread (green) – favourable entry conditions, especially for scalping and intraday trading.
-
High spread (red) – a reason to refrain from a trade or use wider stop-losses.
-
Historical spread – allows you to assess whether comfortable entry conditions existed in the past at the point you are analysing.
Implementation Features
-
Works on any timeframes and trading symbols.
-
Displays current spread in real time.
-
Shows historical spread when hovering over a candle.
-
Has a configurable background for better readability.
-
Does not use external DLL libraries.
-
Minimal impact on terminal performance.
Configuration Parameters
| Parameter | Description |
|---|---|
| SpreadThreshold | Spread threshold value (default: 20). When spread ≤ threshold – green colour, > threshold – red. |
| GoodSpreadColor | Colour for normal spread (default: bright green). |
| BadSpreadColor | Colour for high spread (default: red). |
| BgColor | Panel background colour (default: black). |
| FontSize | Font size (default: 12). |
| XOffset | Panel offset from the right edge of the chart (default: 10). |
| YOffset | Panel offset from the top edge of the chart (default: 10). |
Application in Trading
For Scalping
High spread (red) is a signal to refrain from trading. Wait for the spread to drop to the green zone.
For Trading
Monitor the spread when entering a position. If the spread exceeds a comfortable level – postpone the entry or adjust your stop-loss.
For History Analysis
Hover the cursor over the candle where the entry was made. Find out what the spread was at that moment. This will help you objectively assess the quality of the trade.
For Instrument Selection
Compare the average spread of different symbols. The panel shows the spread of the current chart; switch between instruments – and you will see where conditions are better.
Who It Is For
-
Scalpers – spread is critical for ultra-short trades. The indicator instantly signals unfavourable conditions.
-
Day traders – assess entry comfort and adjust position size depending on the spread.
-
Strategy developers – visual spread control during manual testing and optimisation.
-
Beginner traders – clearly see how spread affects a trade and learn to choose moments with better conditions.
-
Anyone who analyses trade history – historical spread on hover allows you to return to any entry moment and assess its validity.
Technical Details
Why does the tooltip say "min value for this bar"?
When copying historical data using the CopySpread function, most brokers return the minimum spread value for the bar period, not the average or the last one. This is a data storage feature. The indicator honestly informs about this so that the trader has a complete understanding of what they are seeing.
For the current spread (corner panel), the actual real-time value is used.