Confluence Bias Map
- Indicators
-
Nguyen Thanh Trieu
 I'm a software developer and trader. I build practical tools for MetaTrader 5 that I use in my own trading.
My work covers market structure, price action logic, risk visualization, and custom indicators and utilities. - Version: 1.0
Confluence Bias Map aggregates key market indicators into a single, real-time score to support your trading analysis.
When analyzing charts, looking at multiple separate indicators (Moving Averages, MACD, ADX, RSI, Stochastic, Bollinger Bands, MFI, ATR) individually often leads to conflicting signals and analysis paralysis. Comparing trends, momentum, volatility, and volume across different timeframes without a structured methodology makes it difficult to define the true market bias. Confluence Bias Map solves this by aggregating these 4 core market dimensions across 3 timeframes into a single, real-time score.
What it shows:
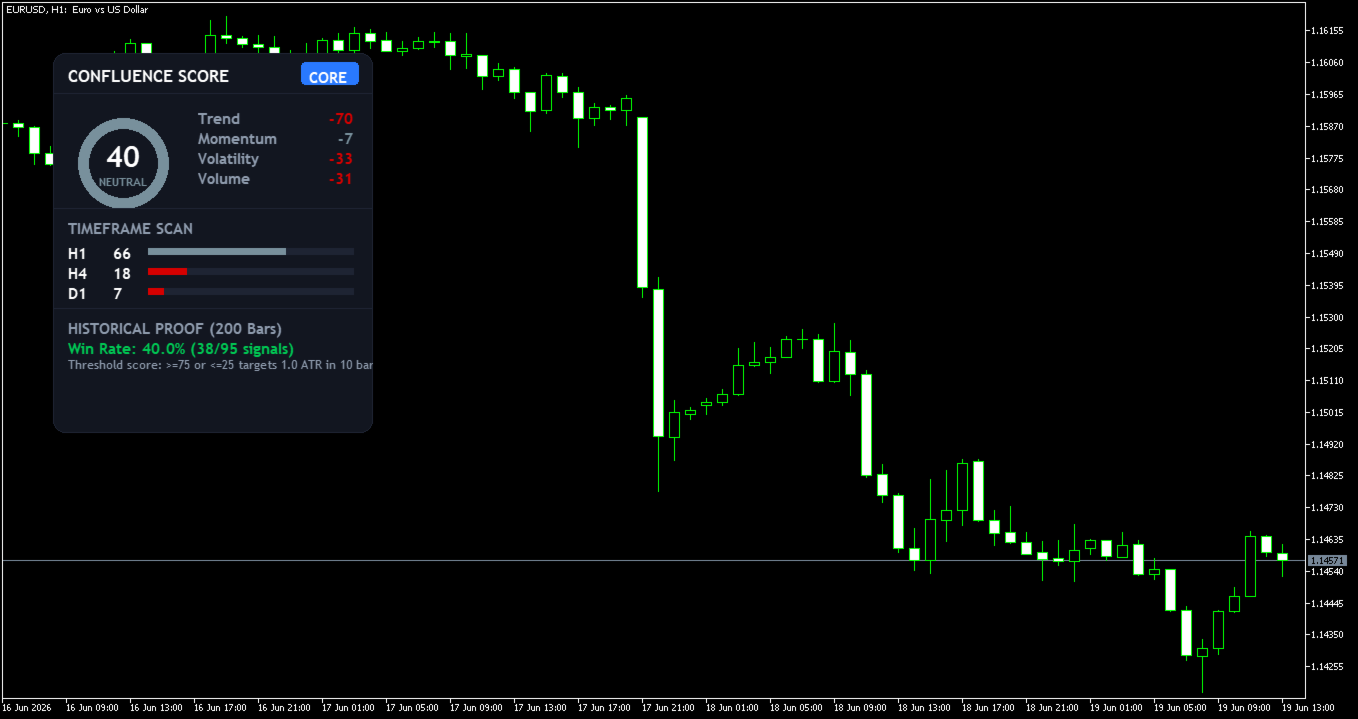
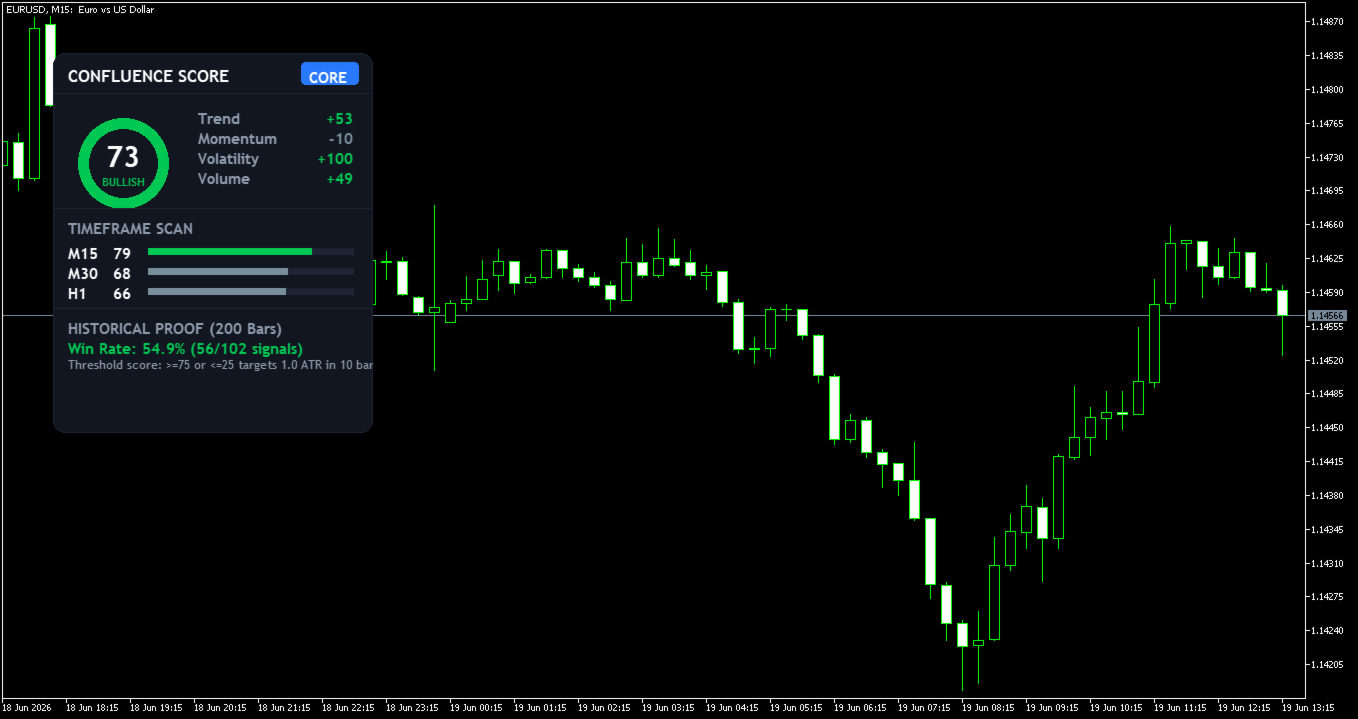
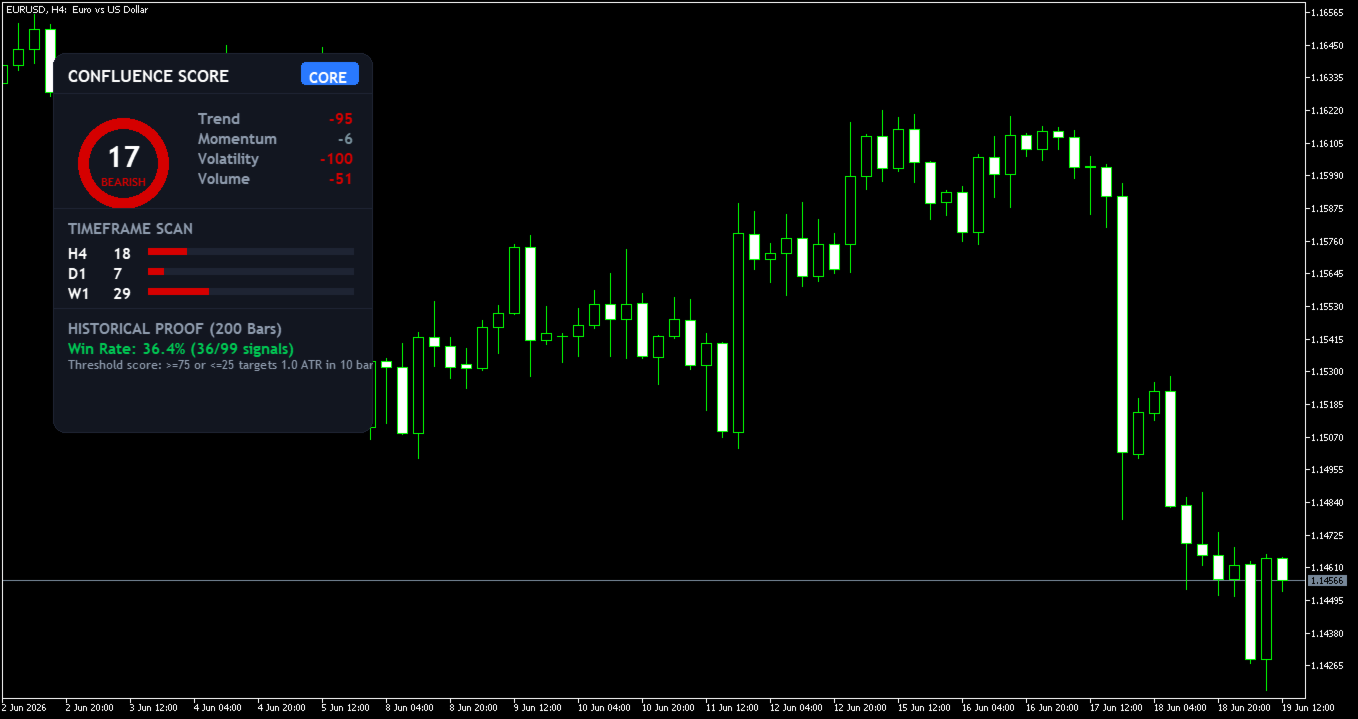
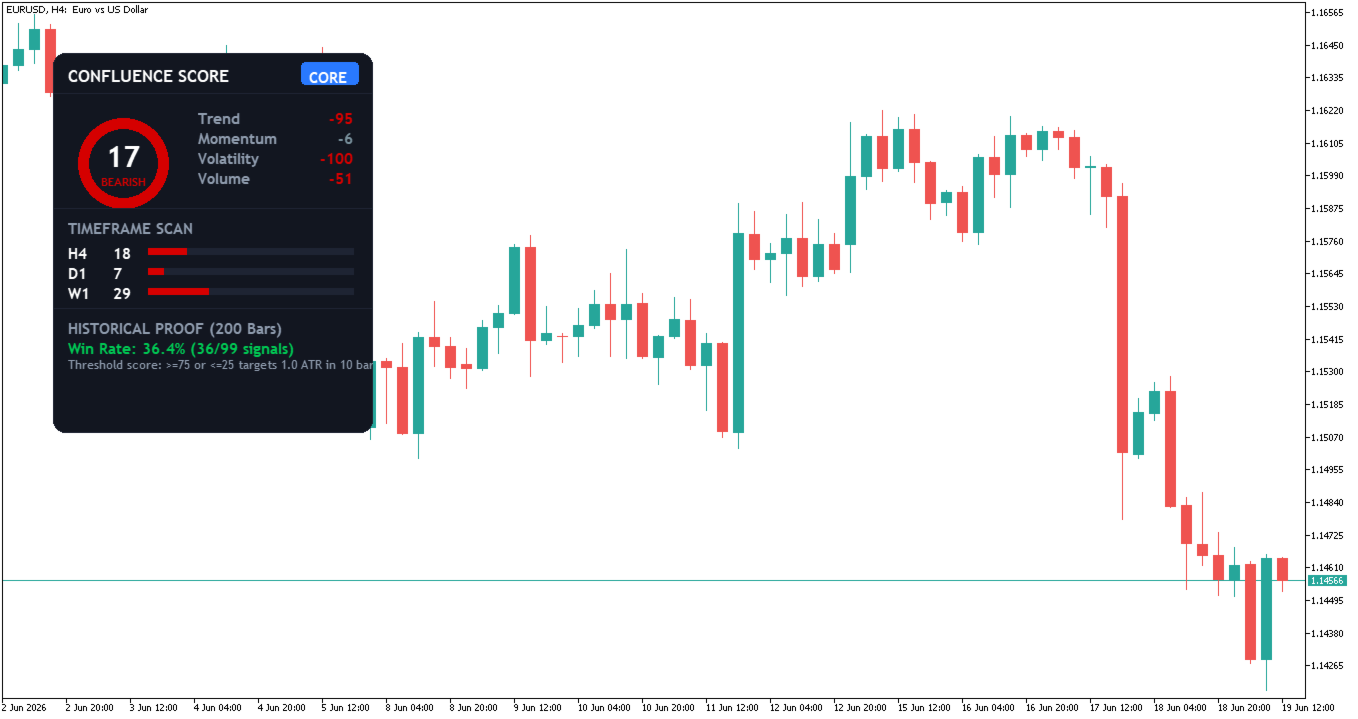
- Donut Gauge: Displays the aggregated Confluence Score from 0 to 100 in the center of the dashboard.
- Category Breakdown: Shows individual scoring averages for Trend (EMA, MACD, ADX), Momentum (RSI, Stochastic), Volatility (Bollinger Bands), and Volume (MFI).
- Timeframe Scan: Shows individual scores and real-time progress bars for 3 timeframes: the current chart period and two higher periods (e.g., M15, M30, H1).
- Historical Proof: Computes and displays the historical win rate of signal triggers (score >= 75 or <= 25 reaching a 1.0 * ATR target within 10 bars) directly on the panel.
How to read it:
- Bullish Bias (Score >= 70): The Donut Gauge turns green, suggesting bullish confluence across monitored layers.
- Bearish Bias (Score <= 30): The Donut Gauge turns red, suggesting bearish confluence across monitored layers.
- Neutral Market (Score 31 to 69): The Donut Gauge turns gray, suggesting conflicting signals or a consolidating market bias.
- Timeframe Alignment: Look for matching high or low scores across scanned timeframes for stronger directional agreement.
Signal stability:
Historical statistics and alert triggers are processed once per bar close. The live dashboard score updates in real-time once every second during active market conditions.
Best fit:
Liquid instruments (Forex, Gold, Indices, Cryptocurrencies) | Intraday and swing timeframes (M5 to H4) | Systematic and discretionary trading styles.
What it does NOT do:
- It does not generate automatic trading orders.
- It does not guarantee future trading profits or predict market directions with absolute certainty.
- It does not replace your own risk-management rules or trading plan.
Core settings:
- Detection Settings: Customize periods for Fast MA (10), Slow MA (20), MACD (12, 26, 9), ADX (14), RSI (14), Stochastic (5, 3, 3), Bollinger Bands (20, 2.0), MFI (14), and ATR (14).
- UI Position: Adjust drag-and-drop dashboard default X/Y coordinates on the chart.
- Alerts: Toggle terminal alerts, sound cues, push alerts, and email notifications.
Attach to one chart only.
Questions? Visit my MQL5 profile for support.