Confluence Bias Map
- Indicatori
-
Nguyen Thanh Trieu
 I am a software developer and trader focused on building practical trading tools for MetaTrader 5.
My work is centered on:
- Market structure analysis
- Price action logic
- Risk visualization
- Custom indicators and utilities - Versione: 1.0
Confluence Bias Map
Analyzing multiple indicators across different timeframes often leads to conflicting signals, causing traders to enter too late or hesitate during critical market moves.
This inconsistency occurs because individual tools like moving averages, oscillators, and volume meters are monitored in isolation, lacking a unified perspective.
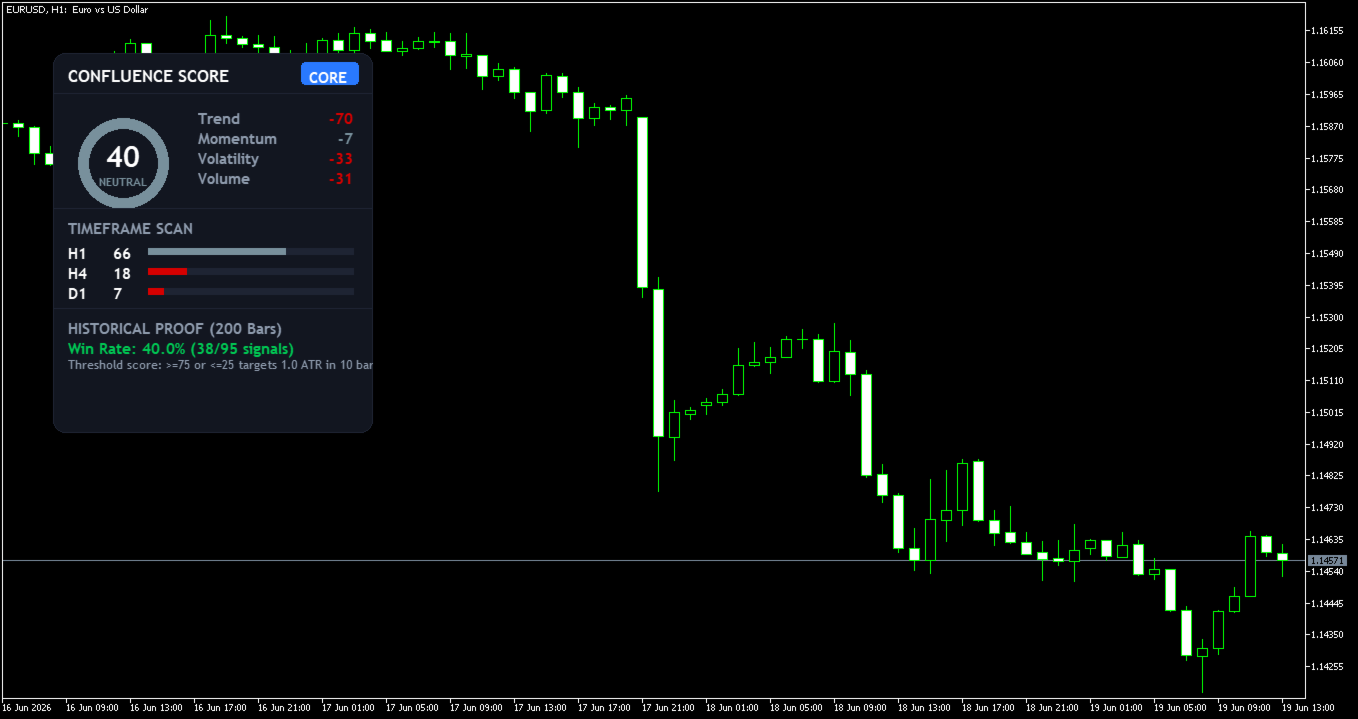
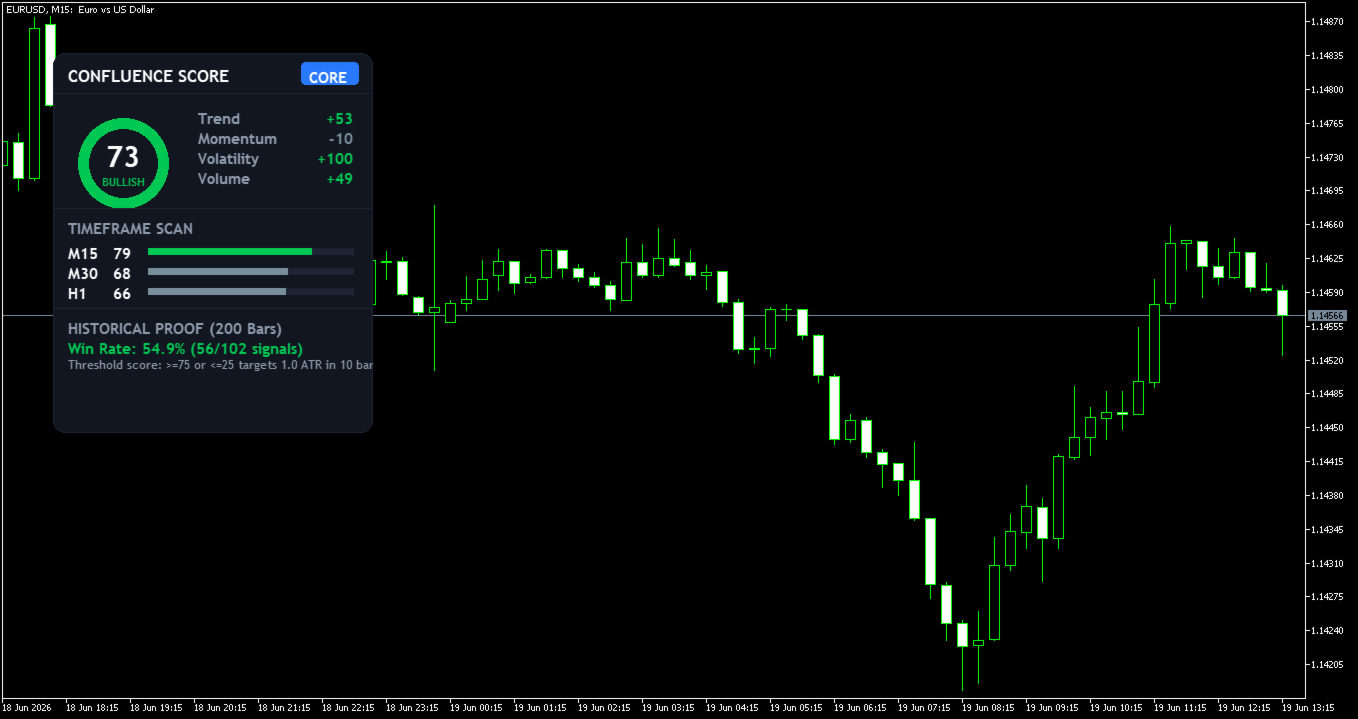
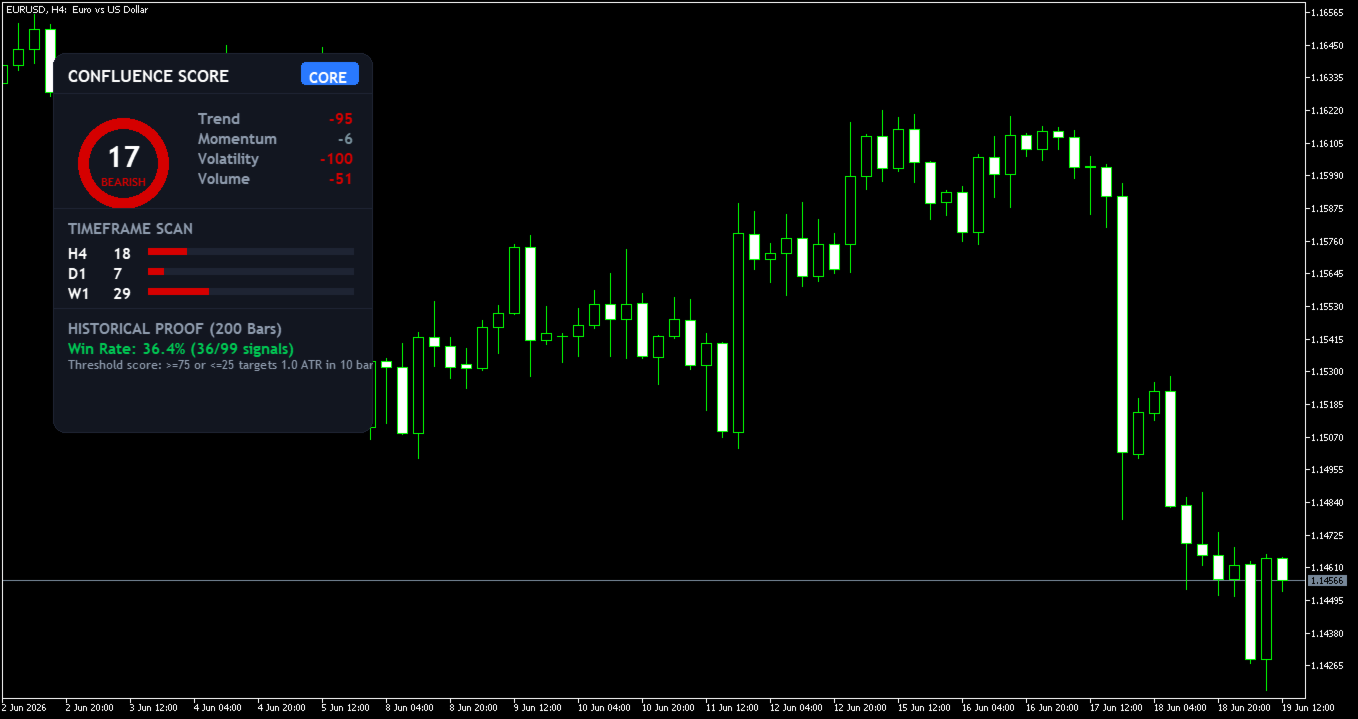
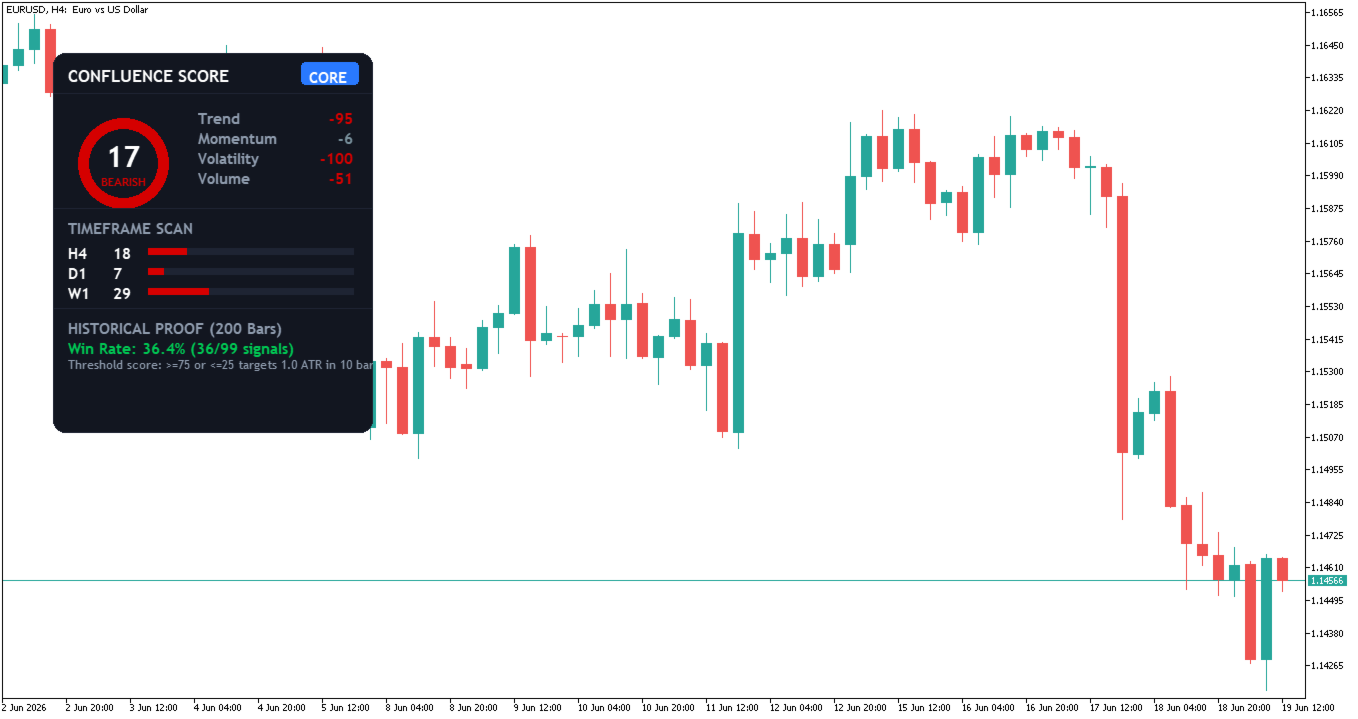
Confluence Bias Map solves this by aggregating trend, momentum, volatility, and volume indicators into a single, real-time score (0 to 100) displayed on an interactive dashboard.
Crucial Note: The indicator scans multiple parameters to give you a consolidated market direction score, showing whether buyers or sellers are dominant.
Key Advantages for Traders:
- Unified Trend Score: Combines trend, momentum, volatility, and volume analytics into one easy-to-read meter.
- Multi-Timeframe Dashboard: View market bias across up to 6 different timeframes simultaneously from a single chart.
- Historical Win-Rate Statistics: Displays a performance panel showing the historical success rate of previous bias levels.
- Interactive Interface: Drag and place the dashboard anywhere on your chart with a single click.
- Real-Time Push Alerts: Receive instant mobile notifications and desktop alerts when strong buy or sell biases form.
Main User Settings:
- Trend Filters: Customize moving average crossover and strength settings to match your trading style.
- Momentum Filters: Adjust oscillators to capture short-term or long-term market swings.
- Volatility Filters: Tune range indicators to detect market breakouts and periods of low liquidity.
- Volume Filters: Modify money flow inputs to track active buying and selling pressure.
- Timeframe Setup: Choose which timeframes to display on your dashboard and assign custom weights to each.
- Notifications: Enable or disable push alerts sent directly to your phone.
- History Depth: Choose how many past bars to analyze for the win-rate calculation panel.
What it does NOT do:
- It does not execute automatic trades or manage positions.
- It does not repaint historical scores after a candle has closed.
- It does not promise guaranteed profits or predict market direction with absolute certainty.
Quick Setup:
- Attach the indicator to one chart only.
- Configure your desired timeframes and alert thresholds in the settings.
Simplify your technical analysis and confirm your entry setups with the Confluence Bias Map.