Session Box And Timer
- Indicators
-
Nguyen Thanh Trieu
 I'm a software developer and trader. I build practical tools for MetaTrader 5 that I use in my own trading.
My work covers market structure, price action logic, risk visualization, and custom indicators and utilities. - Version: 1.0
Session Box And Timer
Intraday trading requires monitoring the transitions between major market sessions, yet overlaying schedules manually is prone to calculation errors. Without clear markers, key price levels and liquidity zones of prior sessions can be easily overlooked. Session Box And Timer visualizes trading sessions, volatility trends, and countdown timers directly on your chart.
What it shows:
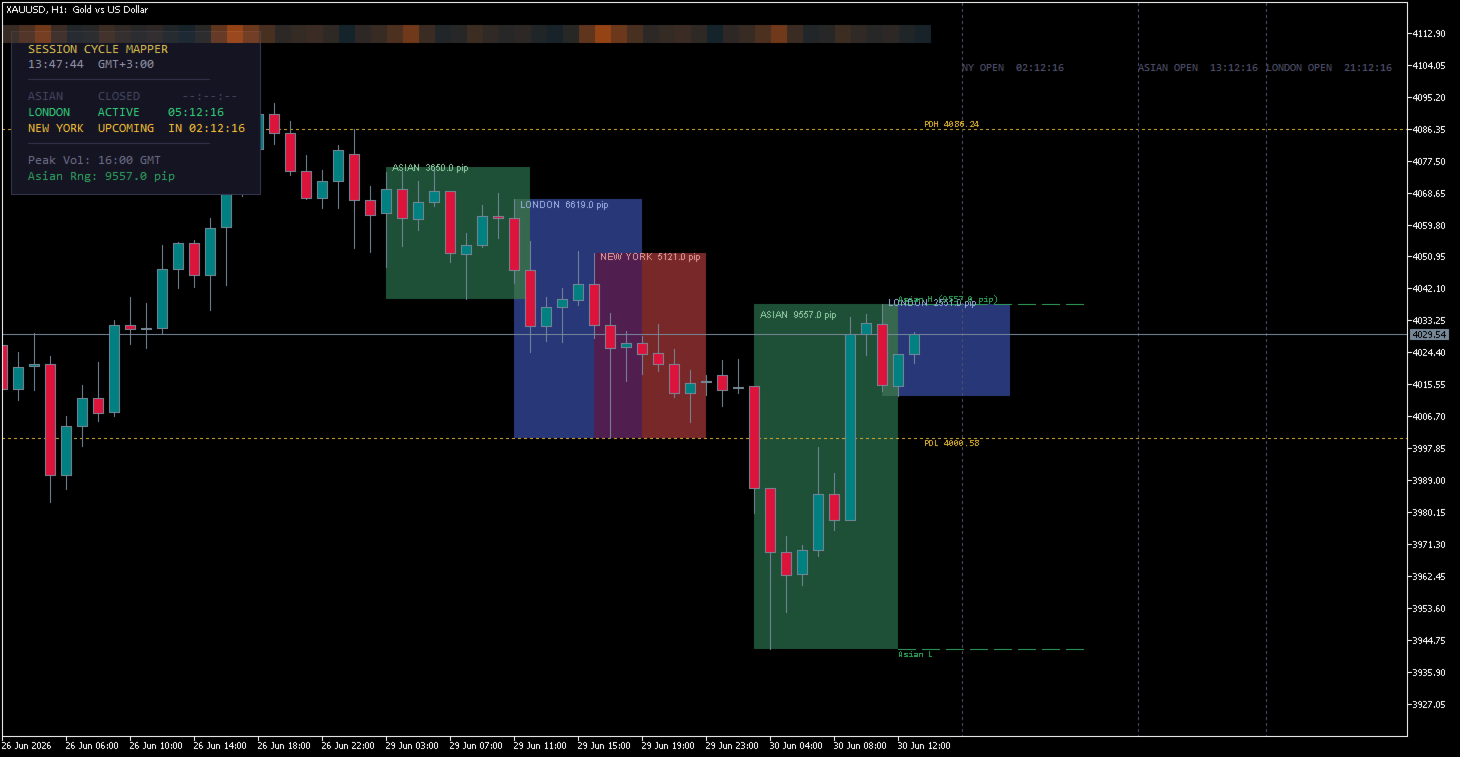
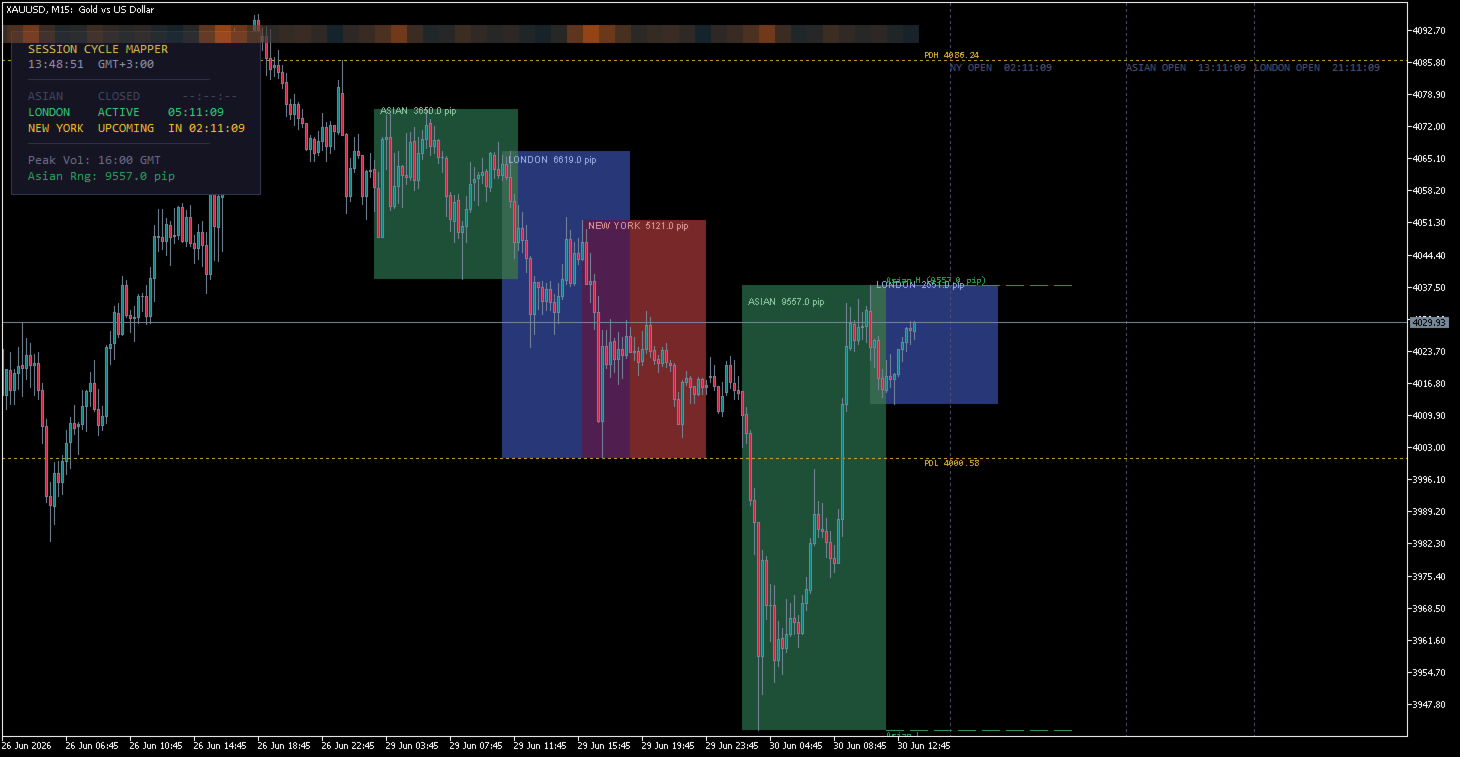
- Session Boxes: Visual colored rectangles representing Asian, London, and New York sessions, with automatic pip range calculation displayed in the labels.
- Asian Range Levels: Projections of the Asian high and low levels extended to the right as horizontal lines for intraday breakout reference.
- Previous Day High/Low (PDH/PDL): Dotted horizontal lines marking the high and low boundaries of the prior day.
- Cycle Lines & Countdown Labels: Vertical lines at upcoming session opens showing the exact countdown time remaining (HH:MM:SS) until the next session starts.
- Volatility Heatmap: A continuous multi-colored block indicator at the bottom of the chart showing historical hourly volatility over the past 20 days.
- Dashboard Panel: A clean overlay showing active or upcoming sessions, live countdowns, local GMT offset, Peak Volatility Hour, and Asian range pips.
How to read it:
- Intraday Breakout Reference: Use the Asian Range High/Low lines to spot breakouts during London or New York sessions.
- Peak Volatility Windows: The Volatility Heatmap shifts to warmer colors (e.g., orange/red) during hours with the highest historical movement, showing you when volatility is typically high.
- Session Timing: Check the countdown indicators on the panel or chart lines to coordinate your executions around session openings.
- Prior-Day Boundaries: The PDH and PDL lines mark key support or resistance areas that price often tests during the current day.
Signal stability:
The historical session boxes and daily levels are static. The countdown timer updates tick-by-tick or second-by-second in real time. The Volatility Heatmap is calculated from historical bar data and does not repaint current historical segments.
Best fit:
Any financial assets (Forex, Indices, Metals, Cryptos) | All timeframes (Optimized for M1 to H1 charts) | Day trading, Scalping, and Intraday Breakout strategies.
What it does NOT do:
- It does not generate trade signals or auto-execute orders.
- It does not predict future price movements.
- It does not replace your own risk parameters or trading plan.
Core settings:
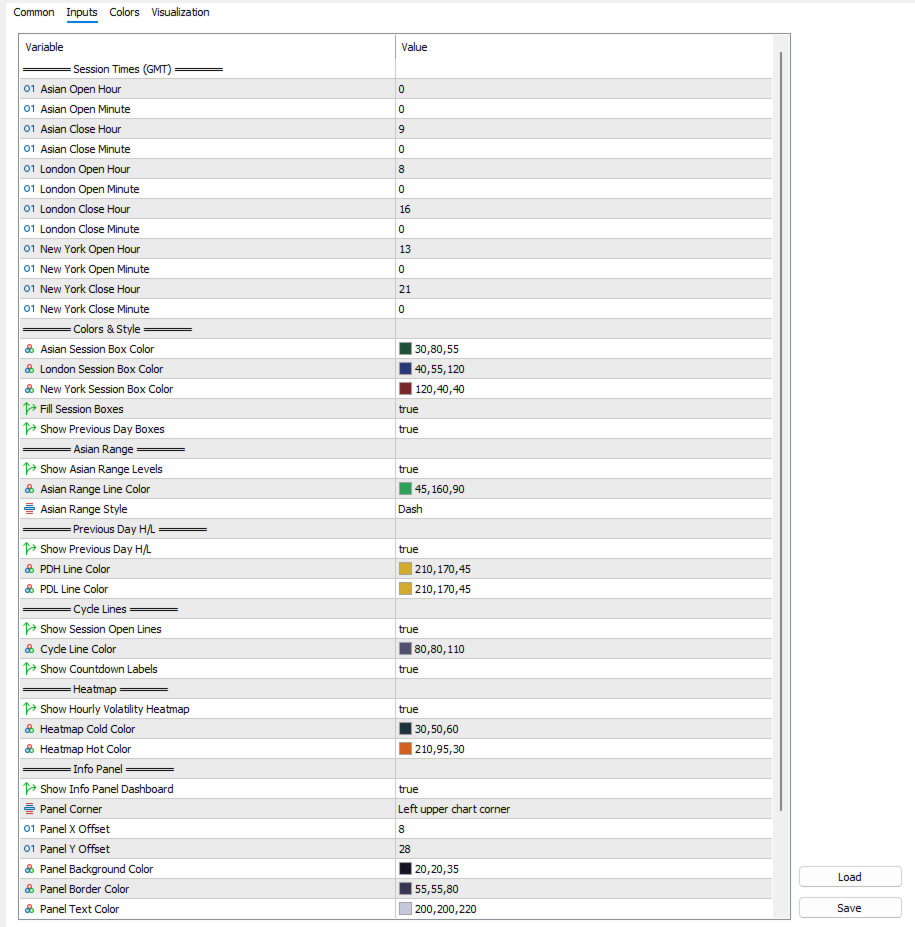
- Session Times (GMT): Configure custom hours and minutes for Asian, London, and New York sessions.
- Colors & Style: Customize box colors, border colors, and toggle previous day boxes.
- Asian Range & PDH/PDL: Enable/disable levels, select line style, and color preferences.
- Cycle Lines & Countdown: Toggle vertical lines and countdown text display.
- Heatmap: Toggle the 24h heatmap and adjust the cold/hot color theme.
- Info Panel: Select corner alignment, offsets, background, border, and text colors.
- Alerts: Toggle audio/visual alerts when a session opens.
Installation scope:
Attach to one chart only. The indicator manages data calculations and overlays per symbol automatically.