Chart Patterns MT4
- Indicators
-
Agus Santoso
 DISCLAIMER ON : The author of EA will not be held responsible for your losses or problems of any kind if the EA is directly or indirectly responsible for any losses.
Our software is provided “as is”, without any warranty or condition of any kind, express, implied or statutory. - Version: 1.0
- Activations: 5
MQL5 Blogs : https://www.mql5.com/en/blogs/post/771198
MT4 Version : https://www.mql5.com/en/market/product/180397
MT5 Version : https://www.mql5.com/en/market/product/180398
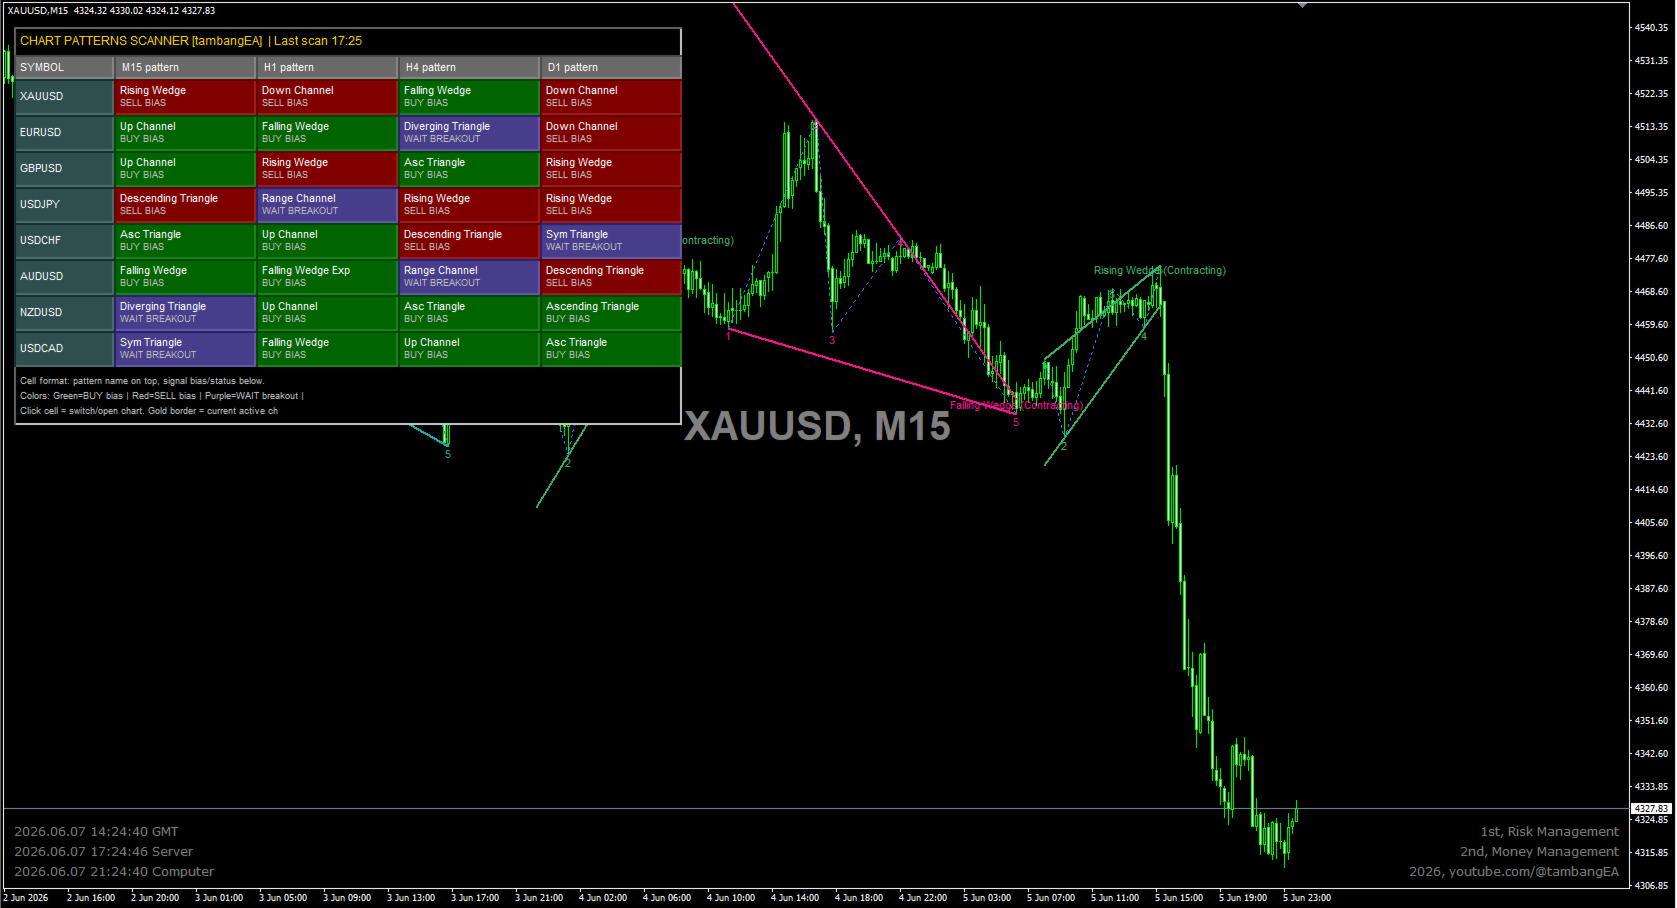
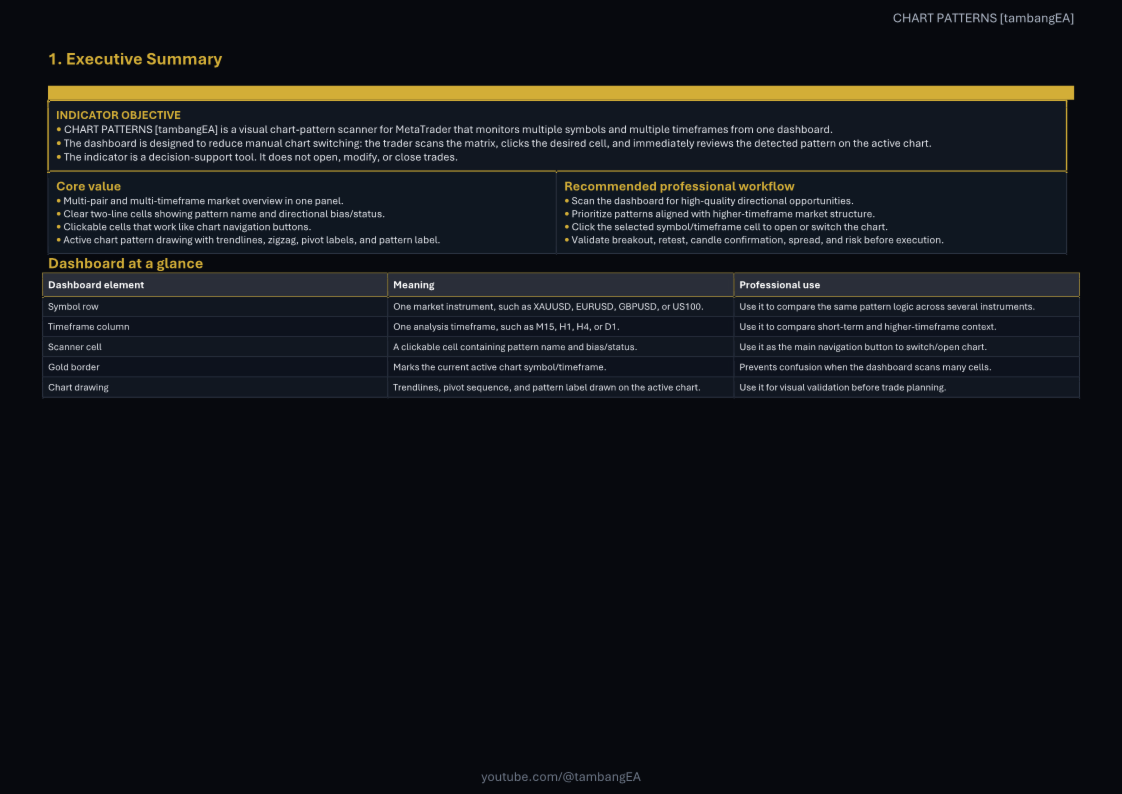
CHART PATTERNS [tambangEA] is a professional MetaTrader 5 indicator designed to detect, scan, and visualize major chart patterns across multiple symbols and multiple timeframes. It combines an active-chart pattern drawing engine with a clear multi-pair and multi-timeframe dashboard, allowing traders to monitor market structure more efficiently from one chart.
This indicator is built for traders who use price action, technical structure, breakout analysis, and pattern-based decision making. It helps identify potential channels, wedges, triangles, and other common chart formations directly on the chart.
Key Features
Multi-Symbol and Multi-Timeframe Scanner
The dashboard can scan multiple symbols and timeframes at the same time. Traders can monitor several markets from one chart without manually switching between symbols.
Supported dashboard information includes:
Symbol name
Timeframe column
Detected chart pattern
Directional bias or waiting status
Active chart highlighting
Last scan update time
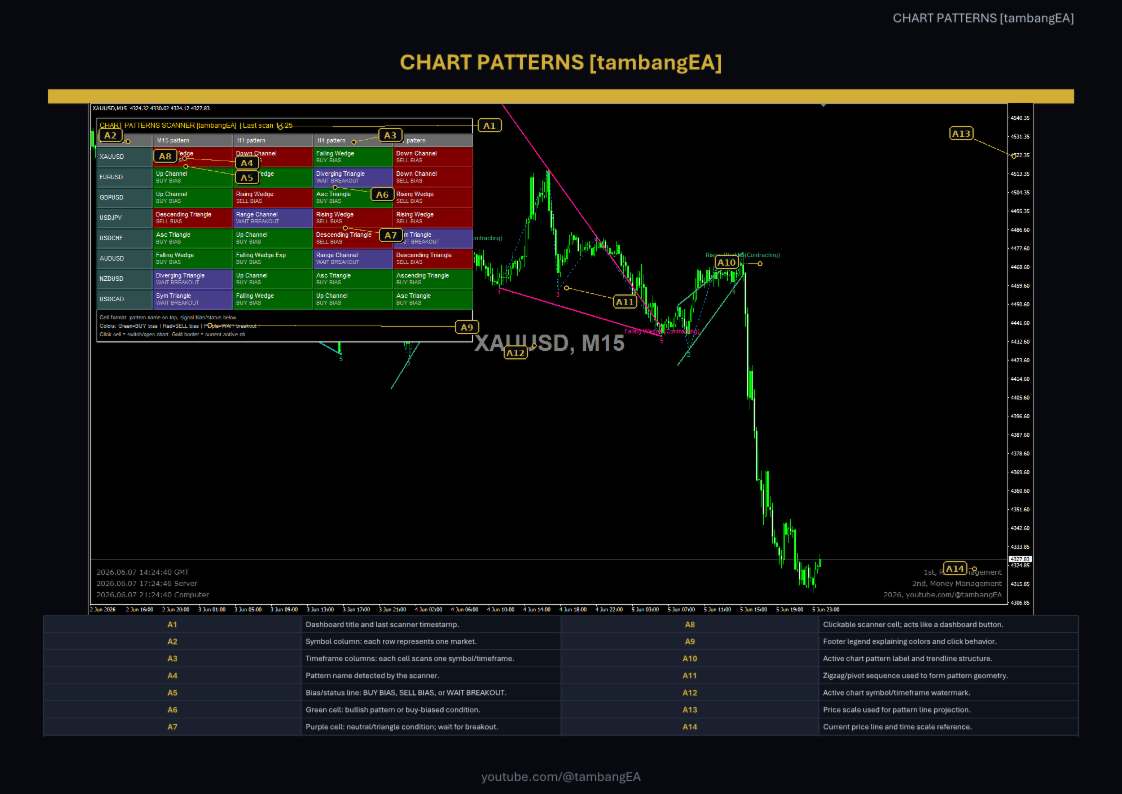
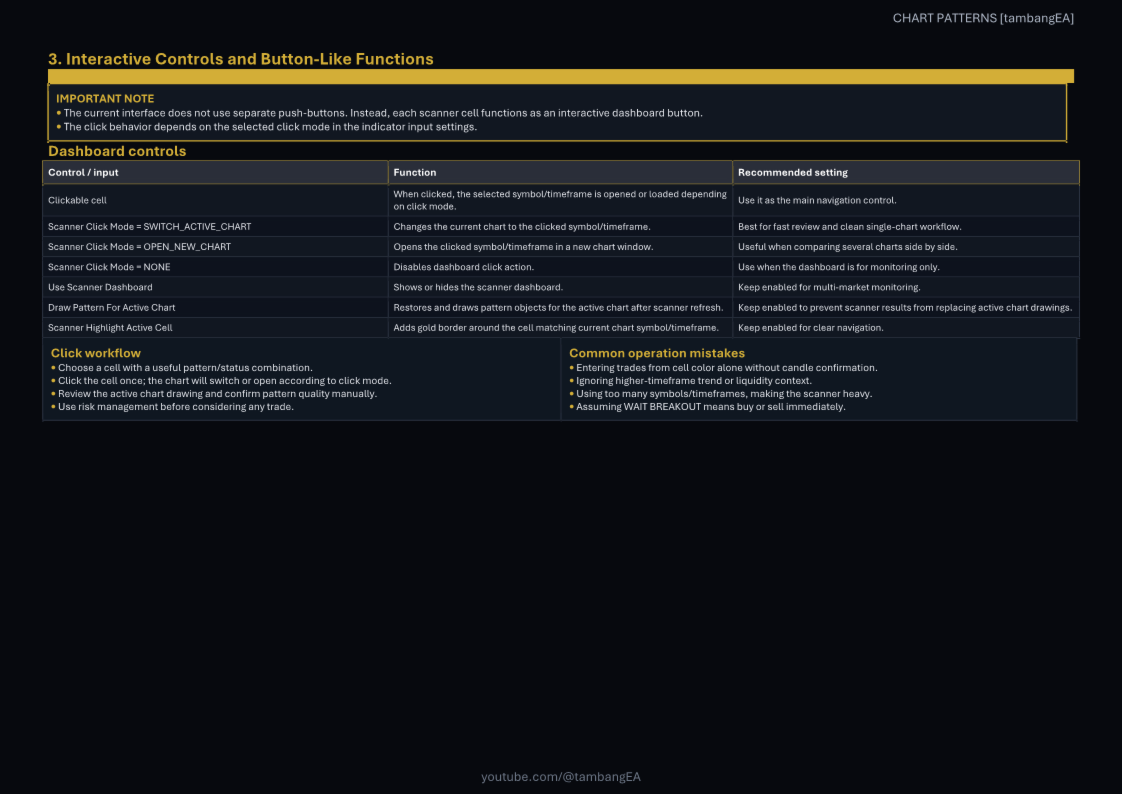
Clickable Dashboard Cells
Each dashboard cell can be clicked to switch or open the selected symbol and timeframe. This allows faster market navigation and easier pattern inspection.
Instead of manually opening charts one by one, traders can simply click the scanner cell and immediately review the selected market.
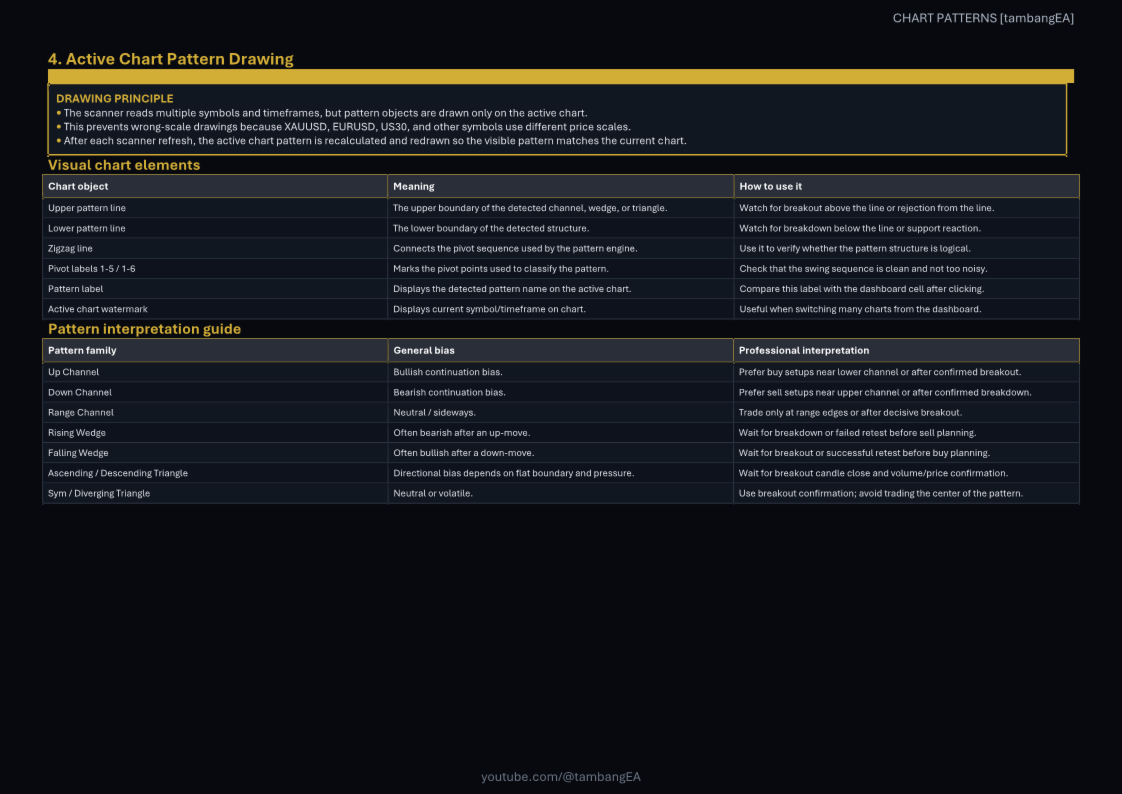
Active Chart Pattern Drawing
The indicator draws detailed pattern structures only on the active chart. This keeps the chart clean and ensures that trendlines and pattern objects match the correct price scale.
The active chart may display:
Upper pattern line
Lower pattern line
Zigzag structure
Pivot numbers
Pattern label
Detected market formation
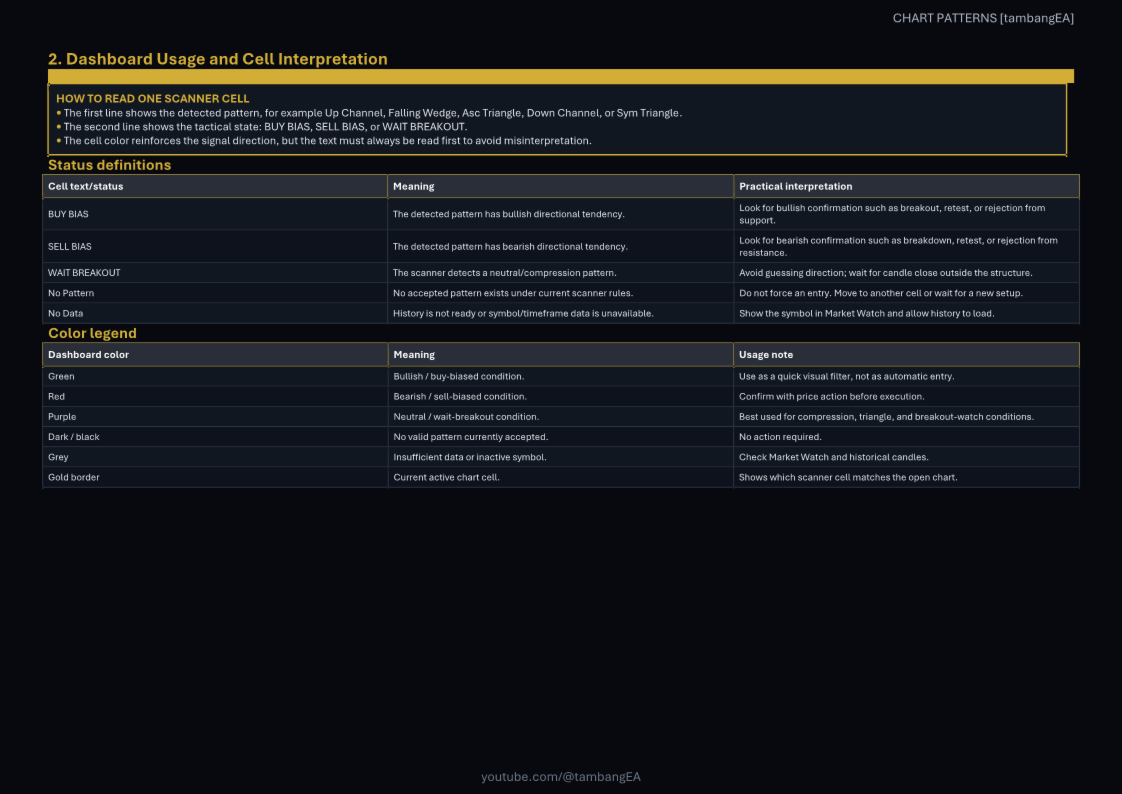
Clear Pattern Names and Signal Bias
The dashboard uses readable pattern names instead of unclear abbreviations. Each detected setup is shown with a practical trading interpretation.
Examples:
Up Channel — BUY BIAS
Down Channel — SELL BIAS
Rising Wedge — SELL BIAS
Falling Wedge — BUY BIAS
Ascending Triangle — BUY BIAS
Descending Triangle — SELL BIAS
Sym Triangle — WAIT BREAKOUT
Range Channel — WAIT BREAKOUT
No Pattern — No valid structure detected
No Data — Market history is not available yet
Color-Based Dashboard Reading
The dashboard is designed for quick visual analysis.
Color meaning:
Green: bullish or buy-biased pattern
Red: bearish or sell-biased pattern
Purple: neutral structure or waiting for breakout
Dark/black: no valid pattern
Gray: no available data
Gold border: current active chart cell
Pattern Recognition Engine
The indicator is designed to detect several important chart formations, including:
Ascending Channel
Descending Channel
Ranging Channel
Rising Wedge
Falling Wedge
Expanding Wedge
Contracting Wedge
Converging Triangle
Diverging Triangle
Ascending Triangle
Descending Triangle
These patterns can be used as market structure references for breakout, retest, continuation, or reversal analysis.
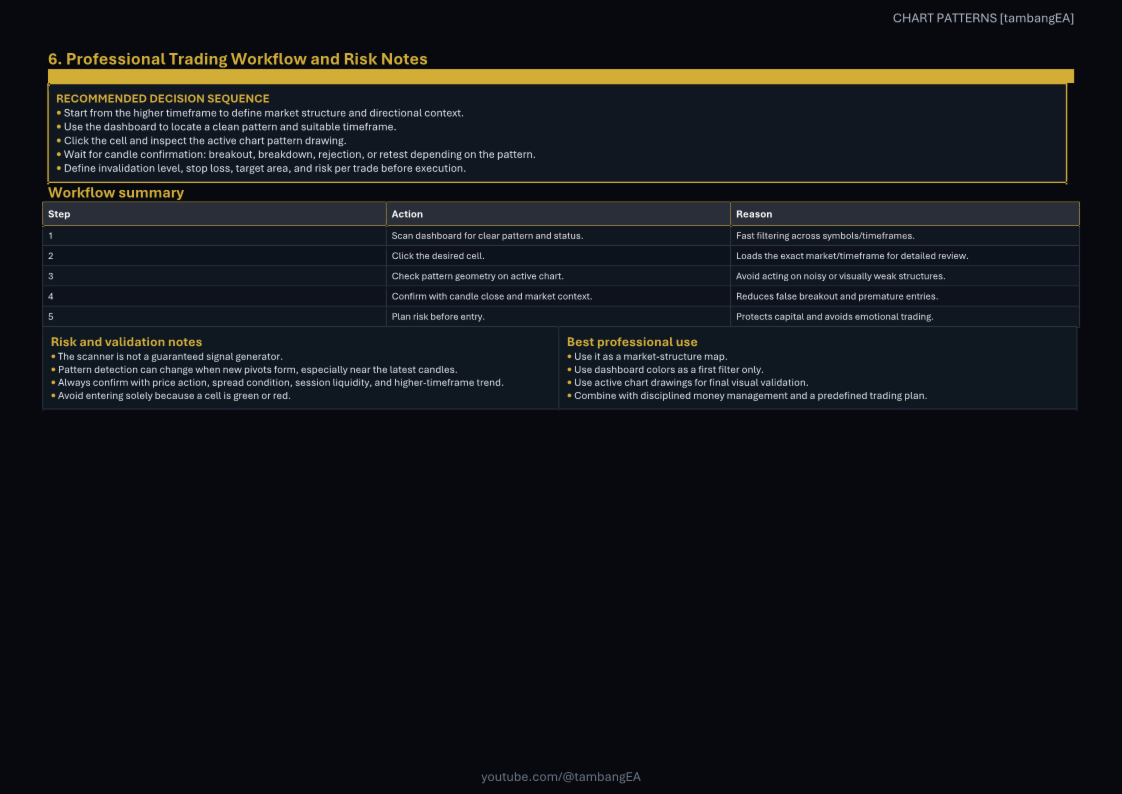
Practical Trading Workflow
A simple workflow may be:
Use the dashboard to find symbols and timeframes with active chart patterns.
Focus on patterns with clear bias or breakout potential.
Click the dashboard cell to inspect the chart.
Confirm the structure manually using candlestick behavior, support/resistance, trend direction, volatility, and risk-to-reward.
Plan entry, stop loss, and take profit based on your own trading system.
This indicator is best used as a market structure assistant, not as a standalone automatic trading system.
Important Notes
The indicator does not open, modify, or close trades. It is a visual and analytical tool only.
Chart patterns are market structure references. They are not guaranteed trading signals. Patterns may change as new candles appear and as market structure develops. Always confirm the setup with your own trading rules and risk management.
Trading involves risk. Past market structure does not guarantee future results.