Multi Indicators Osw MT5
- Indicators
-
William Oswaldo Mayorga Urduy
 MQL4 and MQL5 trader and developer since February 2019, delivering projects in under one day and providing post-delivery technical support.
Optimized code, advanced logic, and high-quality code. - Version: 1.0
Multi Indicators Osw
Commercial Description
Multi Indicators Osw is a definitive technical workstation that consolidates 8 of the most powerful classic trading strategies into a single tool for MetaTrader 5. Designed to simplify visual analysis, this indicator allows filtering and visualizing confluences of RSI, MACD, Moving Averages, Bollinger Bands, Stochastic, CCI, Parabolic SAR, and Envelopes without cluttering your chart. It is the ideal solution for traders seeking precise technical confirmations with a professional and independent alert system for each strategy.
Parameter Guide (Inputs)
Strategy and Indicator Configuration
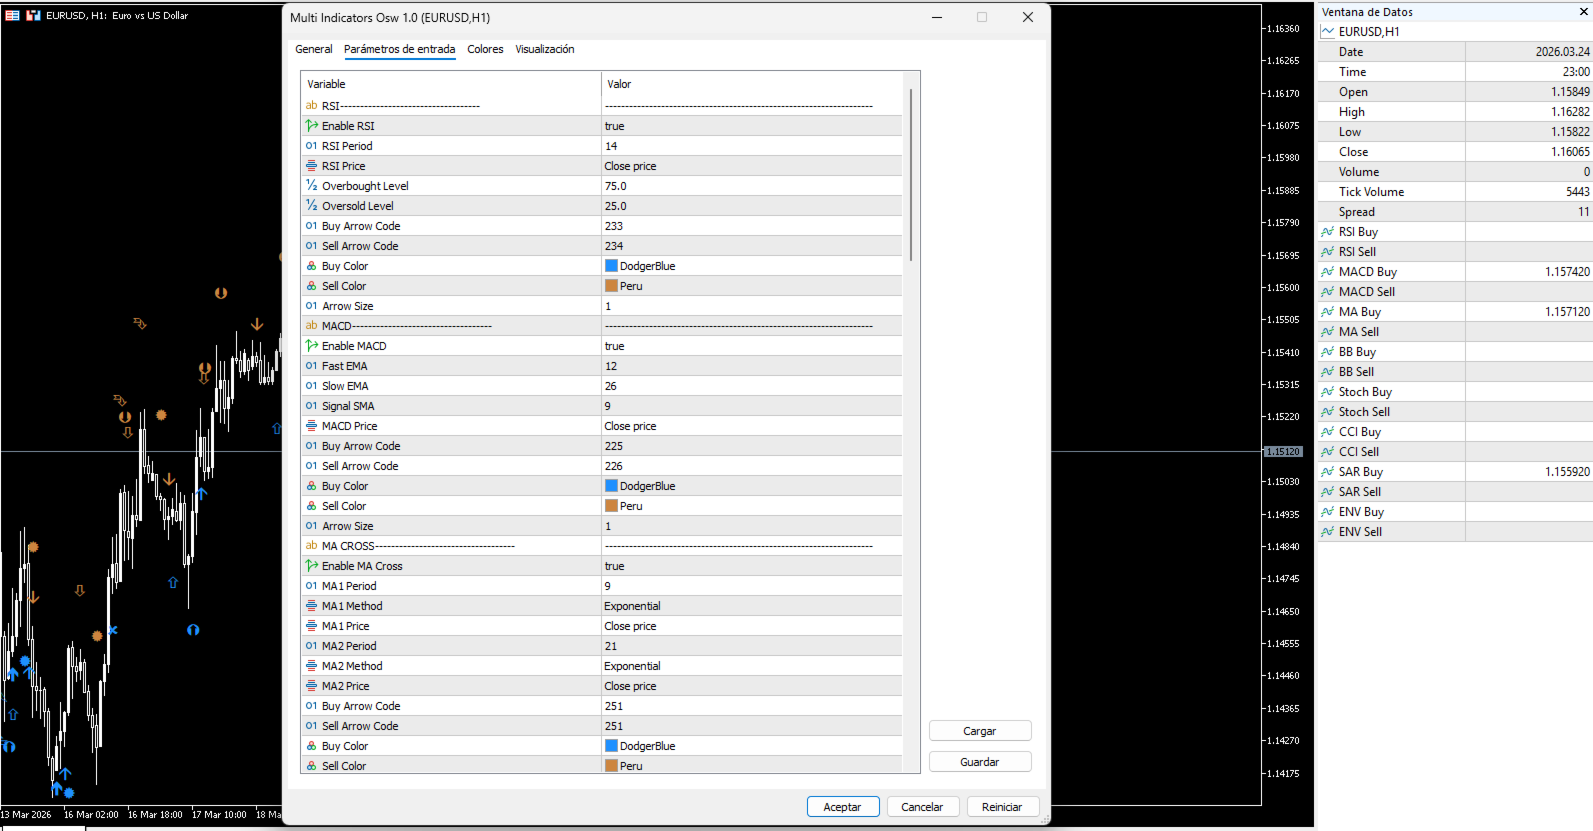
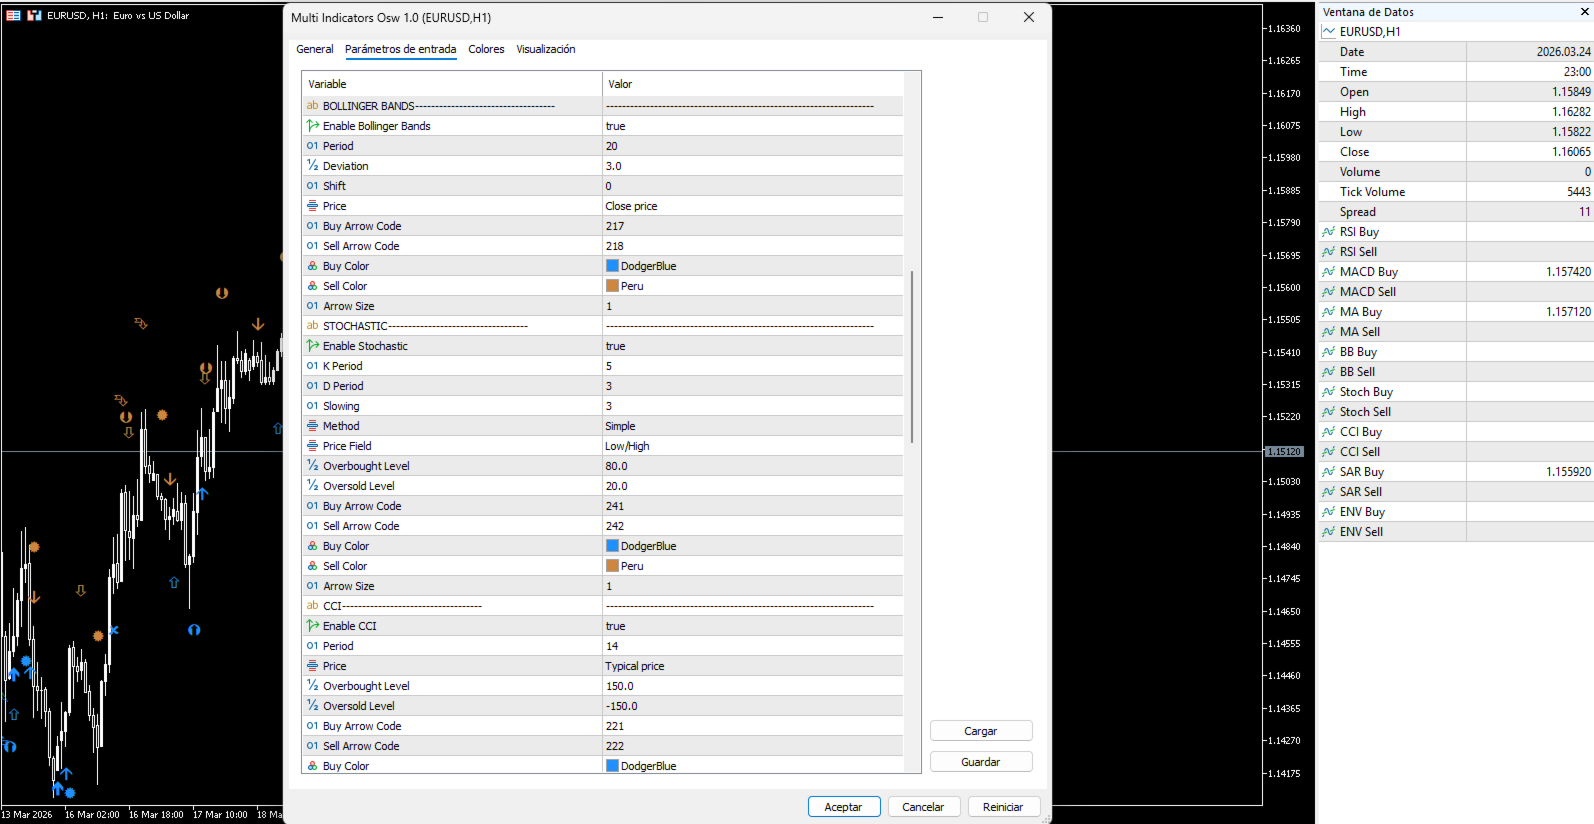
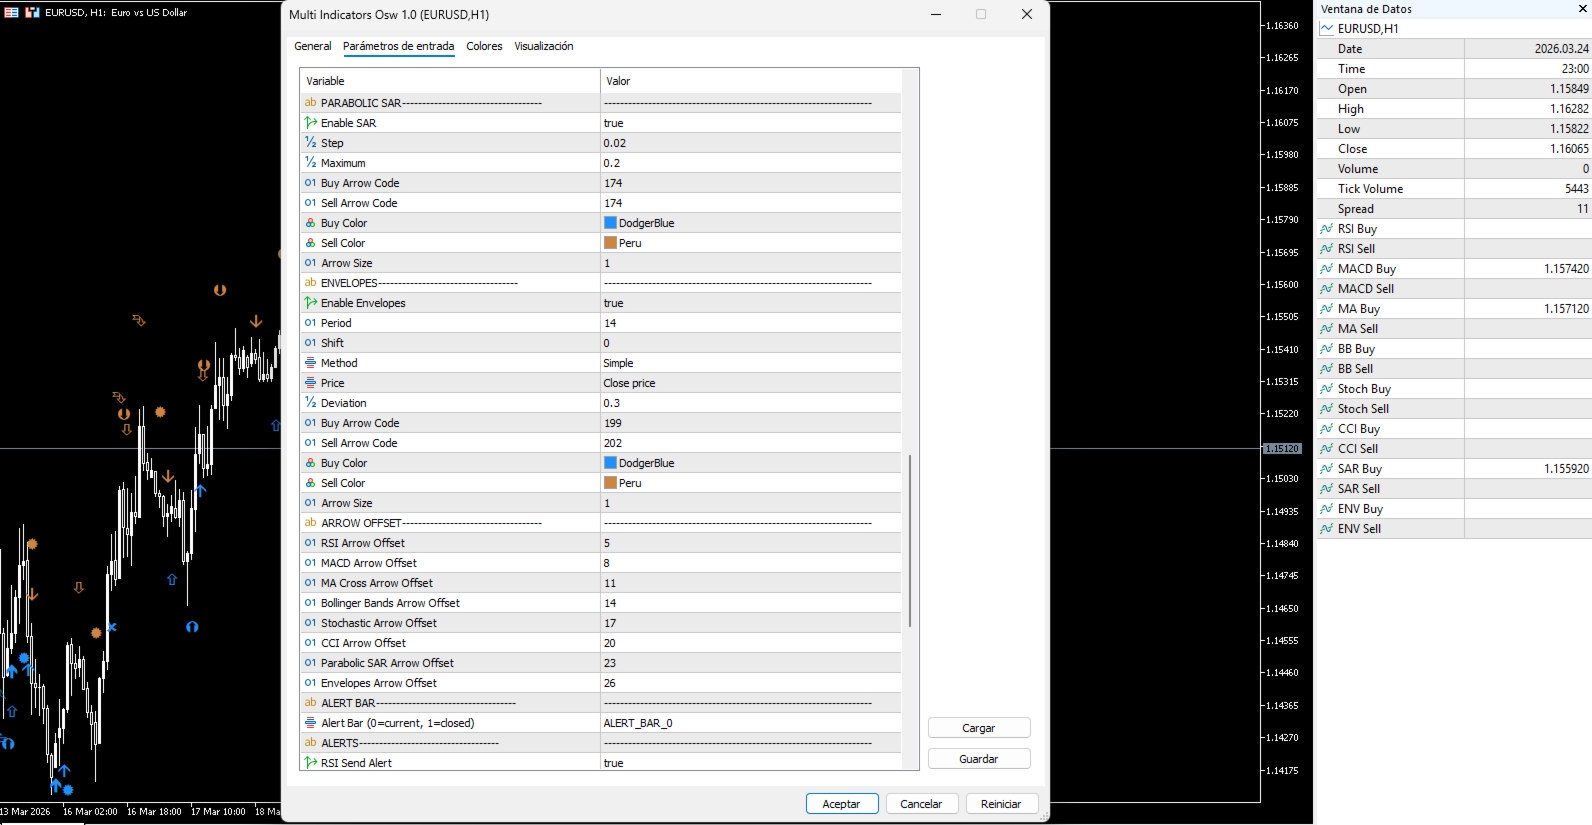
Enable [Indicator Name]: Activates or deactivates the visualization of signals and the calculation of the selected indicator.
Period / Fast EMA / Slow EMA: Adjusts time sensitivity to capture short or long market cycles.
Method / Price: Defines the calculation algorithm (Simple, Exponential, etc.) and the data source (Close, Open, Typical).
Overbought / Oversold Level: Critical overbought and oversold levels to identify trend reversals.
Deviation / Step / Maximum: Volatility and acceleration parameters for Bollinger Bands, Envelopes, and Parabolic SAR.
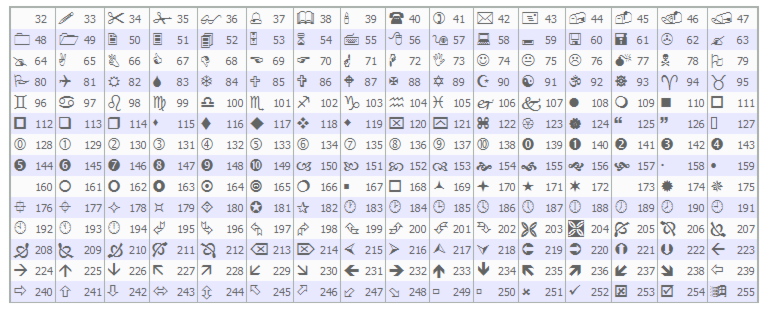
Buy/Sell Arrow Code: Allows customizing the visual icon (Wingdings code) for each signal on the chart.
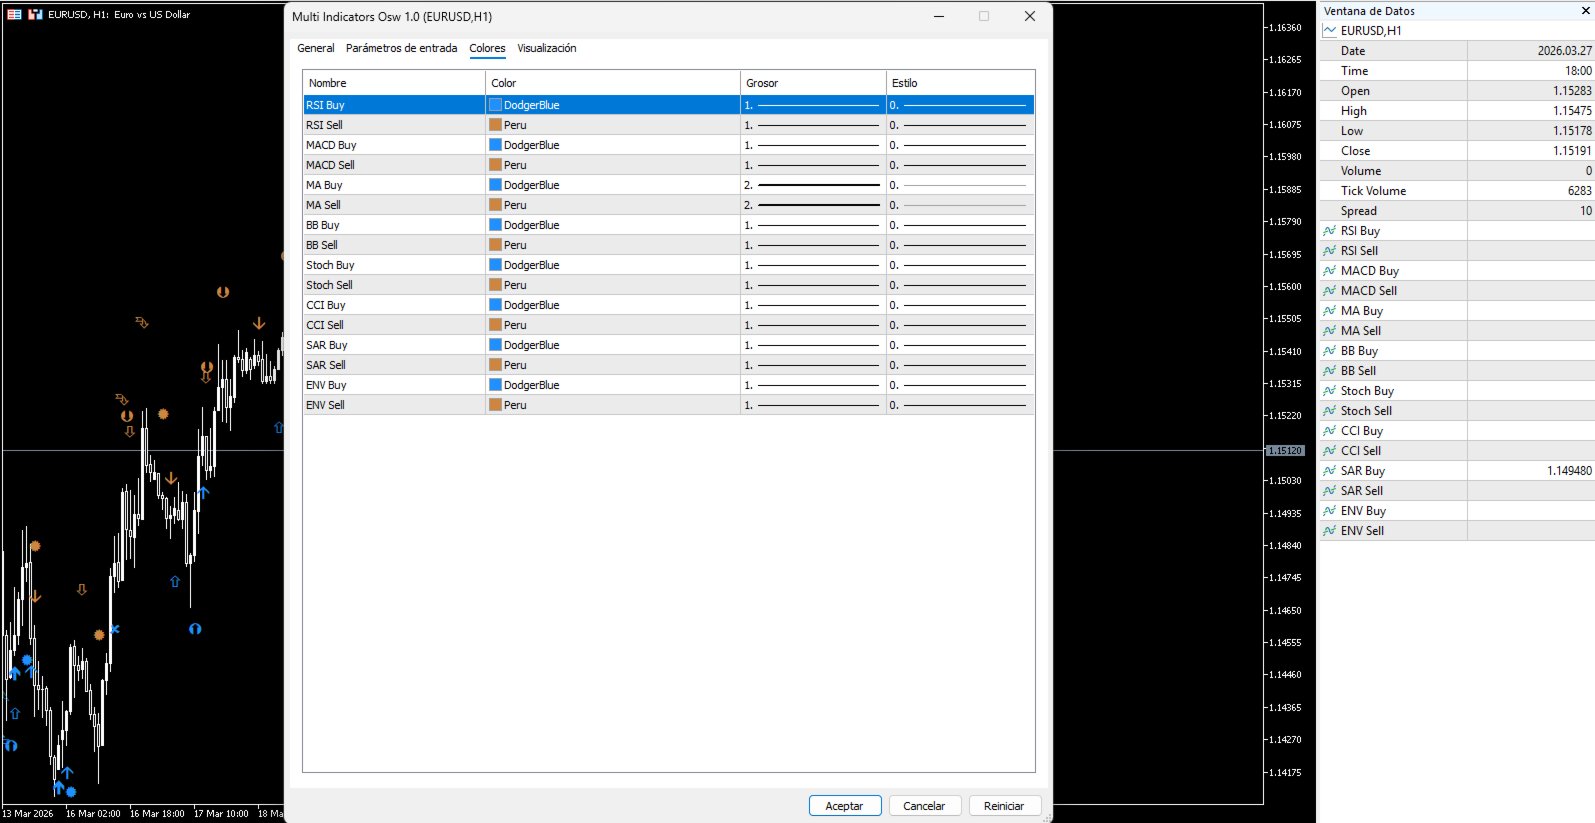
Buy/Sell Color & Arrow Size: Full aesthetic management to differentiate signals from multiple indicators.
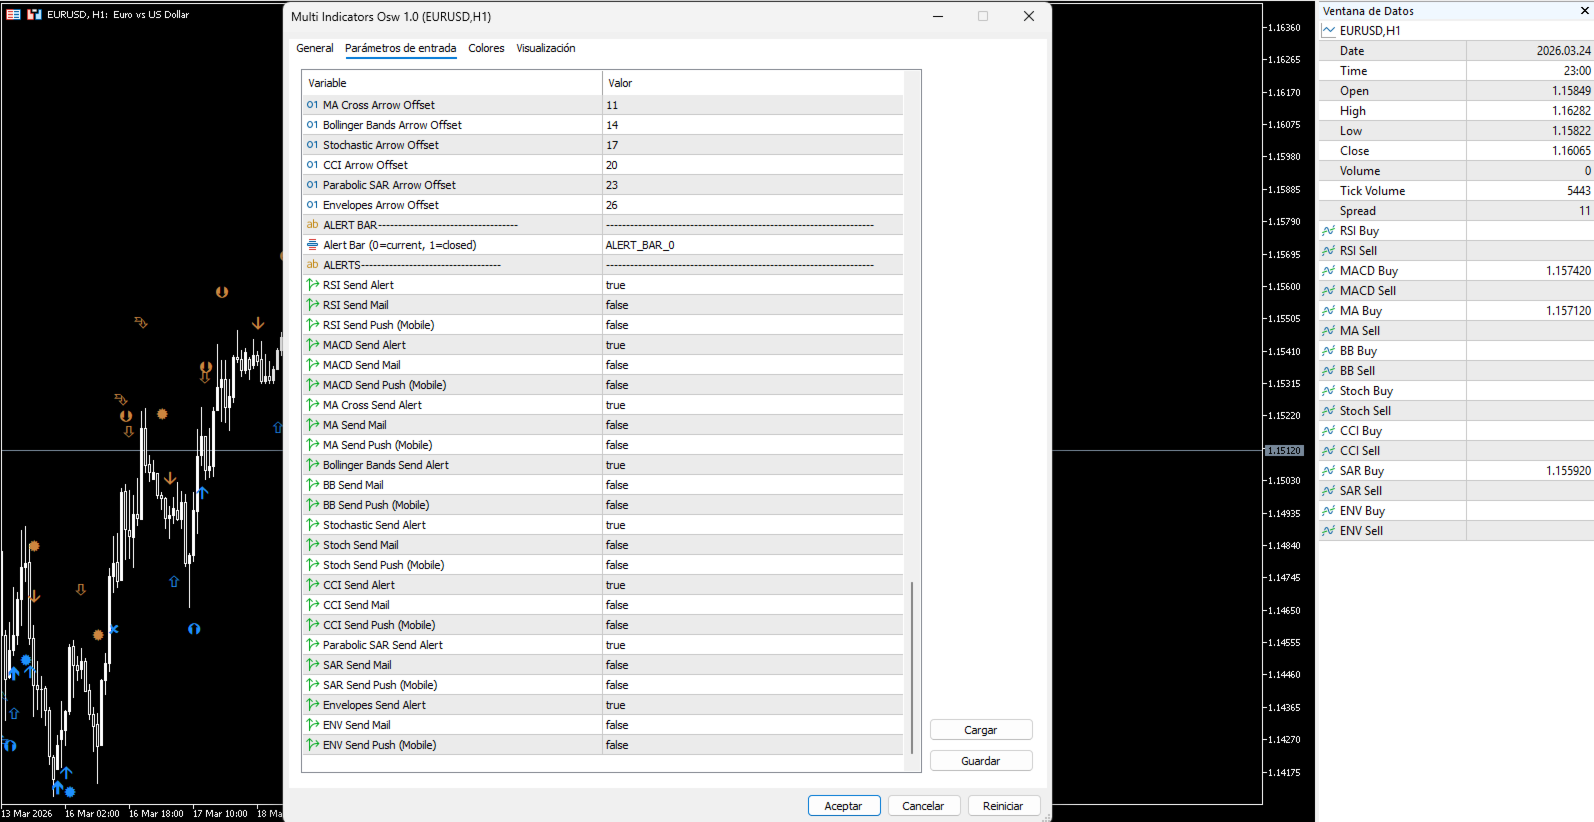
Arrow Offset: Vertical distance adjustment to prevent signals from overlapping with candles or each other.
Alert and Notification System
Alert Bar (0=current, 1=closed): Determines whether you will receive the notification instantly (forming candle) or after candle close confirmation (preferred for greater reliability).
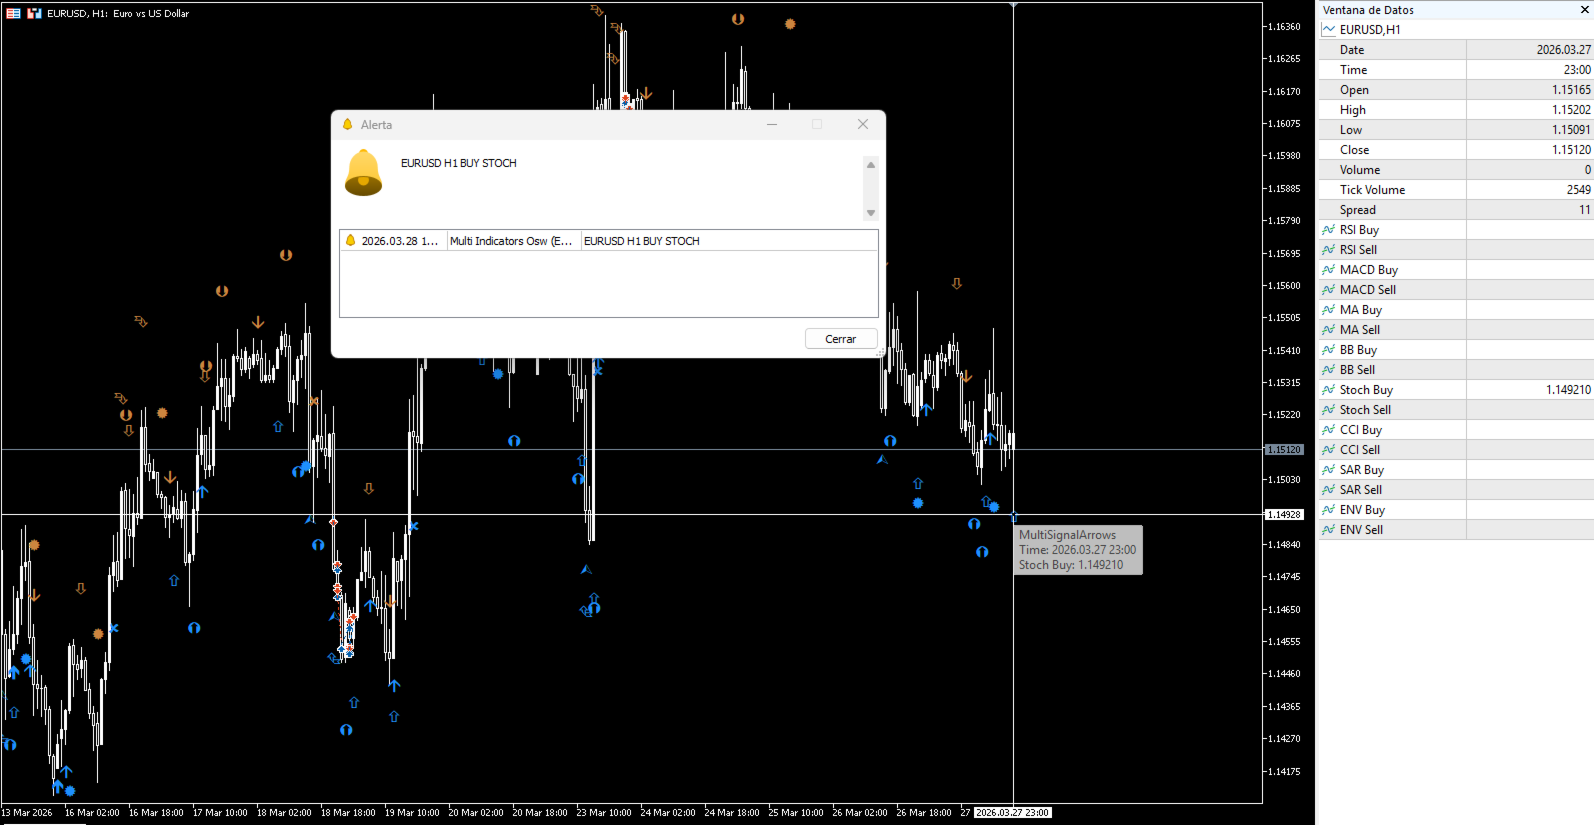
Send Alert: Activates sound alerts and pop-up windows on your PC.
Send Mail: Sends signal details directly to your configured email.
Send Push (Mobile): Instant notifications to your MetaTrader app on iOS or Android devices.
Visual Interpretation
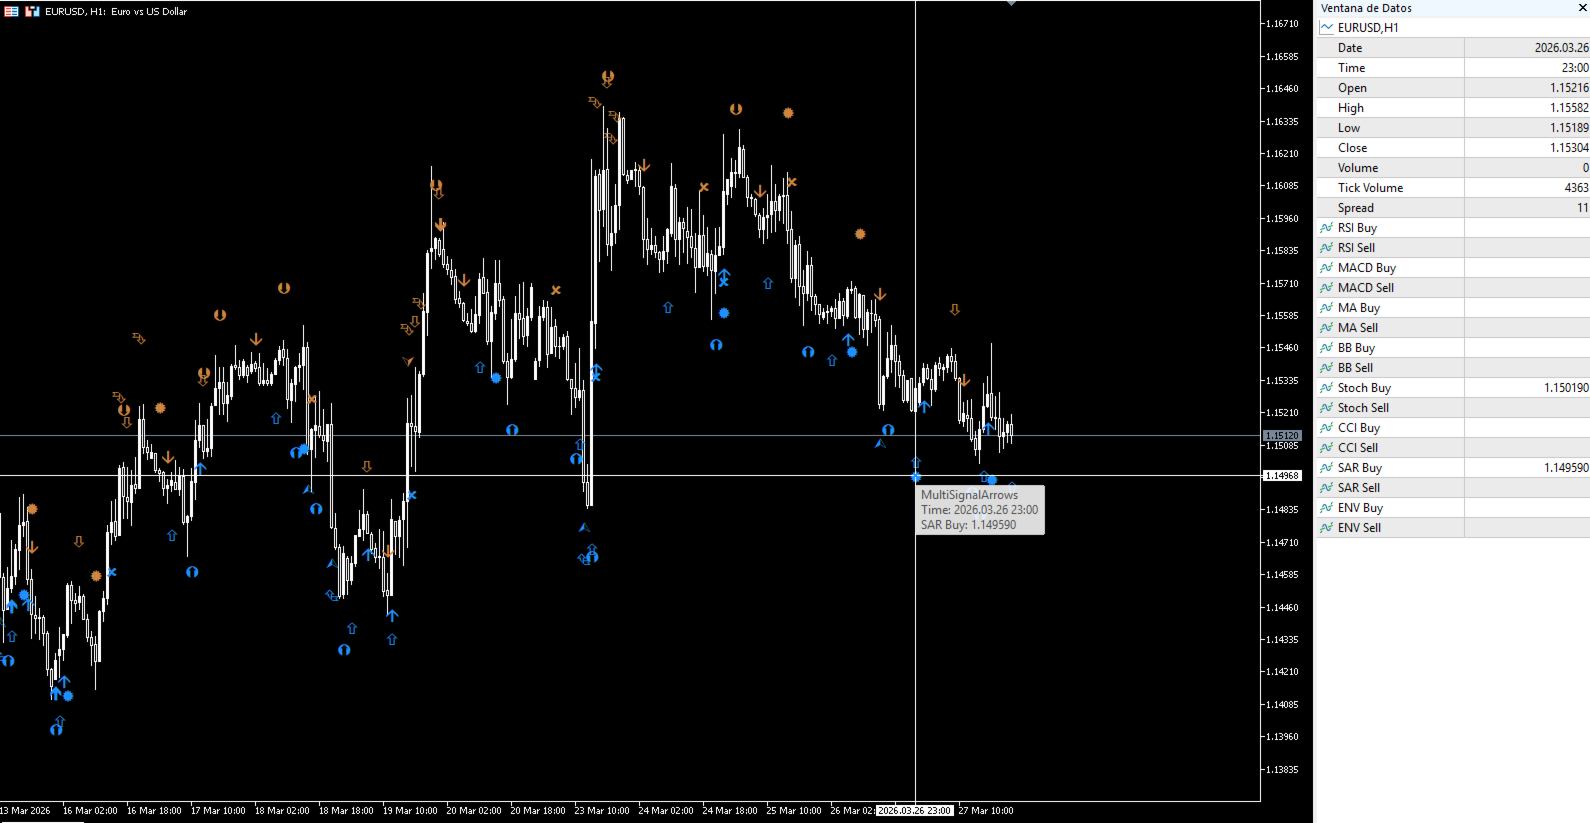
The indicator projects buy and sell arrows directly on the price. Thanks to its independent configuration, you can assign unique colors and symbols to each strategy. This allows you to identify at a glance if you are facing a Moving Average cross, a MACD divergence, or trend exhaustion detected by CCI or RSI. Its 16-buffer architecture makes it fully compatible with any third-party Expert Advisor requiring automatic signal reading.
Operation Guide
Buy Signals (Bullish): Appear below the price. Triggered by conditions such as bullish line crosses, exit from oversold zones, or bounces off lower bands.
Sell Signals (Bearish): Appear above the price. Generated after bearish crosses, exhaustion at overbought levels, or rejections at upper bands.
Confluence Strategy: The highest precision is obtained when two or more indicators (e.g., RSI + MACD) generate arrows in the same price zone.
Optimization and Recommendations
Timeframes: Highly effective on H1, H4, and Daily for tracking main trends, and on M5/M15 for scalping with volatility filters.
Assets: Suitable for Forex, Indices, Commodities, and Cryptocurrencies.
Risk Management: Always use signals as technical confirmation. It is recommended to trade in the direction of the trend detected by the included Parabolic SAR or Moving Averages.