JET Weis Waves PRO
- Indicators
-
JETINVEST
 Jet Invest develops indicators and trading tools for MetaTrader 4 and 5: Order Flow, Footprint, Volume Profile, market structure (SMC), sessions and market overview panels, for forex, metals, indices, crypto and futures of any exchange (CME, B3 and others).
- Version: 1.0
- Activations: 5
See how much volume each price wave needed, how far it went and how long it took, compared with the previous waves, right on your MetaTrader 5 price chart.
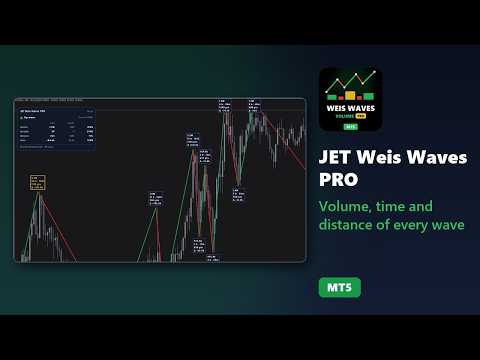
JET Weis Waves PRO draws the price waves over the candles: a green line for each up wave and a red line for each down wave, from one turning point to the next. The wave turns when price moves back by the reversal you set (in points, in % of price or in multiples of the ATR). At the end of each wave a label shows its volume, its duration in bars and in time, its distance and its delta (buying minus selling volume). The wave in progress is drawn dashed until the turn is confirmed.
Real or estimated, always shown. Where the broker sends the trades with the aggressor side (futures and stocks of any exchange, e.g. B3, CME and others), the indicator uses the real volume and the real delta: Real mode. Forex, CFDs and metals use the tick volume and an estimated delta, and the panel shows Estimated.
Confirmed waves never change. It is an indicator only: it never opens, closes or changes orders.
What you see
- Wave lines over the candles, green up and red down; the wave in progress dashed.
- A label at the end of each wave: volume in short form (12.4k, 1.2M), duration ("18 b · 1h30"), distance in points or ticks, and delta. Each item can be turned on or off.
- Highlights compared with the last 5 waves in the same direction (editable): biggest recent wave (gold border), abnormal volume (from 1.8 times the average, text in gold) and effort without result (volume from 1.5 times the average with a distance up to 0.6 times the average, orange border). All limits are inputs.
- When labels would cover one another, the newest wave keeps its label.
Panel
- Direction of the current wave and the price at which it turns ("Turns at").
- Current wave against the average of the previous waves in the same direction: volume, duration, distance and delta, with the % of each.
- Data mode (Real or Estimated) always visible; reversal in use and number of waves on the chart at the bottom.
- Draggable; light and dark themes (automatic from the chart background); size from 50% to 300%; 11 languages.
Settings
- Reversal in points (automatic for the symbol, editable), in % of price (0.3%) or by volatility (2.0 x ATR 14).
- Price used: high/low or close. Volume: automatic, real or tick volume. Bars of history: 1,000 (100 to 5,000).
- Delta from the last 10 days of ticks (editable; 0 turns it off). Older waves show "–".
- Colors of up waves, down waves, biggest wave and effort without result; font size.
Alerts on the confirmed wave
- New wave (turn confirmed), abnormal volume wave and effort without result, each with its own mode: popup, sound, push notification or a combination; e-mail optional.
- By default only the abnormal volume alert is on (popup + sound).
Data for Experts (iCustom)
- Buffer 0: direction of the wave that contains the bar (+1 up, -1 down)
- Buffer 1: volume of the wave so far, up to the bar
- Buffer 2: turn confirmed on this bar (+1 top, -1 bottom, 0 none)
- Buffer 3: volume of the last confirmed wave
- Buffer 4: distance of the last confirmed wave (in the distance unit chosen, points by default)
- Buffer 5: duration of the last confirmed wave, in bars
- Buffer 6: delta of the last confirmed wave (empty without ticks)
- Buffer 7: marks of the last confirmed wave: 1 biggest recent, 2 abnormal volume, 4 effort without result (sum; e.g. 3 = biggest and abnormal)
- Buffer 8: data mode (1 real, 2 estimated)
- Confirmed waves never change. Buffers 0 and 1 of the bar in progress change while the wave forms; the buffers of closed bars do not change.
Works on any symbol
- Futures and stocks of any exchange (e.g. B3, CME and others) with real volume and real delta; forex, CFDs and metals with tick volume and estimated delta.
- Any timeframe up to D1. Tested in the Strategy Tester on WIN and EURUSD.
With the free Weis Waves RSJ
JET Weis Waves PRO draws on the price chart. If you also want the classic histogram, add the free Weis Waves RSJ to the same chart: it shows the volume of each wave in a subwindow below the candles.
Weis Waves RSJ: free wave volume histogram
Trading involves risk of loss. Weis waves show what was traded in the past; they do not forecast prices. In estimated mode, the volume is the tick volume and the delta is an estimate. The indicator does not guarantee results.
Full manual: https://www.mql5.com/en/blogs/post/780626