Price Volume Distribution MT5
- Indicators
-
Ich Khiem Nguyen
 🔥 ALPHA — ACCOMPANYING TRADERS
Focusing on trading methodology based on:
💧 Liquidity & Market Structure
📊 Analysis & Trading Plans
🎯 Real-Time Trading Signals
🛠 Trading Support Tools
👤 Support for New Traders
━━━━━━━━━━━━━━━━━━
🟢 FREE SIGNAL — REAL TIME - Version: 1.11
- Updated: 20 February 2026
- Activations: 5
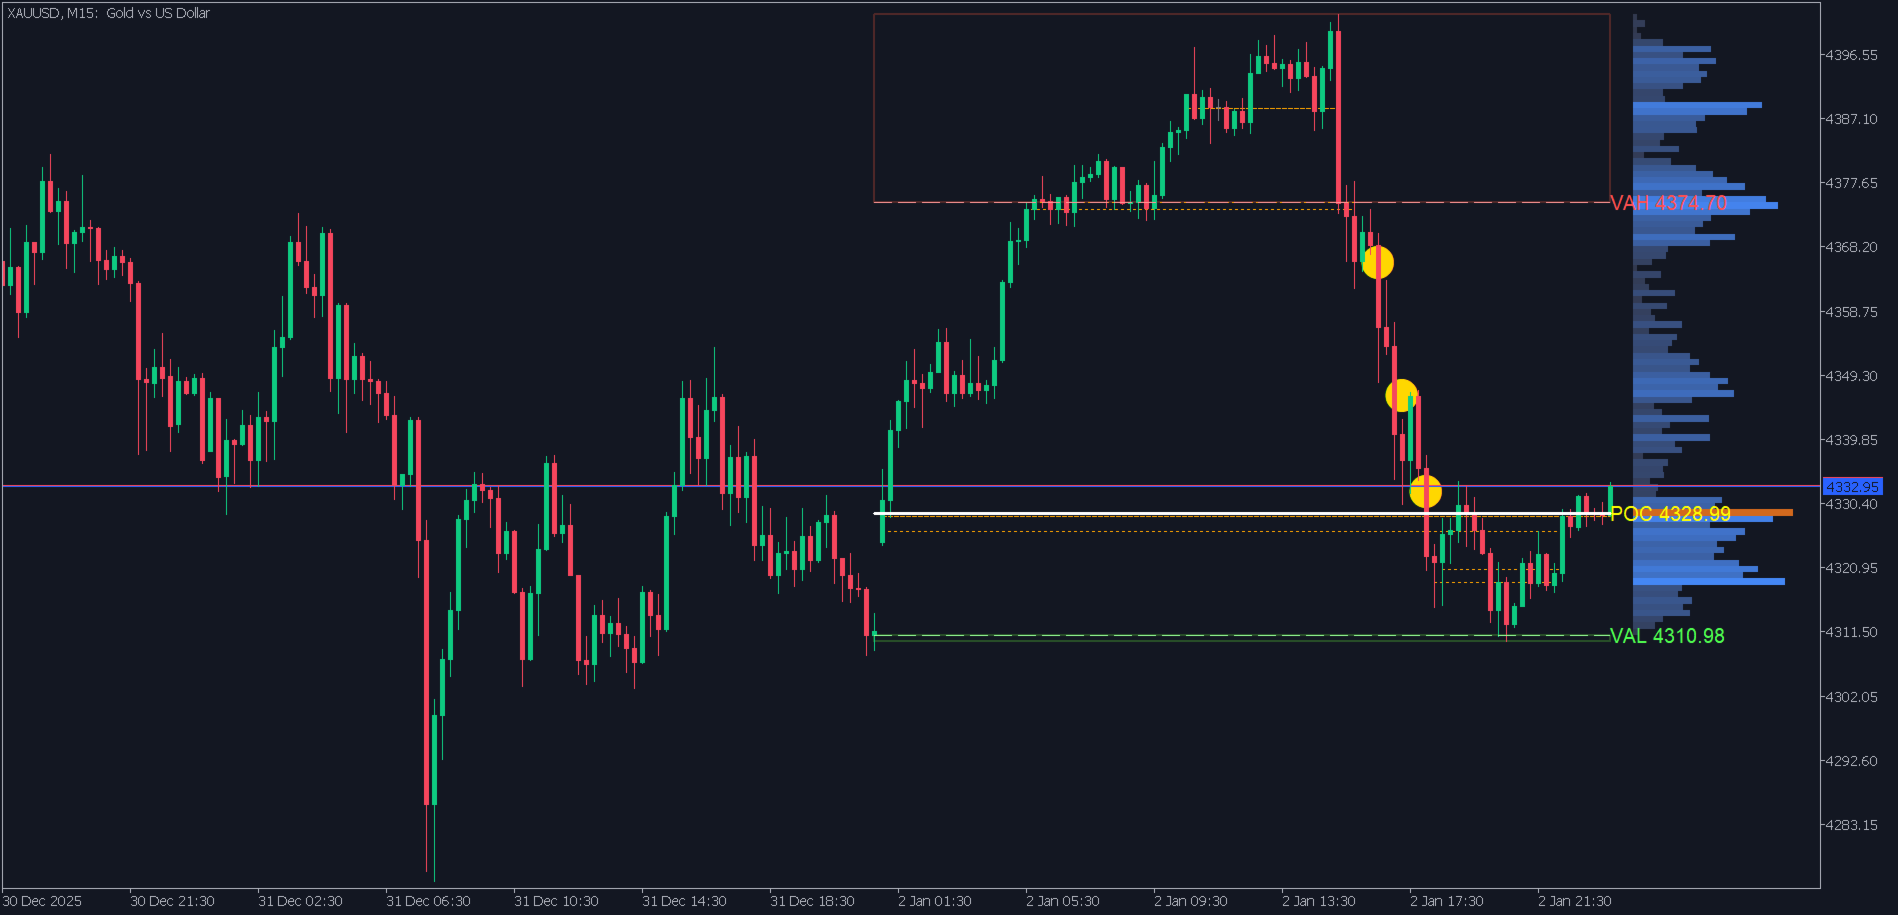
Volume Profile indicator that analyzes trading volume distribution by price level. Displays POC, Value Area, volume spikes, and zone-based signal filtering for MT5.
Bonus indicator included for early Mirage Trading System owners. Please confirm via MQL5 message to receive your gift . Note: Each user is eligible for a maximum of one gift to ensure fair distribution.
Price Volume Distribution is a volume analysis indicator for MetaTrader 5. It calculates and displays volume distribution across price levels using M1 timeframe data, providing visual representation through histogram bars and reference lines.
Key Functionality
The indicator identifies:
- Point of Control (POC): The price level with highest traded volume
- Value Area High/Low (VAH/VAL): Price range containing 70% of volume
- Volume spikes: Price levels with unusually high volume activity
- Support and resistance zones based on volume concentration
Profile Modes
Three calculation modes are available:
1. Session Mode: Analyzes volume within daily (D1) bar boundaries
2. Fixed Range Mode: Calculates volume between user-specified start and end times
3. Visible Range Mode: Updates dynamically based on visible chart area
Session Templates
Pre-configured time ranges for common trading sessions:
- D1: Full day analysis (00:00-23:59 GMT)
- London Session: 08:00-16:30 GMT
- New York Session: 13:30-22:00 GMT
- Asian Session: 22:00-08:00 GMT
- Custom: User-defined time range
Visualization Components
Histogram Display:
- Color-gradient volume bars (24 to 500 configurable bins)
- Adjustable width and position offset
- POC marked with vertical white line
- VAH/VAL marked with horizontal lines
Zone Classification:
- Resistance zone (upper): Dark red rectangle
- Value area (middle): Blue rectangle
- Support zone (lower): Dark green rectangle
Volume Spikes:
- Gold markers at price levels exceeding volume threshold
- Configurable sensitivity (1.0x to 10.0x average volume)
- Separate timeframe selection for spike detection
Signal Filtering
The indicator includes zone-based filtering logic:
- Identifies when price is in resistance, value, or support zones
- Returns boolean values for buy/sell zone validation
- Can be integrated with Expert Advisors via iCustom() function
Configuration Options
Profile Settings:
- Number of histogram rows (bins)
- Value Area percentage (50-95%)
- Volume source selection (tick volume, real volume, or auto-detect)
Visual Settings:
- Toggle histogram, zones, and spike displays independently
- Customize colors for all visual elements
- Adjust histogram width and offset
Performance:
- Uses object pooling to minimize resource allocation
- M1 data buffer limited to 1500 bars (approximately 25 hours)
- Per-bar processing to reduce CPU usage
Expert Advisor Integration
The indicator can be accessed from EAs using iCustom():
int handle = iCustom(_Symbol, _Period, "VolumeProfile");
Signal filter methods check current price position relative to zones.
Technical Requirements
- MetaTrader 5 build 3802 or higher
- M1 historical data for accurate calculations
- Minimum 1500 M1 bars recommended
Important Notes
This is a technical analysis tool. It displays historical volume distribution and does not predict future price movements. Volume Profile analysis is one method among many for market structure evaluation. Users should combine this tool with their own analysis and risk management strategy.
The indicator requires M1 data from your broker. If M1 history is unavailable for your symbol, calculations may be incomplete until data synchronizes.
Support
For technical questions or feature requests, contact via MQL5 profile message.