Objects Styler
- Utilities
- Version: 3.1
- Updated: 17 August 2026

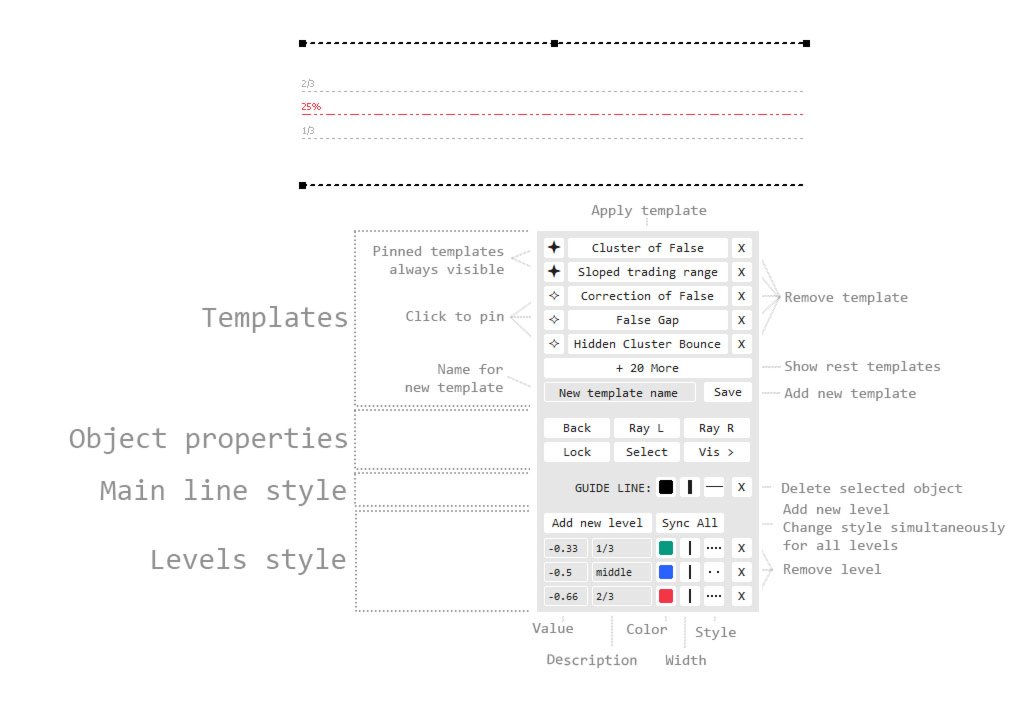
Objects Styler is a utility that provides a context-sensitive panel for editing the properties of standard graphical objects directly on the chart. Its key feature is a powerful template system that allows users to save, manage, and instantly apply complex sets of styles to objects.
Core Features
Interface and Interaction
-
Contextual Activation: The panel is invoked by clicking (or Shift + clicking) a graphical object. It supports all standard objects and most of their properties.
-
Draggable Interface: The panel can be freely moved to any area of the chart.
-
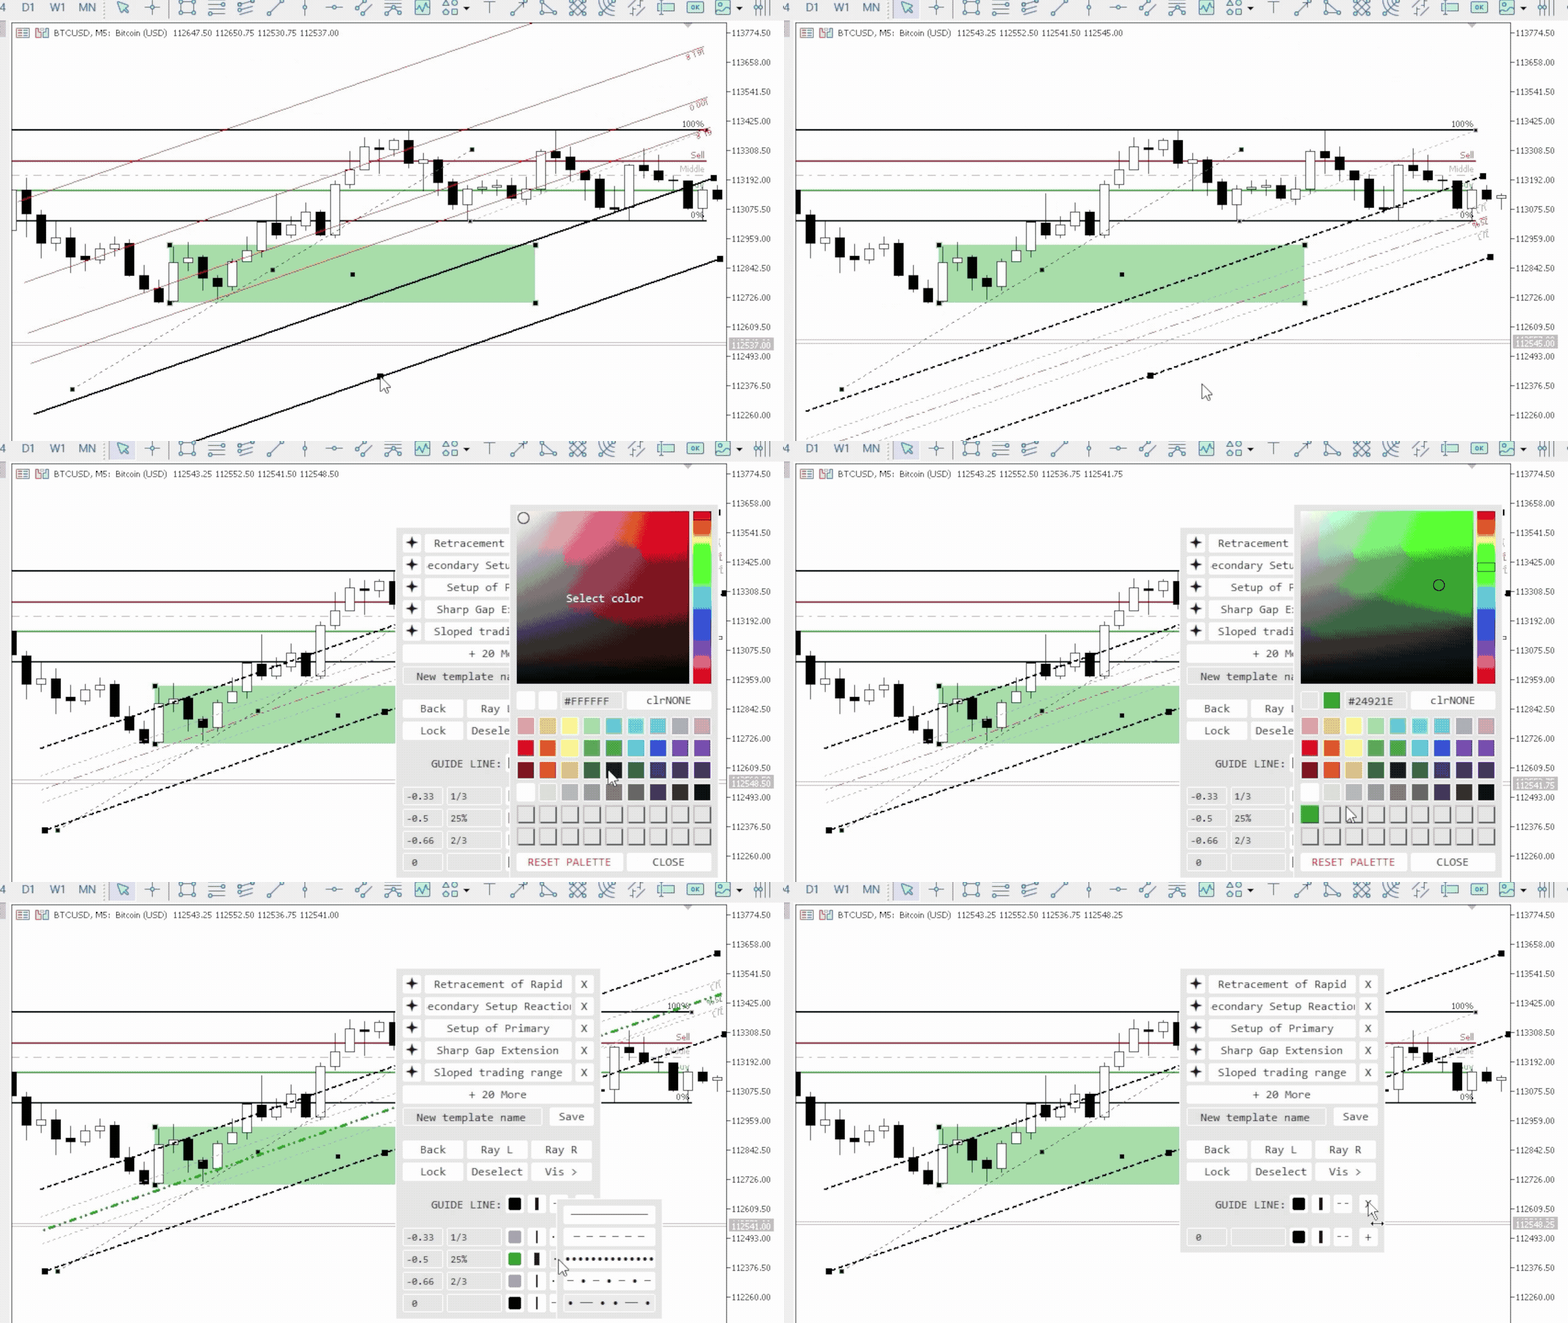
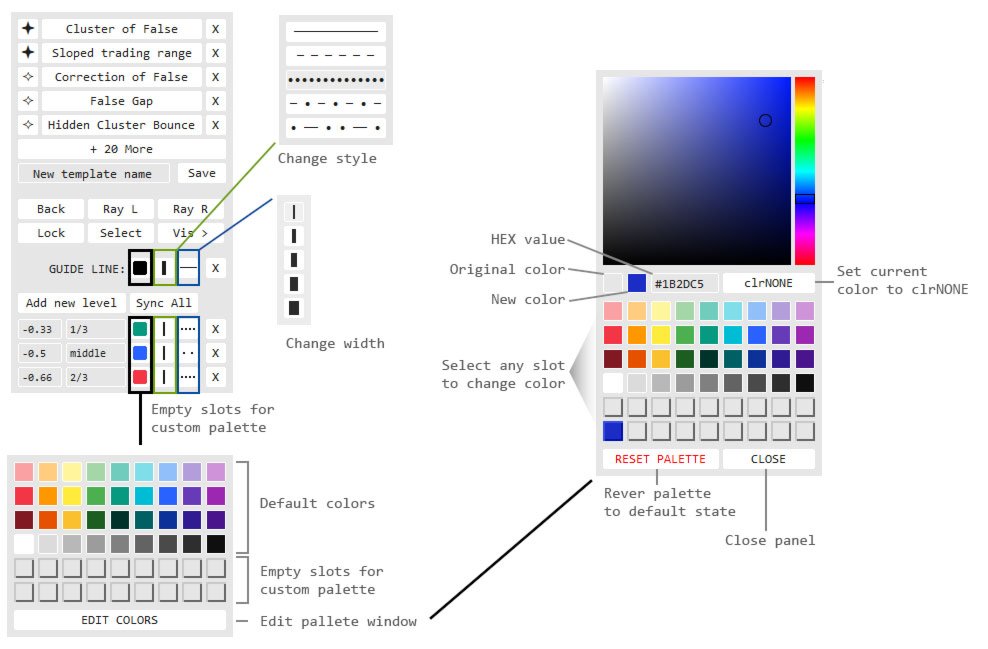
Pop-up Windows: Additional options, such as style selection, the color palette, and the timeframe list, open in compact pop-up windows, keeping the main interface uncluttered.
Template Management System
-
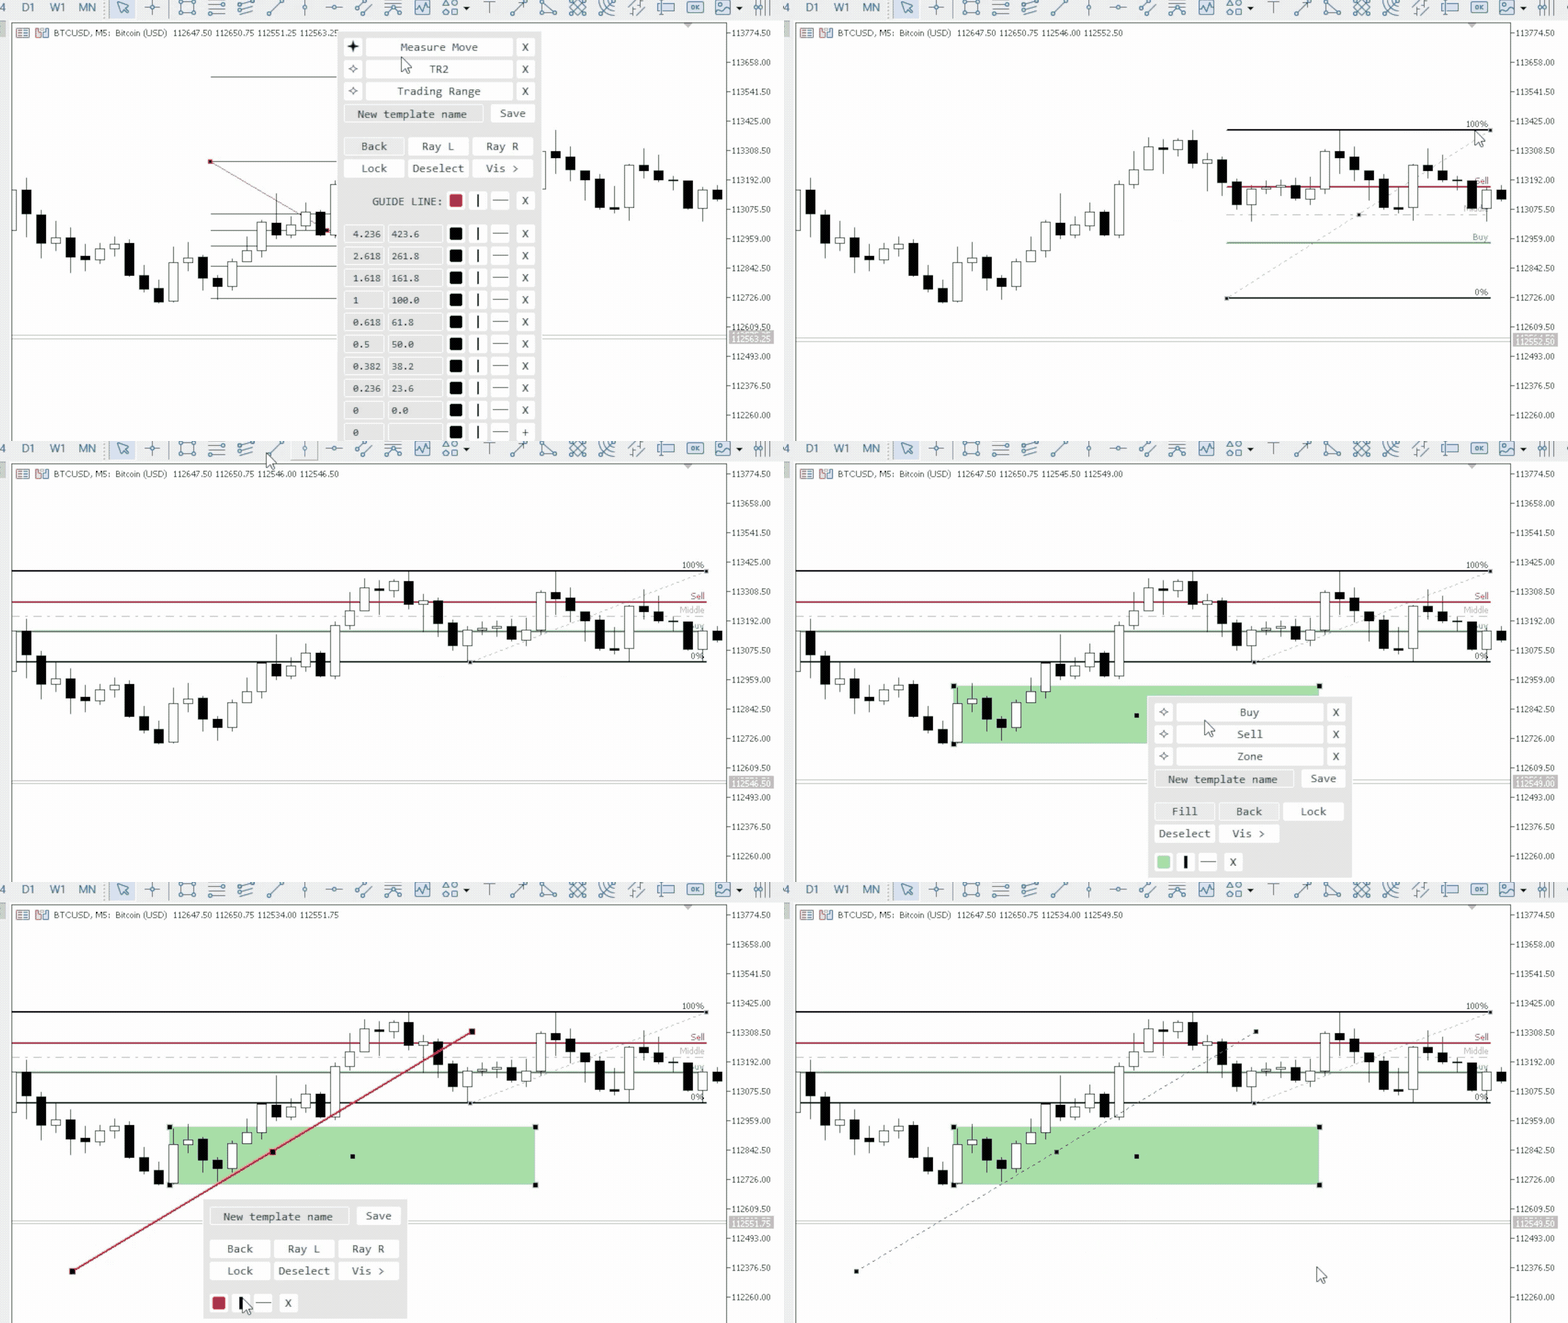
Save and Apply Styles: Save a complete set of an object's properties as a named template. Templates are applied with a single click.
-
Object-Type Specific: Templates are saved for a specific object type. For example, styles created for a trendline will only be available when editing other trendlines.
-
Favorites (Pinning): Frequently used templates can be pinned for quick access. They will always be visible, while others are hidden in an additional window.
-
Synchronization and Portability:
-
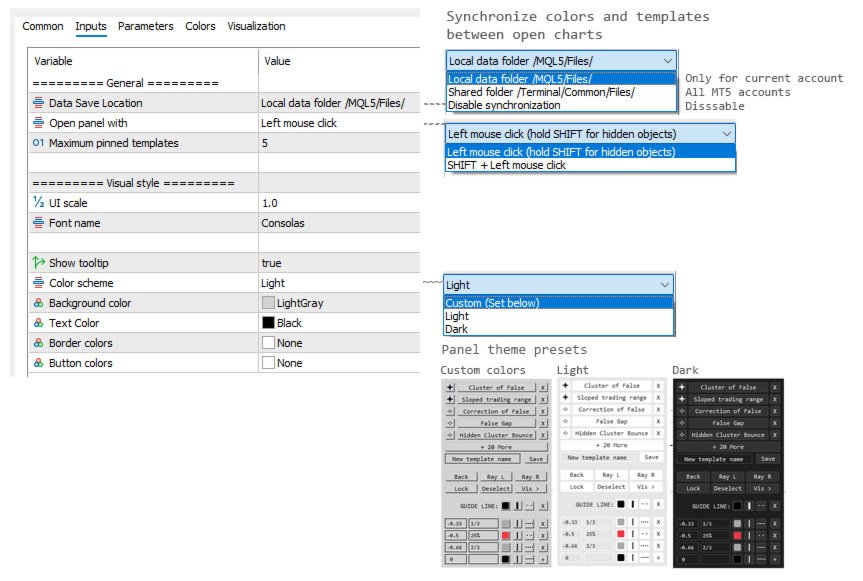
Changes to templates and the color palette can be automatically synchronized across all instances of the indicator on other charts.
-
Settings files are saved separately, allowing for easy transfer to other computers or different terminals.
-
Object Property Control
-
General Properties: Direct access to edit color, width, and line style. Also provides control over most standard parameters: fill, draw in background, rays, icons, text, etc.
-
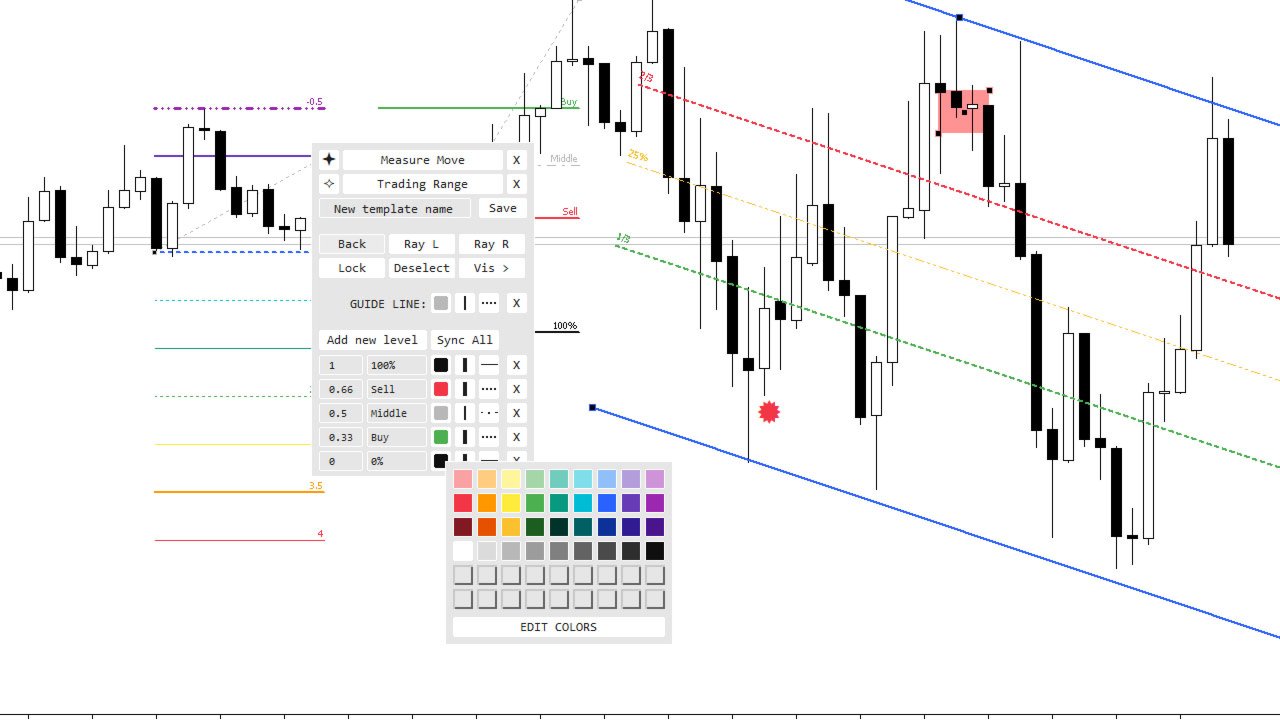
Multi-Level Object Editing (for Fibonacci tools, channels, expansions, etc.):
-
Individual control over the value, text description, color, width, and line style for each level.
-
Functionality to add and remove levels.
-
Color Palette
-
54 slots for quick color access.
-
Visual Editor (HSV Picker) for precise color adjustment.
-
Ability to modify and save any color in the palette.
Indicator Settings
-
Interface Scaling: An input parameter to adapt the panel's size to your screen resolution.
-
Activation Method: Choose how to invoke the panel in the settings (a simple click or a Shift + click).
-
Color Schemes: Pre-installed light and dark themes, plus the option to set fully custom colors.
-
Synchronization Mode: Option to choose where to store settings files: locally for each chart or in the terminal's common folder for automatic synchronization.
In the future, additional properties and support for new objects may be added based on user requests.











































Это лучшее что я видел для mt5! Выражаю огромную благодарность!!! Автор ЛУЧШИЙ!!! P.S. Было бы прикольно если добавить в меню отрезка выравнивание по горизонтали отрезка. Мне ИИ написал в виде кнопки на графике: //+------------------------------------------------------------------+
//| Line_Leveler_Button.mq5 |
//| AI Code Generator |
//+------------------------------------------------------------------+
#property copyright "AI"
#property version "1.00"
#property indicator_chart_window
#property indicator_buffers 0
#property indicator_plots 0
//--- Входные параметры кнопки
input string InpButtonText = "Сделать горизонтальной"; // Текст на кнопке
input color InpButtonColor = clrWhite; // Цвет текста
input color InpBgColor = clrDarkSlateGray; // Цвет кнопки
input int InpFontSize = 10; // Размер шрифта
input int InpButtonWidth = 160; // Ширина кнопки
input int InpButtonHeight = 25; // Высота кнопки
//--- Имя объекта кнопки
string ButtonName = "Btn_Leveler_Line";
//+------------------------------------------------------------------+
//| Custom indicator initialization function |
//+------------------------------------------------------------------+
int OnInit()
{
// Создаем кнопку в левом верхнем углу графика
if(ObjectCreate(0, ButtonName, OBJ_BUTTON, 0, 0, 0))
{
ObjectSetInteger(0, ButtonName, OBJPROP_XDISTANCE, 15); // Отступ по оси X
ObjectSetInteger(0, ButtonName, OBJPROP_YDISTANCE, 120); // Отступ по оси Y (под имя инструмента)
ObjectSetInteger(0, ButtonName, OBJPROP_XSIZE, InpButtonWidth);
ObjectSetInteger(0, ButtonName, OBJPROP_YSIZE, InpButtonHeight);
ObjectSetInteger(0, ButtonName, OBJPROP_CORNER, CORNER_LEFT_UPPER); // Привязка к верхнему левому углу
ObjectSetString(0, ButtonName, OBJPROP_TEXT, InpButtonText);
ObjectSetString(0, ButtonName, OBJPROP_FONT, "Arial");
ObjectSetInteger(0, ButtonName, OBJPROP_FONTSIZE, InpFontSize);
ObjectSetInteger(0, ButtonName, OBJPROP_COLOR, InpButtonColor);
ObjectSetInteger(0, ButtonName, OBJPROP_BGCOLOR, InpBgColor);
ObjectSetInteger(0, ButtonName, OBJPROP_BORDER_COLOR, clrSilver);
ObjectSetInteger(0, ButtonName, OBJPROP_SELECTABLE, false);
ObjectSetInteger(0, ButtonName, OBJPROP_STATE, false); // Отжата по умолчанию
}
// Разрешаем индикатору ловить клики мыши по графику
ChartSetInteger(0, CHART_EVENT_OBJECT_CREATE, true);
return(INIT_SUCCEEDED);
}
//+------------------------------------------------------------------+
//| Custom indicator deinitialization function |
//+------------------------------------------------------------------+
void OnDeinit(const int reason)
{
// Удаляем кнопку при удалении индикатора
ObjectDelete(0, ButtonName);
ChartRedraw(0);
}
//+------------------------------------------------------------------+
//| OnCalculate (обязательная функция для индикаторов) |
//+------------------------------------------------------------------+
int OnCalculate(const int rates_total,
const int prev_calculated,
const datetime &time[],
const double &open[],
const double &high[],
const double &low[],
const double &close[],
const long &tick_volume[],
const long &volume[],
const int &spread[])
{
return(rates_total);
}
//+------------------------------------------------------------------+
//| ChartEvent function - перехват событий мыши и кликов |
//+------------------------------------------------------------------+
void OnChartEvent(const int id,
const long &lparam,
const double &dparam,
const string &sparam)
{
// Проверяем, произошел ли клик по графическому объекту
if(id == CHARTEVENT_OBJECT_CLICK)
{
// Проверяем, что кликнули именно по нашей кнопке
if(sparam == ButtonName)
{
bool leveled_any = false;
// Перебираем все графические объекты, которые сейчас есть на графике
int total_objects = ObjectsTotal(0, 0, -1);
for(int i = 0; i < total_objects; i++)
{
string obj_name = ObjectName(0, i, 0, -1);
// Нам нужны только те линии, которые выделил (выбрал двойным кликом) трейдер
if(ObjectGetInteger(0, obj_name, OBJPROP_SELECTED) == true)
{
// Проверяем тип объекта. Нам нужны обычные трендовые линии (OBJ_TREND)
if(ObjectGetInteger(0, obj_name, OBJPROP_TYPE) == OBJ_TREND)
{
// Берем цену первой точки линии
double price1 = ObjectGetDouble(0, obj_name, OBJPROP_PRICE, 0);
// Принудительно присваиваем второй точке точно такую же цену
ObjectSetDouble(0, obj_name, OBJPROP_PRICE, 1, price1);
leveled_any = true;
}
}
}
// Если выровняли линию, выводим сообщение в журнал
if(leveled_any)
{
Print("Успешно: Выделенные трендовые линии выровнены горизонтально.");
}
// Возвращаем кнопку в отжатое (активное) состояние для следующего раза
ObjectSetInteger(0, ButtonName, OBJPROP_STATE, false);
ChartRedraw(0);
}
}
}
Извини! Пользовался старой версией. После обновления увидел кнопку выравнивания. Спасибо тебе большое! Ты ЛУЧШИЙ!!! Успехов тебе и вдохновения!