FraMA Oscillator AM

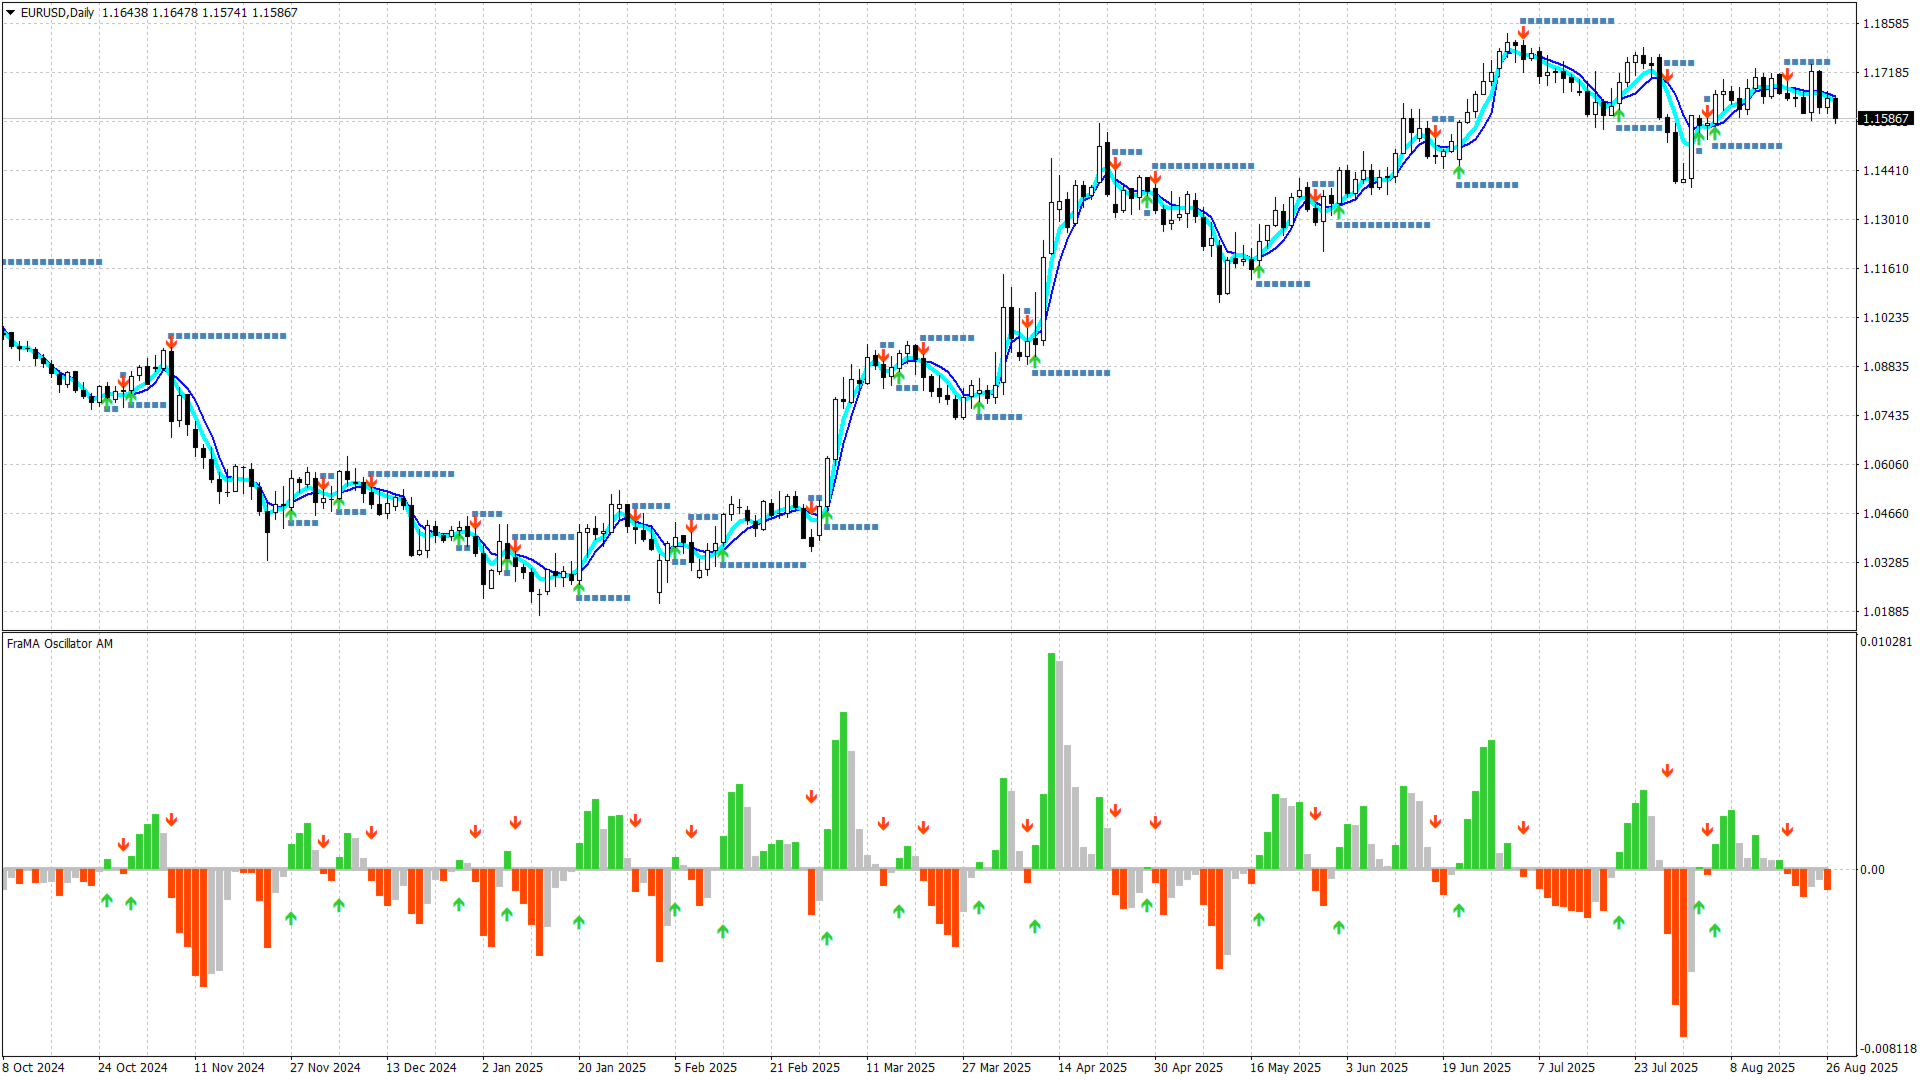
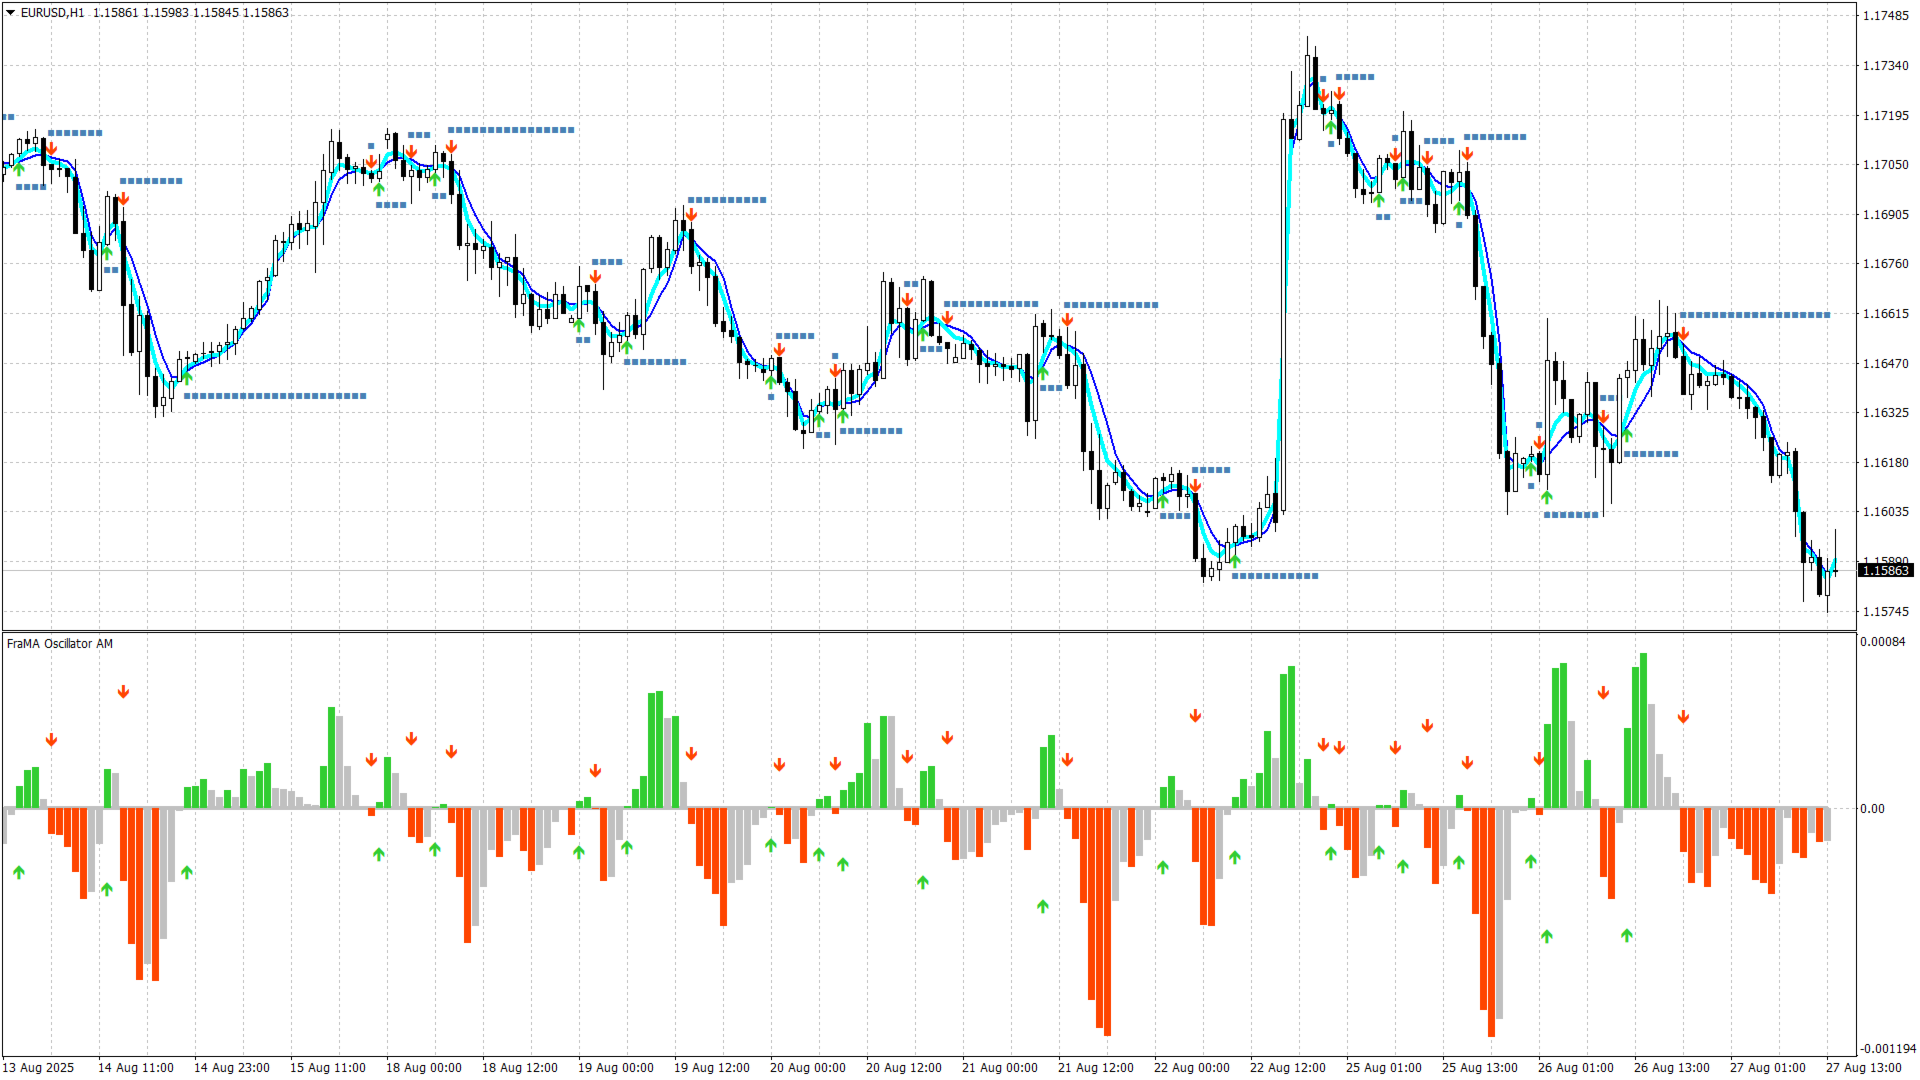
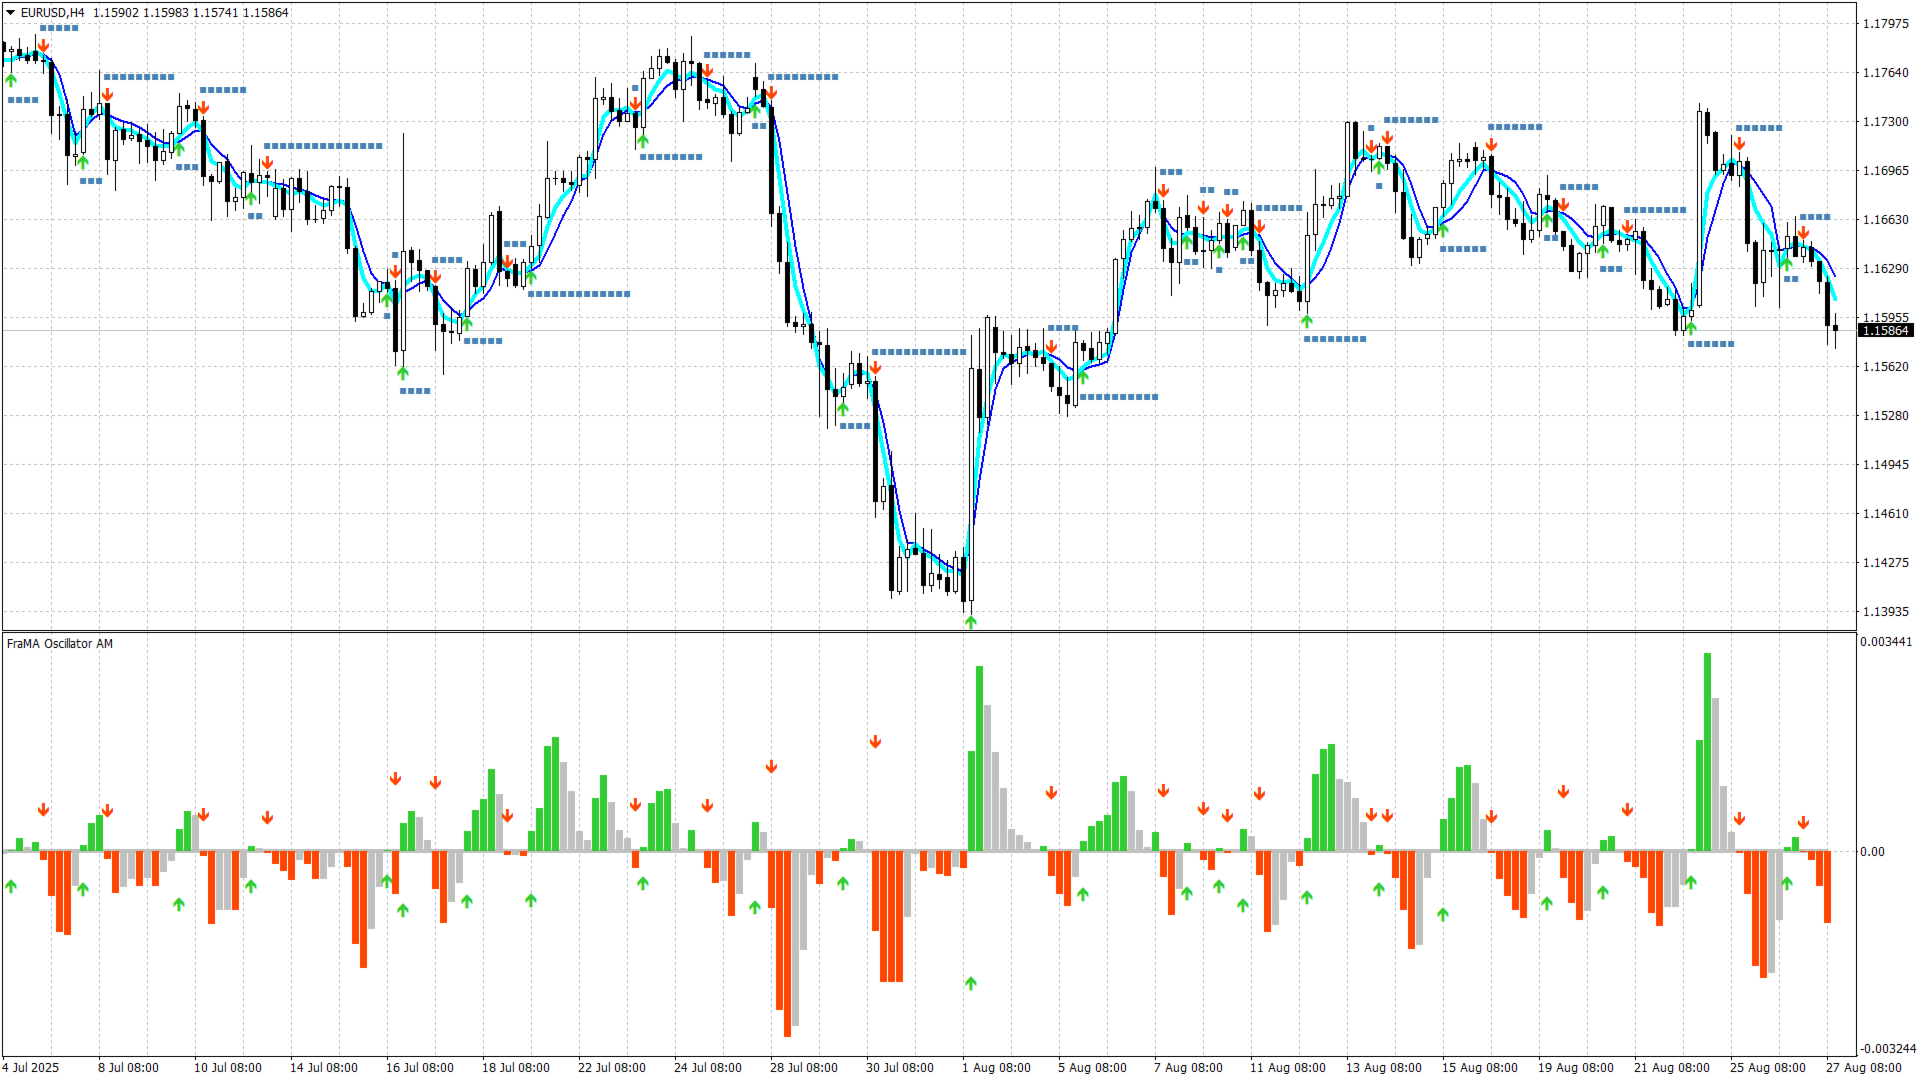
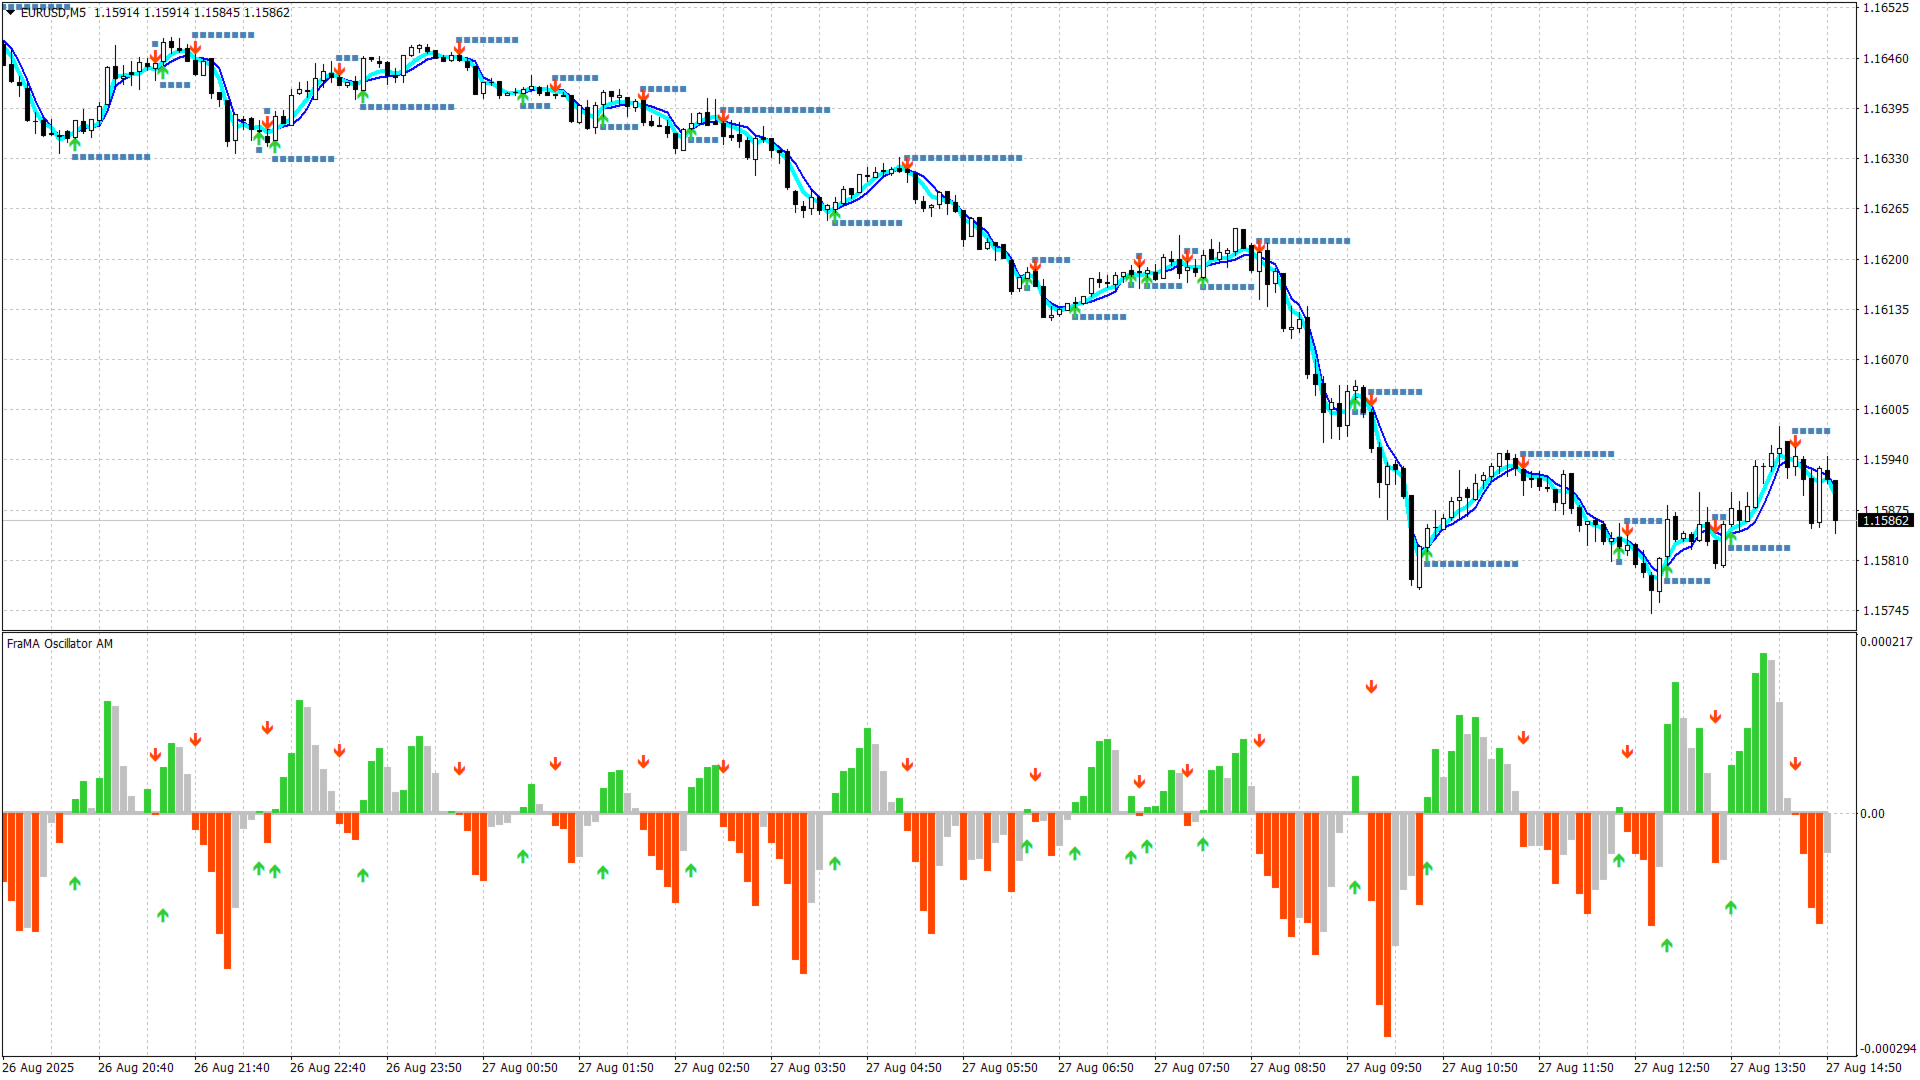
Technically, the indicator represents the difference between two fractal adaptive moving averages.

Fractal Adaptive Moving Average (FraMA) is a smart adaptive moving average developed by John Ehlers.

FraMA takes price changes into account and closely follows the price level, remaining straight during price fluctuations.

FraMA takes advantage of the fact that markets are fractal and dynamically adjusts the lookback period based on this fractal geometry.

The indicator has the ability to send notifications to the terminal and email.


Recommendations for use:

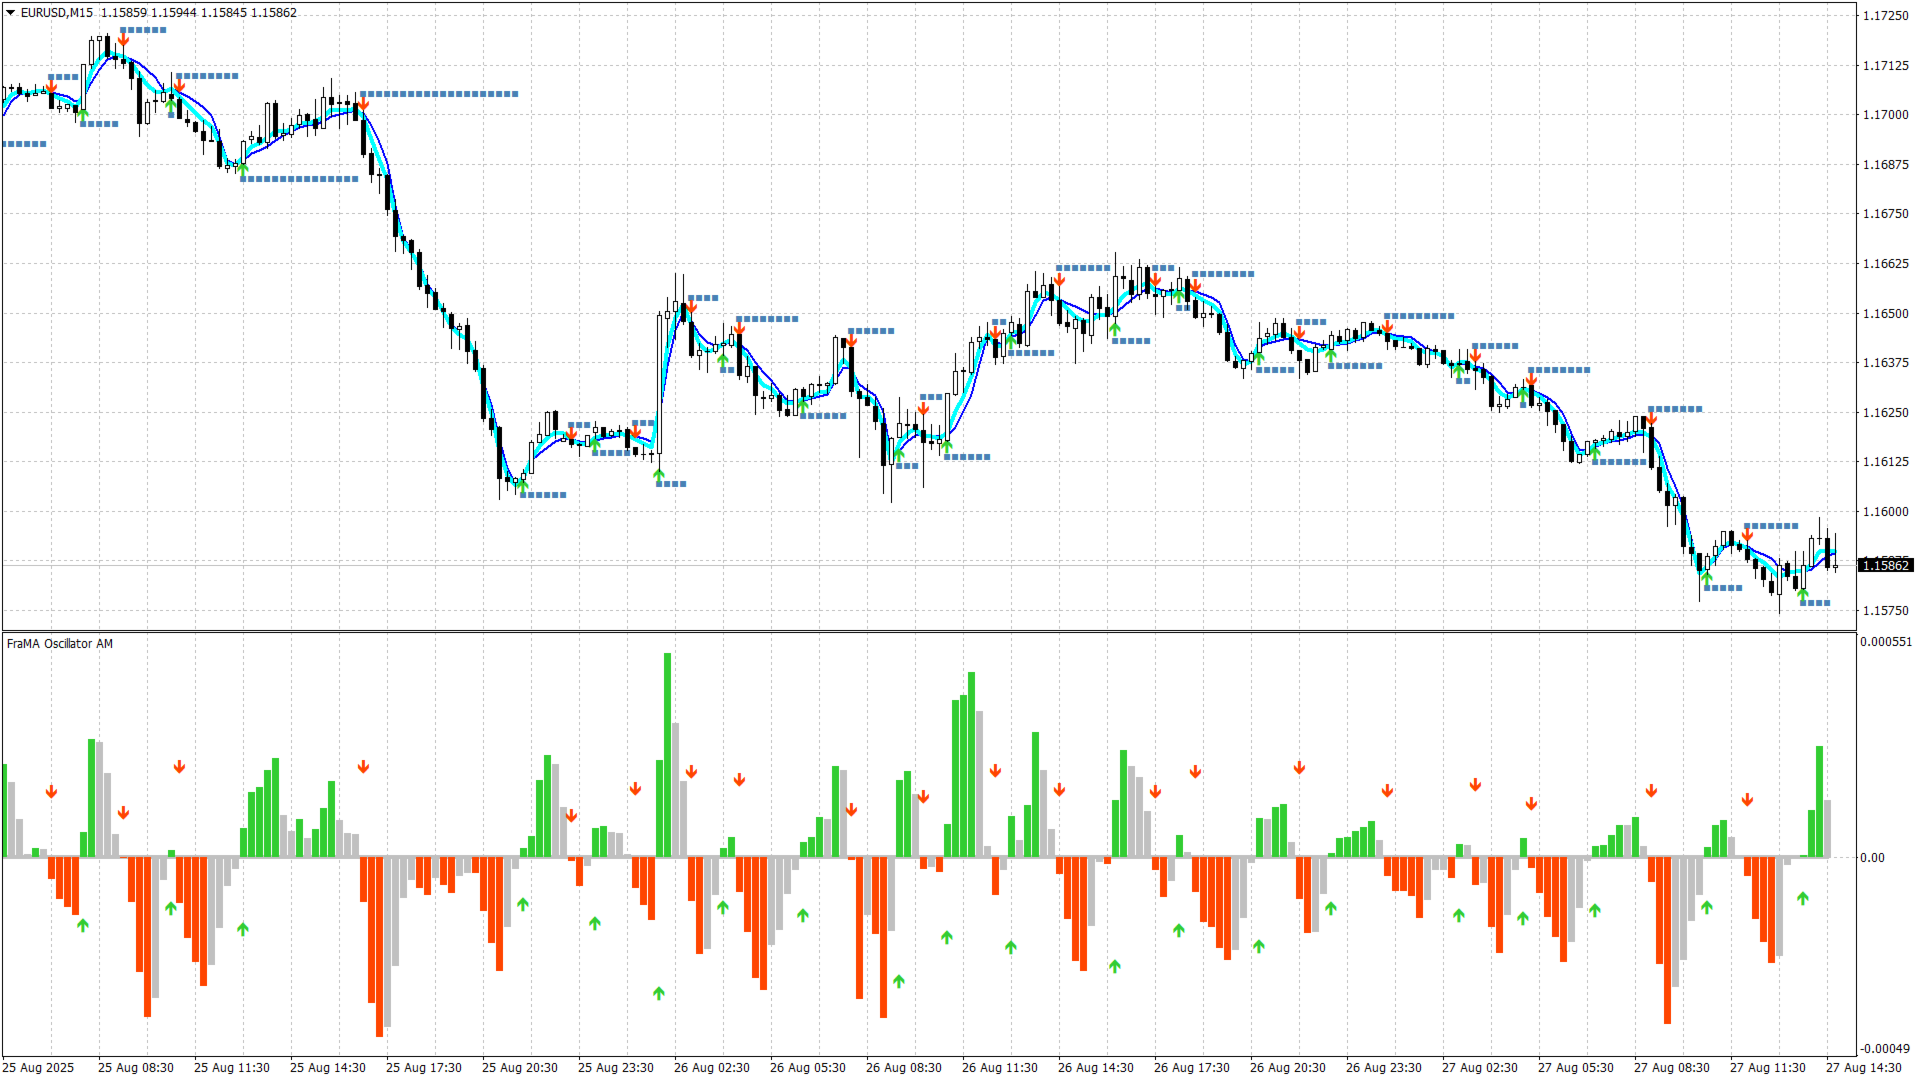
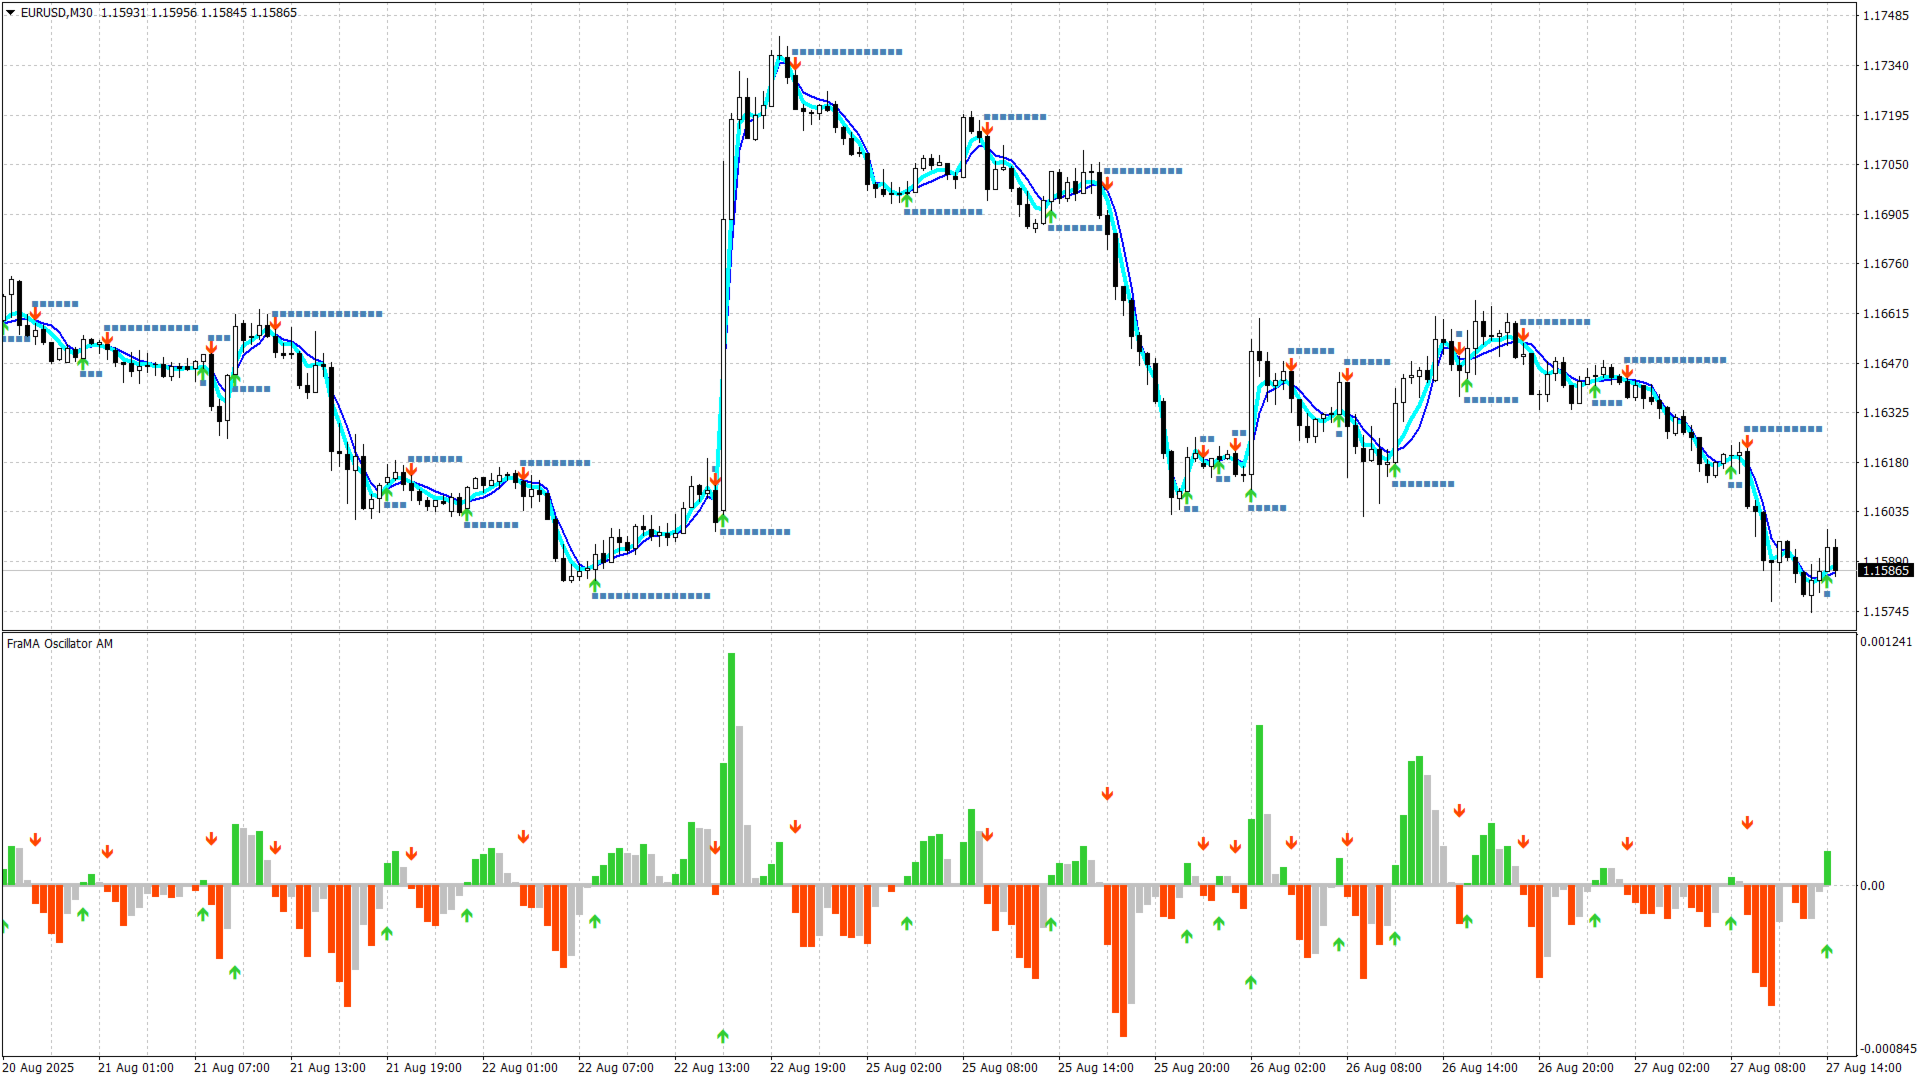
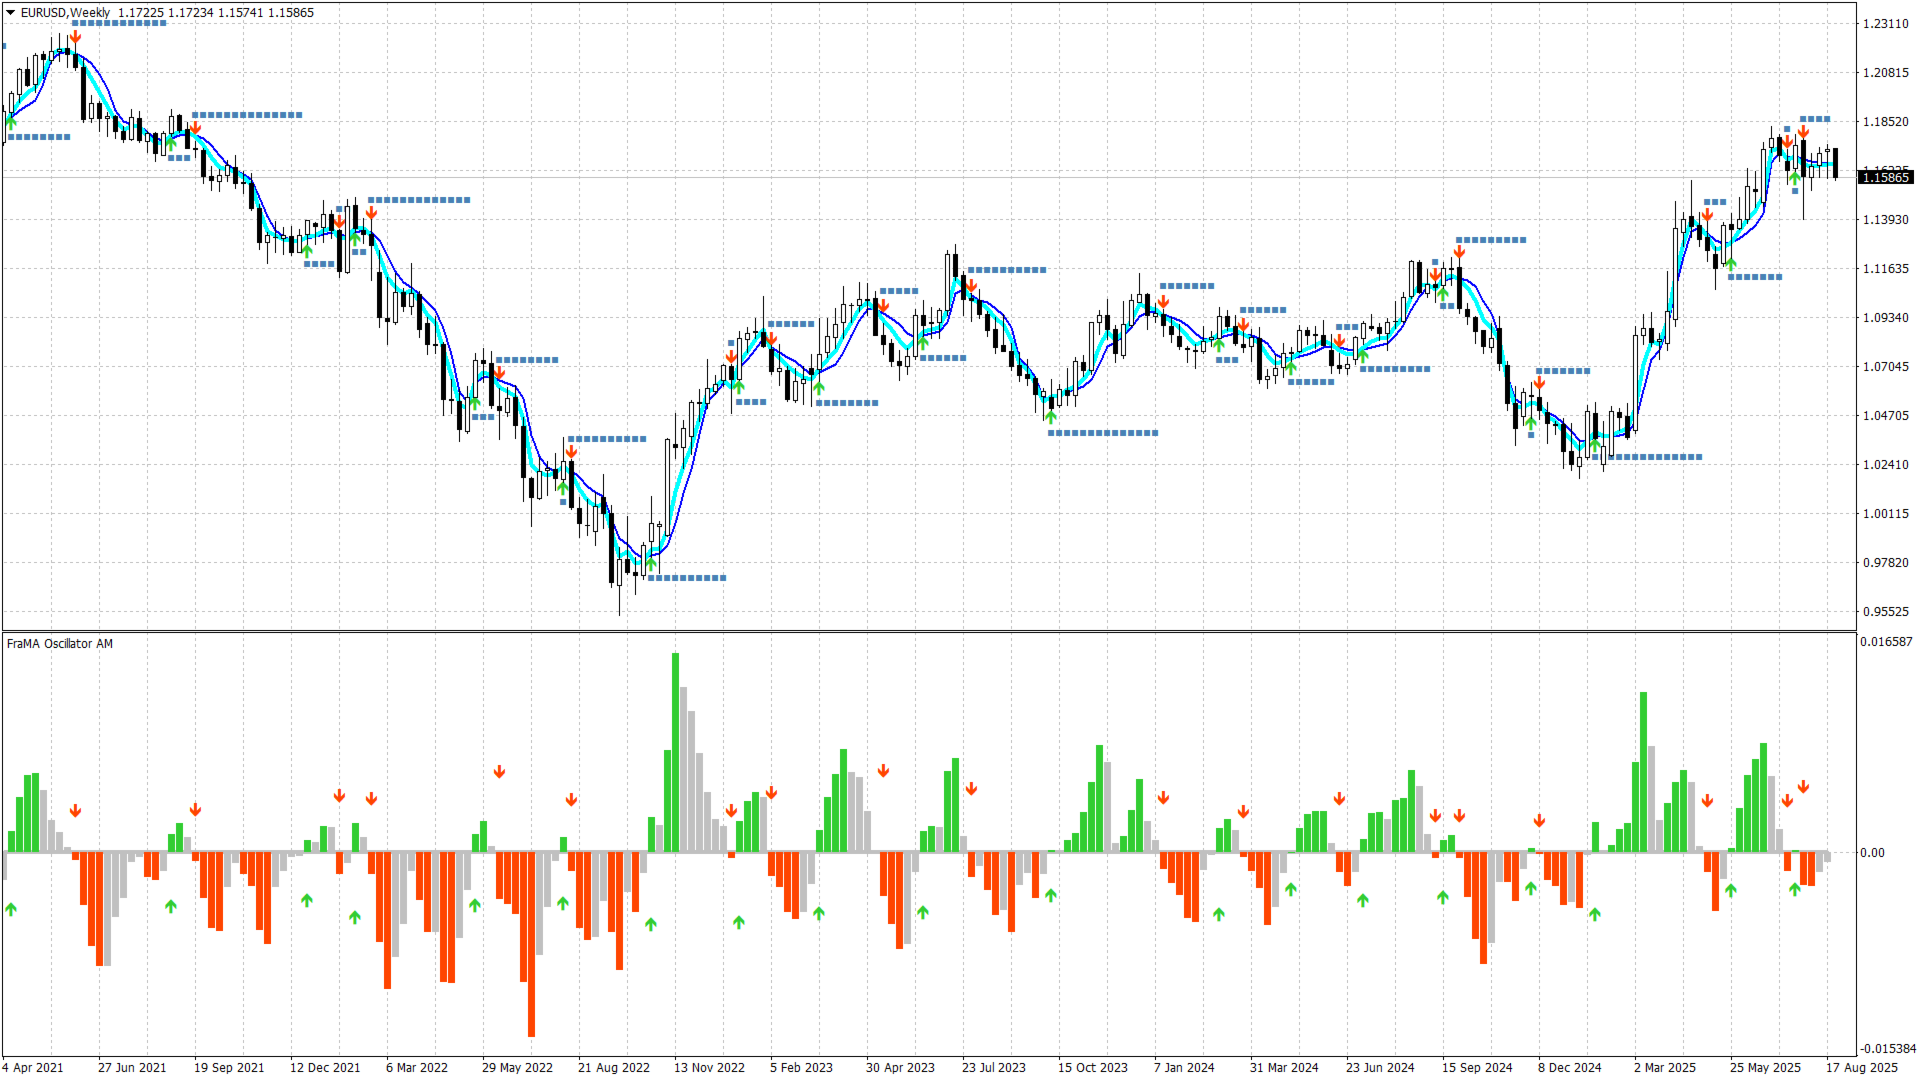
  • 1. A trivial but important recommendation is to take into account the trend of a higher time period. The trend is determined based on the data of the same indicator opened on a higher period of the chart. Open trades only in the direction of the trend. Countertrend signals can only be used to close a position or set protective stop orders.
  • 2. It is recommended to open a position only after confirmation of the signal given by the indicator. Confirmation is when the price overcomes the maximum (for buying) or minimum (for selling) of the bar on which the signal was given. Thus, it is rational to open trades by setting pending orders one point higher (taking into account the spread) or one point below the bar at which the signal was given.
  • 3. Support/resistance points can be used both for setting protective stop orders and for deferred opposite orders.
  • 4. Control of an open position can be carried out according to the data of the same indicator opened on a lower period of the chart.

Customizable parameters:

  • Period - period of data used to calculate the indicator;
  • Price - price used to calculate the indicator;
  • Main_multiplier - adaptive factor for the main line of the indicator;
  • Signal_multiplier - adaptive factor for the indicator signal line.

Attention:

It should be taken into account that any market is constantly changing and there is no guarantee that methods that were effective in the past will be effective in the future.

To minimize potential losses, you should regularly optimize the product parameters, study the results of its work and withdraw part of the profit received.

It is recommended that before using the product on a real account, you test its work on a demo account on the same market and with the same broker where you plan to trade.

With respect and best wishes,

Andriy Matviyevs'kyy


P.S.

If you liked this product, I would be grateful for a fair assessment - positive user reviews motivate the author, and reasonable criticism allows us to make products better.

I suggest visiting my page where you will find many unique author's works that are the result of many years of studying exchange trading and FOREX trading.


Recommended products
Owl smart levels
Sergey Ermolov
4.24 (37)
MT5 version  |  FAQ The Owl Smart Levels Indicator  is a complete trading system within the one indicator that includes such popular market analysis tools as  Bill Williams' advanced fractals , Valable ZigZag which builds  the correct wave structure  of the market, and  Fibonacci levels  which mark the exact levels of entry into the market and places to take profits. Detailed description of the strategy Instructions for working with the indicator Advisor-assistant in trading Owl Helper Private
Alpha Trend sign has been a very popular trading tool in our company for a long time. It can verify our trading system and clearly indicate trading signals, and the signals will not drift. Main functions: Based on the market display of active areas, indicators can be used to intuitively determine whether the current market trend belongs to a trend market or a volatile market. And enter the market according to the indicator arrows, with green arrows indicating buy and red arrows indicating se
Good day! To your attention the ForexdivergencePS indicator may not be the newest in the trading strategy The Forex indicator detects and displays descending and ascending divergences on the chart. When a new pattern is formed, a pop-up window is triggered. An arrow is formed on the chart that shows the type of phenomenon and helps to open an order in the optimal direction. Friends of traders rate the effectiveness of the tool as above average. You can change settings, including the sensitiv
Níveis de suporte ou resistência formados quando a ação do preço de um mercado reverte e muda de direção, deixando para trás um pico ou vale (ponto de oscilação) no mercado. Os níveis de suporte e resistência podem criar faixas de negociação. O indicador identifica High e Low com base no Período. Características principais Um conceito chave da análise técnica é que quando um nível de resistência ou suporte é quebrado, seu papel é invertido. Se o preço cair abaixo de um nível de suporte, esse n
Super Reversal Pattern
Parfait Mujinga Ndalika
Super Reversal Pattern Indicator Unlock the power of advanced pattern recognition with our Super Reversal Pattern Indicator. Designed for traders seeking precision and reliability, this indicator identifies one of the most effective reversal patterns in technical analysis, offering a significant edge in your trading strategy. Key Features: Non-Repainting Accuracy: Enjoy the confidence of non-repainting technology. Once a Super Reversal Pattern is detected, it remains static, providing consiste
Power Renko MT4
Pierce Vallieres
Power Renko is an indicator which plots Renko bricks underneath the chart using a histogram. You can select the brick size and the timeframe of the Renko bricks as well as whether or not to use the close price or the high/low price of the candles. Renko bricks are based on price alone, not time, therefor the Renko bricks will not be aligned with the chart's time. They are extremely useful for trend trading and many different strategies can be formed from them. Buffers are provided allowing you t
EZZ Elite Zig Zag is an indicator for the MetaTrader 4 terminal. This indicator traces the peak of the trend based on the market reversal, thus showing various opportunities in the financial market. EZZ Elite Zig Zag is a visual tool, intuitive, and easy to understand and use.  Test it Yourself by Downloading it for Free. Author Paulo Rocha all rights reserved
Happy Scalping Indicator
Leandro Bernardez Camero
This indicator was designed for aggressive scalping and quick entries in binary options , generating signals on every candle , so you can know exactly what is happening at all times. Join the Happy Scalping channel: MQL5 It does not repaint : the current candle's signal is generated in REAL TIME , which means it may change while the candle is still forming, depending on whether the price rises or falls compared to the previous candle's close. But once the candle closes , the signal color becom
Renko, Heiken Ashi, Ticks Bar, Range Bar.    Easy switching, easy setup, all in one window.        Place the Custom Chart indicator and view Renko, Heiken Ashi, Tick bar, Range bar charts in real time at real chart.    Position the offline chart window so that the indicator control panel is visible.    Switch the chart mode by click of a button.    Connect to the output chart any indicator, expert advisor without any restrictions.    No, it doesn't work in the tester.    Yes, you can use an
The Arrows Forecasters indicator is simple, visual and effective trend detection. The intelligent algorithm of the indicator determines the trend with a good probability. Uses just one parameter for settings. The indicator shows the points of potential market reversal. Ready-made trading system. The indicator does not redraw and does not lag. Works on all currency pairs and on all timeframes. You should remember that using a combination of forecasting tools, it is advisable to choose 2-3 indic
Noize Absorption Index MT4
Ekaterina Saltykova
5 (1)
Noize Absorption Index - is the manual trading system that measures the difference of pressure between bears forces and bulls forces. Green line - is a noize free index that showing curent situation. Zero value of index shows totally choppy/flat market.Values above zero level shows how powerfull bullish wave is and values below zero measures bearish forces.Up arrow appears on bearish market when it's ready to reverse, dn arrow appears on weak bullish market, as a result of reverse expectation. S
Heiken Ashi Smoothed Strategy is a very simple but powerful system to get forex market trend direction. This indicator is actually 2 indicators in 1 pack, Heiken Ashi and Heiken Ashi Smoothed Moving Average both included. Because HA (Heiken Ashi) and HAS (Heiken Ashi Smoothed) are calculated in the same one system event with necessary buffers and loop only, so it is the FAST, OPTIMIZED and EFFICIENT HA having the combined indicator of MetaTrader 4. You can choose to display HA and HAS in the sam
Auto Fibo Pro m
DMITRII GRIDASOV
"Auto FIBO Pro"   Crypto_Forex  indicator  - is great auxiliary tool in trading! Indicator automatically calculate and place on chart Fibo levels and local trend lines (red color). Fibonacci levels indicate key areas where price can reverse. Most important levels are 23.6%, 38.2%, 50% and 61.8%. You can use it   for reversal scalping  or for zone grid trading. There are plenty of opportunities to  improve your current system using Auto FIBO Pro indicator as well. It has Info Spread Swap Displa
Heiken Ashi candle chart is an improved version of The Japanese candle chart, which can effectively filter the market "noise" of the Japanese candle chart. It is favored by many traders for its simplicity and intuition. For trend traders, the HA candle chart is a magic tool. Unlike the traditional Japanese candle chart, Heikenashi does not reflect the opening price, high price, low price and closing price of the market. Instead, Heikenashi calculates the value of a single K line in the dominant
EARLY REMINDER: The Starting price is 65 price will rise soon up to 365$ and then 750$ after first 10 copies of sales. Grab this offer now! Introduction Hello, traders! Welcome to the demonstration of the Forex Beast Indicator , a comprehensive tool designed to assist aspiring traders in navigating the complexities of the forex market. This indicator incorporates seven essential components to provide a well-rounded trading experience: Moving Averages Colored Zones Support and Resistance Levels
SimSim Arrow Momentum is a standard "Momentum" indicator, but an arrow version. MetaTrader 5 version The indicator parameters are similar to the standard ones, plus one additional parameter Delta. Delta = 0 - 100 Deviations as of the 100 value. Changing the level of the 100 indicator, Plus and minus are possible. The indicator generates a signal when the price crosses the level line = 100 +- Delta. Enable "CONTROL DEAL" for operation and trades based on the indicator signal will be opened au
Pro Magic Signal   indicator is designed for signal trading. This indicator generates trend signals.  It uses many algorithms and indicators to generate this signal. It tries to generate a signal from the points with the highest trend potential. This indicator is a complete trading product. This indicator does not need any additional indicators.  The indicator certainly does not repaint. The point at which the signal is given does not change.  Thanks to the alert features you can get the signals
Precise Cross Arrow     indicator is designed for signal trading. This indicator generates trend signals. It uses many algorithms and indicators to generate this signal. It tries to generate a signal from the points with the highest trend potential. This indicator is a complete trading product. This indicator does not need any additional indicators. The indicator certainly does not repaint. The point at which the signal is given does not change.     Features and Suggestions Time Frame: H1
Fx Perfect Signal indicator is designed for signal trading. This indicator generates trend signals.  It uses many algorithms and indicators to generate this signal. It tries to generate a signal from the points with the highest trend potential. This indicator is a complete trading product. This indicator does not need any additional indicators.  The indicator certainly does not repaint. The point at which the signal is given does not change.  Thanks to the alert features you can get the signals
Market Overview MT4
Mehran Sepah Mansoor
5 (1)
Optimize your trading decisions with our market strength and sentiment indicator and no longer trade against the trend! Meticulously designed for serious traders who value accurate and timely information, our indicator provides a bird's-eye view of the 28 major pairs in a very simple way. This tool is able to rank the currency pairs based on terms of popularity, bullish or bearish trend strength and percentage of buyers and sellers / MT5 version .  Features Real-Time Trend Strength: Get an accu
Description Shows Heikin-Ashi candles (often misspelled Heiken-Ashi) on the chart and can alert when candles change color. The alert is useful for both entry and exit. The number of candles of the new color before an alert is raised can be set. The alert can be controlled interactively, directly from the chart. Also includes bonus indicators of current spread and ask/bid prices in large text, color coded as price changes. Usage Heikin-Ashi candles give a much better insight to the underlying tre
Crypto_Forex Indicator "Inside Bar & PinBar Patterns" for MT4, No repaint, No delay. - Indicator "Inside Bar & PinBar Patterns" is very powerful for Price Action trading. - Indicator detects Inside Bar and PinBar Patterns on chart: - Bullish pattern - Blue arrow signal on chart (see pictures). - Bearish pattern - Red arrow signal on chart (see pictures). - Inside Bar itself has High R/R ratio (reward/risk). - With PC, Mobile & Email alerts. - Indicator "Inside Bar & PinBar Patterns" is excelle
Fractal Zig Zag
Mikhail Nazarenko
A   professional version of the ZigZag indicator for visualizing the structure of price movements by fractals. Fractal ZigZag fixes the flaws of the standard version of the ZigZag indicator MT4. It uses Price action and a unique filtering algorithm to determine fractals. Suitable for all types of trading. Ideal for trading according to the WM pattern "Sniper" strategy !!! Features Marks the place of price reversal during the formation of a new fractal with specified parameters. Suitable for al
Binary Options Support Resistance Indicator This indicator is designed for binary options trading and effectively shows retracements from support and resistance levels. Signals appear on the current candle. A red arrow pointing downwards indicates a potential selling opportunity, while a blue arrow pointing upwards suggests buying opportunities. All that needs adjustment is the color of the signal arrows. It is recommended to use it on the M1-M5 timeframes as signals are frequent on these timef
Simple Long Short Bar A very concise and clear indicator, very easy to understand, but it is very useful for tracking trends. The usage of this indicator is very simple: Long signal: If the price shows signs of a long market, then a yellow box will appear. Short signal: If the price shows signs of a short market, then a blue box will appear. Bull strength: If the size of the box is large, it means the bull strength is strong, and vice versa. Short strength: If the size of the box is small, it m
Magic Filter MTF
Yaroslav Varankin
Magic Filter MTF is perfect for any strategy. you do not need to load the chart with extra indicators like this one indicator will replace all additional filters for you it can also be a great strategy. it combines well with trading at local minima and maximums (resistance levels) multi-timeframe-multi-currency indicator 4 screen system is used 4 rows of arrows UTB indicators adjusted for different periods when two arrows pointing in the same direction on the same timeframe coincide,I t c
The Sensitive Volume indicator is an indicator designed to generate trading signals. The purpose of this indicator is to generate signals from the highest probability of trading. Using a number of price movements and a set of indicator properties to generate these signals.  Easy to use, simple and understandable to the user. With alert features, user signals can be reached quickly.  Visually the user can easily recognize the signals. This indicator will not repaint. Parameters Trend_Period - pe
This is an intraday indicator that uses conventional formulae for daily and weekly levels of pivot, resistance and support, but updates them dynamically bar by bar. It answers the question how pivot levels would behave if every bar were considered as the last bar of a day. At every point in time, it takes N latest bars into consideration, where N is either the number of bars in a day (round the clock, i.e. in 24h) or the number of bars in a week - for daily and weekly levels correspondingly. So,
This is an MTF indicator of support and resistance levels based on Advanced ZigZag Dynamic and/or Extended Fractals indicator extremums with price labels (can be disabled). More higher TFs can be selected for MTF mode. By default, the levels are generated based on ZigZag indicator dots. Fractals indicator dots can also be used together with ZigZag or instead of it. In order to simplify the use and save CPU time, calculation is performed once per each bar at its opening. Parameters: ForcedTF - ch
Line Magic New Metod similar to the usual Moving Average but not so This tool has a completely different data calculation algorithm. you can see this by comparing them it is recommended to use this indicator with the Moving Average since when combining these two tools they compensate for most of the shortcomings of themselves apply as shown in the screenshots
Buyers of this product also purchase
M1 Sniper
Oleg Rodin
5 (12)
M1 SNIPER is an easy to use trading indicator system. It is an arrow indicator which is designed for M1 time frame. The indicator can be used as a standalone system for scalping on M1 time frame and it can be used as a part of your existing trading system. Though this trading system was designed specifically for trading on M1, it still can be used with other time frames too. Originally I designed this method for trading XAUUSD and BTCUSD. But I find this method helpful in trading other markets a
Trend indicator AI
Ramil Minniakhmetov
5 (47)
Trend Ai indicator is great tool that will enhance a trader’s market analysis by combining trend identification with actionable entry points and reversal alerts.  This indicator empowers users to navigate the complexities of the forex market with confidence and precision Beyond the primary signals, Trend Ai indicator identifies secondary entry points that arise during pullbacks or retracements, enabling traders to capitalize on price corrections within the established trend. Important Advantage
Gann Made Easy
Oleg Rodin
4.82 (138)
Gann Made Easy is a professional and easy to use Forex trading system which is based on the best principles of trading using the theory of W.D. Gann. The indicator provides accurate BUY and SELL signals including Stop Loss and Take Profit levels. You can trade even on the go using PUSH notifications. PLEASE CONTACT ME AFTER PURCHASE TO GET MY TRADING TIPS PLUS A GREAT BONUS! Probably you already heard about the Gann trading methods before. Usually the Gann theory is a very complex thing not only
Cycle Maestro
Stefano Frisetti
1 (1)
If a new green  NOTE: CYCLEMAESTRO is distributed only on this website, there are no other distributors. Demo version is for reference only and is not supported. Full versione is perfectly functional and it is supported CYCLEMAESTRO , the first and only indicator of Cyclic Analysis, useful for giving signals of TRADING, BUY, SELL, STOP LOSS, ADDING. Created on the logic of  Serghei Istrati  and programmed by  Stefano Frisetti ;  CYCLEMAESTRO  is not an indicator like the others, the challenge wa
Dynamic Forex28 Navigator
Bernhard Schweigert
5 (6)
Specials Discount now. The Next Generation Forex Trading Tool. Dynamic Forex28 Navigator is the evolution of our long-time, popular indicators, combining the power of three into one: Advanced Currency Strength28 Indicator (695 reviews) + Advanced Currency IMPULSE with ALERT (520 reviews) + CS28 Combo Signals (recent Bonus) Details about the indicator  https://www.mql5.com/en/blogs/post/758844 What Does The Next-Generation Strength Indicator Offer? Everything you loved about the originals, now
Scalper Inside PRO
Alexey Minkov
4.7 (69)
An exclusive indicator that utilizes an innovative algorithm to swiftly and accurately determine the market trend. The indicator automatically calculates opening, closing, and profit levels, providing detailed trading statistics. With these features, you can choose the most appropriate trading instrument for the current market conditions. Additionally, you can easily integrate your own arrow indicators into Scalper Inside Pro to quickly evaluate their statistics and profitability. Scalper Inside
Day Trader Master is a complete trading system for traders who prefer intraday trading. The system consists of two indicators. The main indicator is the one which is represented by arrows of two colors for BUY and SELL signals. This is the indicator which you actually pay for. I provide the second indicator to my clients absolutely for free. This second indicator is actually a good trend filter indicator which works with any time frame. THE INDICATORS DO NOT REPAINT AND DO NOT LAG! The system is
RelicusRoad Pro
Relicus LLC
4.63 (105)
How many times have you bought a trading indicator with great back-tests, live account performance proof with fantastic numbers and stats all over the place but after using it, you end up blowing your account? You shouldn't trust a signal by itself, you need to know why it appeared in the first place, and that's what RelicusRoad Pro does best! User Manual + Strategies + Training Videos + Private Group with VIP Access + Mobile Version Available A New Way To Look At The Market RelicusRoad is th
PZ Mean Reversion MT4
PZ TRADING SLU
3 (4)
Outperform traditional strategies: effective mean reversion for savvy traders Unique indicator that implements a professional and quantitative approach to mean reversion trading. It capitalizes on the fact that the price diverts and returns to the mean in a predictable and measurable fashion, which allows for clear entry and exit rules that vastly outperform non-quantitative trading strategies. [ Installation Guide | Update Guide | Troubleshooting | FAQ | All Products ] Clear trading signals Am
Advanced Supply Demand
Bernhard Schweigert
4.91 (296)
CURRENTLY 26% OFF !! Best Solution for any Newbie or Expert Trader! This indicator is a unique, high quality and affordable trading tool because we have incorporated a number of proprietary features and a new formula. With this update, you will be able to show double timeframe zones. You will not only be able to show a higher TF but to show both, the chart TF, PLUS the higher TF: SHOWING NESTED ZONES. All Supply Demand traders will love it. :) Important Information Revealed Maximize the potentia
Wall Street Indicator – Your Key to Trading Success! Tired of tools that promise the world but fail to deliver results? Designed for MT4, the Wall Street Indicator is the ultimate solution to elevate your trading to the next level. This indicator has been meticulously developed to provide clear, reliable, and precise signals. Here's why the Wall Street Indicator is the perfect choice for both beginners and experienced traders: Unmatched Performance – Proven Results 1-year detailed backtest: With
Special offer : ALL TOOLS , just $35 each! New tools   will be   $30   for the   first week   or the   first 3 purchases !  Trading Tools Channel on MQL5 : Join my MQL5 channel to update the latest news from me RSI Shift Zone Scanner identifies moments when market sentiment may change by linking RSI signals with price action. Whenever the RSI moves above or below preset levels (default 70 for overbought, 30 for oversold), the indicator draws a channel directly on the chart. These channels mark
Algo Pumping MT4
Ihor Otkydach
4.93 (14)
PUMPING STATION – Your Personal All-inclusive strategy Introducing PUMPING STATION — a revolutionary Forex indicator that will transform your trading into an exciting and effective activity! This indicator is not just an assistant but a full-fledged trading system with powerful algorithms that will help you start trading more stable! When you purchase this product, you also get FOR FREE: Exclusive Set Files: For automatic setup and maximum performance. Step-by-step video manual: Learn how to tra
Apollo Trend Rider is an easy to use arrow indicator which provides BUY and SELL signals. The indicator does not repaint and thus gives you the opportunity to test the indicator and adapt it to any trading instrument and time frame you want to use in trading. The indicator provides all types of alerts including PUSH notifications. This indicator is based on the combination of several strategies which include trend, breakout and reversal type strategies. It is possible to use the indicator as a s
TPSproTREND PrO
Roman Podpora
4.68 (25)
Entry points at the bar close,  without redrawing .  Trend scanner  across all assets,  MTF - mode  and much more in one tool. We recommend using it together with   RFI LEVELS. ИНСТРУКЦИЯ RUS   /   INSTRUCTIONS  ENG         /        VERSION MT5 Main functions: Accurate entry signals WITHOUT REPAINTING! Once a signal appears, it remains valid! This is a significant distinction from repainting indicators that might provide a signal and then alter it, potentially leading to deposit losses. Now, you
Apollo Secret Trend is a professional trend indicator which can be used to find trends on any pair and time frame. The indicator can easily become your primary trading indicator which you can use to detect market trends no matter what pair or time frame you prefer to trade. By using a special parameter in the indicator you can adapt the signals to your personal trading style. The indicator provides all types of alerts including PUSH notifications. The signals of the indicator DO NOT REPAINT! In
CURRENTLY 26% OFF Best Solution for any Newbie or Expert Trader! This Indicator is a unique, high quality and affordable trading tool because we have incorporated a number of proprietary features and a new formula. With only ONE chart you can read Currency Strength for 28 Forex pairs! Imagine how your trading will improve because you are able to pinpoint the exact trigger point of a new trend or scalping opportunity? User manual: click here That's the first one, the original! Don't buy a worthle
Trend Screener
STE S.S.COMPANY
4.79 (95)
Unlock the Power of Trends Trading with the Trend Screener Indicator: Your Ultimate Trend Trading Solution powered by Fuzzy Logic and Multi-Currencies System! Elevate your trading game with the Trend Screener, the revolutionary trend indicator designed to transform your Metatrader into a powerful Trend Analyzer. This comprehensive tool leverages fuzzy logic and integrates over 13 premium features and three trading strategies, offering unmatched precision and versatility. LIMITED TIME OFFER : Tre
Introducing   Quantum Trend Sniper Indicator , the groundbreaking MQL5 Indicator that's transforming the way you identify and trade trend reversals! Developed by a team of experienced traders with trading experience of over 13 years,   Quantum Trend Sniper Indicator   is designed to propel your trading journey to new heights with its innovative way of identifying trend reversals with extremely high accuracy. ***Buy Quantum Trend Sniper Indicator and you could get Quantum Breakout Indicator for
ACB Breakout Arrows
KEENBASE SOFTWARE SOLUTIONS
4.15 (34)
The ACB Breakout Arrows indicator provides a crucial entry signal in the market by detecting a special breakout pattern. The indicator constantly scans the chart for a settling momentum in one direction and provide the accurate entry signal right before the major move.  Get multi-symbol and multi-timeframe scanner from here - Scanner for ACB Breakout Arrows MT4 Key features Stoploss and Take Profit levels are provided by the indicator. Comes with a MTF Scanner dashboard which tracks the breako
Matrix Arrow Indicator MT4
Juvenille Emperor Limited
5 (3)
Matrix Arrow Indicator MT4  is a unique 10 in 1 trend following 100% non-repainting  multi-timeframe indicator that can be used on all symbols/instruments: forex, commodities, cryptocurrencies, indices, stocks.  Matrix Arrow Indicator MT4 will determine the current trend at its early stages, gathering information and data from up to 10 standard indicators, which are: Average Directional Movement Index (ADX) Commodity Channel Index (CCI) Classic Heiken Ashi candles Moving Average Moving Avera
Scientific trade
Aleksey Ivanov
5 (1)
An extremely convenient indicator that truly makes the process of making money on the exchange easy. It is based on the scientifically rigorous theory of the market developed by the author, the beginning of which is presented here .                The full algorithm of this indicator operation is presented in the article .               The indicator calculates the most probable price movement trajectory and displays it on the chart. Based on the predicted price movement trajectory
Max Paynex
Abdulkarim Karazon
Max Payne is a reversal/trend signal indicator that gives signals in a form of an arrow, this indicator gives its signal on same bar close, this indicator can dropped multiple times on the chart with different periods to get double/triple confirmation of signals the indicator is highly adjustable to fit any trading style while it never repaints or back paint, you will get the full system shown in screenshots after purchase along side used templates. ----------------- How to trade : wait until y
Trend Reversal – Your Ally for Identifying Trend Reversals on MT4 Are you looking for a powerful and intuitive tool to enhance your market analysis and make more informed decisions? The Trend Reversal indicator is specifically designed for traders who want to accurately identify trend reversal points directly on the MetaTrader 4 platform. Thanks to its combination of advanced algorithms and proven techniques, Trend Reversal provides clear and visible signals to help you recognize key market mom
Hello Guys, WinningSpell Indicator (No Repaint) shows Buyers and Sellers activity on any given chart and timeframe of any quote that is available in MT4 platform. It calculates those values by a sophisticated formulae that I have discovered a long time ago and improved over the years. It uses OHLCV values of every M1 bar to make the calculation for any timeframe by a formulae and represents those values via oscillator creating waves of spikes. It can be easily used as a system by its own, or be
Auto Optimized Bollinger Bands – Adaptive Volatility Tool for Real Markets Auto Optimized Bollinger Bands is an advanced MT4 indicator that improves the traditional Bollinger Bands by automatically selecting the best period and deviation values using historical trade simulation. Instead of fixed inputs, the indicator runs real-time optimization to find the most effective parameters based on actual market behavior. This allows the bands to adjust to changing volatility and price structure without
TPSpro RFI Levels
Roman Podpora
4.85 (27)
Reversal zones - levels / Active zones of a major player INSTRUCTIONS RUS   /   INSTRUCTIONS   ENG   /   Version MT5 EVERY BUYER OF THIS INDICATOR       GET ADDITIONALLY   FOR FREE   : 3 months access       to trading signals from the service       RFI SIGNALS   — ready-made entry points according to the TPSproSYSTEM algorithm. 3 months access       to training materials with regular updates - immersion in strategy and professional growth. 24/5 support on weekdays and access to a closed traders
- Real price is 80$ - 40% Discount (It is 49$ now) -  Only 2 purchase is 49$. Contact me for instruction, add group and any questions! - Non-repaint - I just sell my products in Elif Kaya profile, any other websites are stolen old versions, So no any new updates or support. - Lifetime update free Related product:   Bitcoin Expert Introduction The breakout and retest strategy is traded support and resistance levels. it involves price breaking through a previous level.  The break and retest stra
Currency Strength Exotics
Bernhard Schweigert
4.88 (32)
CURRENTLY 20% OFF ! Best Solution for any Newbie or Expert Trader! This Indicator is specialized to show currency strength for any symbols like Exotic Pairs Commodities, Indexes or Futures. Is first of its kind, any symbol can be added to the 9th line to show true currency strength of Gold, Silver, Oil, DAX, US30, MXN, TRY, CNH etc. This is a unique, high quality and affordable trading tool because we have incorporated a number of proprietary features and a new formula. Imagine how your trading
Trend Arrow Super
Aleksandr Makarov
5 (2)
Trend Arrow Super The indicator not repaint or change its data. A professional, yet very easy to use Forex system. The indicator gives accurate BUY\SELL signals. Trend Arrow Super is very easy to use, you just need to attach it to the chart and follow simple trading recommendations. Buy signal: Arrow + Histogram in green color, enter immediately on the market to buy. Sell signal: Arrow + Histogram of red color, enter immediately on the market to sell.
More from author
TTF Candles AM
Andriy Matviyevs'kyy
The presented indicator is an original development based on the TTF (Trend Trigger Factors) indicator. The indicator colors the price chart candles according to the TTF indicator data and its smoothed value (Signal line). The indicator does not repaint. The following thesis is used: The intersection of the TTF oscillator with the zero value is a buy/sell signal. The intersection of the TTF oscillator with its smoothed value is a signal of a change in trend. Thus: If the TTF indicator is greater
ADX Trigger AM
Andriy Matviyevs'kyy
This indicator is an interpretation of the Average Directional Movement Index (ADX), which helps to determine the presence of a price trend. It was developed and described in detail in the book "New Concepts in Technical Trading Systems" by Welles Wilder. The indicator determines entry points into the market, using the intersection of the +/- lines of the ADX indicator as a signal, as well as the rise or fall of the main line of the ADX indicator. Crossing the zero line by the indicator indicate
ADX Signal AM
Andriy Matviyevs'kyy
This indicator is an interpretation of the Average Directional Movement Index (ADX), which helps to determine the presence of a price trend. It was developed and described in detail in the book "New Concepts in Technical Trading Systems" by Welles Wilder. The presented indicator displays signals on the price chart when +DI and -DI cross and signals when the ADX value falls or rises in relation to the mutual arrangement of +DI and -DI. The indicator's buy signals also work as a support level, whi
MFI Signal AM
Andriy Matviyevs'kyy
5 (1)
This indicator displays signals on the price chart based on the data of the classic indicator - the Money Flow Index (MFI). The volume is taken into account when calculating the MFI values. MFI can be used to determine overbought or oversold zones in the market. This indicator allows you to display three types of signals on the price chart: MFI exit from the overbought or oversold zone; MFI entry into the overbought or oversold zone; MFI crossing the middle between the overbought and oversold zo
SuperTrend AM
Andriy Matviyevs'kyy
The presented product is a trend indicator of technical analysis that builds dynamic support/resistance levels based on the volatility of a financial instrument. The indicator allows you to determine the entry points into the market at the moment the price overcomes dynamic support/resistance level and to set a reasonable level for fixing a loss/profit. The indicator is a simple and effective tool that (depending on the parameter settings) can be used in almost any market and for any trading st
HyperSignal AM
Andriy Matviyevs'kyy
The presented indicator is an original development. The indicator is designed for high-frequency short-term trading with maximum reinvestment of funds. The indicator gives signals to open/close a position. The indicator sensitivity can be adjusted in a literally infinite range, which allows it to be used for trading in any market. The indicator signals vary in strength depending on their consistency with the trend over three different time periods. The above indicator feature allows you to esti
EasyTrend AM
Andriy Matviyevs'kyy
The presented product is a trend indicator of technical analysis that allows you to open a position at the very beginning of a significant price movement. The most important qualities of the presented indicator are: The ability to follow the trend for as long as possible to get all the potential profit; Minimization of potential losses in case of a trend reversal or significant correction. The indicator has a wide range of customizable parameters allowing it to be used effectively in any market
Fine Trade AM
Andriy Matviyevs'kyy
The presented indicator evaluates the volatility of a financial instrument and provides highly effective signals about moments of significant changes in the direction of price movement. The indicator is intuitive and easy to use. The indicator signal is generated after the completion of the formation of the bar on which the indicator changes its position relative to zero. The indicator never redraws the signal. The indicator signals must be confirmed by the price exceeding the maximum/minimum of
TTF Line AM
Andriy Matviyevs'kyy
The presented indicator draws a trend line and points of change in its direction on the price chart based on the TTF (Trend Trigger Factors) and ATR indicators. The indicator advantageously combines ease of use, speed of reaction to a change in trend direction and reliability of signals. The indicator is intuitive to use: Change in line direction - change in trend direction; Change in line color warns of an imminent change in direction. The indicator does not repaint and allows you to send notif
Step RSI AM
Andriy Matviyevs'kyy
The presented indicator is an original development based on the classic technical analysis indicator - RSI. To smooth out sharp fluctuations in the indicator values, a filter is used that cuts off weak changes and focuses the trader's attention on strong fluctuations in the values. The indicator does not repaint on formed bars. For greater efficiency of this indicator, it should be used together with indicators that identify the trend direction, as well as support/resistance levels. The indicat
ADX Line AM
Andriy Matviyevs'kyy
This indicator, interpreting ADX and ATR data, clearly and accurately identifies the current trend, allowing the trader to get the most out of strong price movements. The indicator is intuitive to use: a change in line direction means a change in trend direction; a change in line color warns of an imminent change in direction. The indicator does not repaint and allows you to send notifications about its signals to a mobile terminal and email. Configurable parameters: ADX_Medium_Coefficient - the
Bulls or Bears AM
Andriy Matviyevs'kyy
5 (1)
The presented indicator implements the idea embedded in the classic technical analysis indicators - "Bulls" / "Bears" at a new level. The "Bulls or Bears AM" indicator displays the difference between the maximum and minimum prices for the current period of time and the values ​​of the channel built on the maximum and minimum prices for a longer period. The growth of the indicator values ​​above zero indicates that the maximum price for the current period is greater than the average value of maxi
Market Pulse AM
Andriy Matviyevs'kyy
5 (1)
The presented indicator analyzes the direction of the short-term and long-term trend for specified periods, taking into account the volatility of the market. This approach allows combining high sensitivity of the indicator with a high probability of execution of its signals. The principle of use is extremely simple: the indicator histogram is greater than 0 - a buy signal / the indicator histogram is less than 0 - a sell signal. The indicator allows you to configure two types of parameters: fast
RSI 4x Candles AM
Andriy Matviyevs'kyy
The presented indicator displays in the form of colored candles the signals of the intersections of four RSI indicators of different periods. The candle turns red when the values ​​of the first indicator are less than the values ​​of the second indicator and the values ​​of the third indicator are less than the values ​​of the fourth indicator. The candle turns blue when the values ​​of the first indicator are greater than the values ​​of the second indicator and the values ​​of the third indica
ASC Signal AM
Andriy Matviyevs'kyy
A signal indicator marking buy/sell points. In this version, it is supplemented with optimal SL points. Recommended for use in conjunction with a trend indicator to filter signals. The indicator has only one adjustable parameter that determines its sensitivity, which greatly simplifies setting the indicator to the current market and the user's trading style. Indicator signals are given only after the full formation of the bar. The indicator can be used to trade any market. Its basic parameters p
DSS Candles AM
Andriy Matviyevs'kyy
This indicator colors the price chart candles according to the data of the DSS Oscillator AM indicator. DSS Oscillator AM is the author's implementation of the Double Smoothed Stochastic oscillator developed by William Blau and Walter Bressert. The calculation of values ​​is largely similar to the calculation of the classic stochastic oscillator. The indicator takes into account the location of the current price relative to local highs/lows. The signal about the change in the direction of price
Deep River AM
Andriy Matviyevs'kyy
The presented indicator is the author's implementation of the classic trading idea: Moving averages of different periods diverge over time on a strengthening trend and converge on a weakening trend. The proposed product allows you to clearly demonstrate: The direction of price movement; Temporary price rollbacks; Zones of multidirectional price movement. Namely: The indicator lines go up and diverge from each other - a strong bullish trend; The indicator lines go down and diverge from each othe
Double PSAR AM
Andriy Matviyevs'kyy
This indicator is the author's implementation of the classic indicator Parabolic Support and Resist (PSAR). A time-tested product that allows you to not only determine entry/exit points but also reasonable levels for setting protective stop orders. The indicator has two customizable ranges, which allows you to identify long-term and short-term trends. The indicator does not repaint on the data history. The indicator has the ability to give signals and send notifications about them to e-mail and
AlphaTrend AM
Andriy Matviyevs'kyy
The presented indicator, based on the volatility readings of a financial instrument plots dynamic S/R levels on the price chart. The indicator determines the trend and points to possible entry points formed by local highs/lows. The indicator allows you to notify the user of its signals by sending messages to the terminal and e-mail. The indicator does not repaint or recalculate. Signals when working with the indicator: The appearance of a red arrow above the price chart is a possible start of a
REI Oscillator AM
Andriy Matviyevs'kyy
The presented product is the author's implementation of the REI (Range Expansion Index) indicator developed by Thomas DeMark. REI Oscillator AM is an indicator that measures the rate of price change and signals overbought/oversold conditions if the price shows weakness or strength. The indicator value changes within the range from -100 to +100. Thomas DeMark suggests using the default period of 8 and the following algorithm for using the indicator: When the price rises above level 60 and then fa
Fractal Levels AM
Andriy Matviyevs'kyy
The presented indicator is an original development based on the idea embedded in the classic technical analysis indicator - Fractals. The Fractals indicator allows you to determine a significant trough or peak for analysis on the price chart of the financial instrument in question. The fractal itself on the price chart consists of candles, the middle of which is either the highest (up fractal) or the lowest (down fractal) of all the candles taken for analysis. The original indicator uses five ca
Digital Arrows AM
Andriy Matviyevs'kyy
The presented technical analysis indicator marks the points on the price chart of a financial instrument at which the short-term/long-term trend has changed its direction. The indicator identifies the trend direction by analyzing the divergence of the price series with the data of the digital filter selected by the user. The ability of the applied digital filters to adapt to sharp price fluctuations allows achieving high efficiency of the indicator signals in most markets. The indicator signals
RSI Cross Signal AM
Andriy Matviyevs'kyy
The indicator gives signals to open/close a position and marks them on the price chart of the financial instrument. The signals differ in their potential, which allows you to decide on the amount of risk in each transaction. The principle of operation is to compare the current RSI value with the RSI value whose period is multiplied by the Cross_Factor value. The signal is confirmed when the price overcomes the maximum/minimum of the bar on which the indicator gave the signal. The open position i
DSS Oscillator AM
Andriy Matviyevs'kyy
The presented indicator is the author's implementation of the Double Smoothed Stochastic oscillator developed by William Blau and Walter Bressert. The calculation of values ​​is in many ways similar to the calculation of the classic stochastic oscillator. The indicator takes into account the location of the current price relative to local highs/lows. The indicator gives signals about changing its direction and/or about entering/exiting the overbought/oversold zone. The signal is given after the
Aroon Oscillator AM
Andriy Matviyevs'kyy
The presented indicator is the author's implementation in the oscillator format of the classic Aroon indicator. The Aroon indicator was developed in 1995 by the Indian trader Tushar Chande. Chand's origin played a role in choosing an unusual name for the oscillator. "Aroon" is translated from Sanskrit as "Light of the morning dawn". The formula for calculating the classic Aroon indicator: Aroon-Up = ((specified number of periods) – (number of periods since the maximum was formed)) / (specified n
Simple Aroon AM
Andriy Matviyevs'kyy
The presented indicator is the author's implementation of the classic Aroon indicator. The Aroon indicator was developed in 1995 by the Indian trader Tushar Chand. Chand's origin played a role in choosing an unusual name for the indicator. "Aroon" is translated from Sanskrit as "Light of the morning dawn". The formula for calculating the classic Aroon indicator: Aroon-Up = ((specified number of periods) - (number of periods since the formation of the maximum)) / (specified number of periods) * 1
Simple Trend AM
Andriy Matviyevs'kyy
The trend is your friend. A simple truth known to every trader. The presented indicator allows you to visualize the current trend. The indicator identifies the trend using the following definition as an algorithm: A trend is a situation when each subsequent maximum price rise is higher/lower than the previous one, and similarly each subsequent maximum price fall is higher/lower than the previous one; The beginning of a new trend is considered to be when the current maximum/minimum overcomes all
Limit Levels AM
Andriy Matviyevs'kyy
The presented indicator sets dynamic support/resistance levels on the price chart. The indicator is easy to use and can be useful for both beginners and professional traders. The middle line of the indicator (Central level) helps to identify the current trend: If the closing price is above the central line - the trend is ascending. If the closing price is below the central line - the trend is descending. The presented indicator allows implementing another version of the trading strategy, which w
FraMA Trend AM
Andriy Matviyevs'kyy
The presented indicator is essentially a separate trading system. The indicator independently determines entry points and points for setting protective stop orders. This product can be useful for both beginners and experienced traders, since it is developed on the basis of solutions proven by time and by professional traders. On fully formed bars the indicator is not redrawn. The indicator has the ability to send notifications to the terminal and email. Technically, the indicator is a system of
ELI Trigger AM
Andriy Matviyevs'kyy
The presented indicator is the author's implementation of the leading indicator Ehlers, created by John Ehlers. As the name suggests, this indicator should have high sensitivity and give early signals. The user can independently change the parameter for the sensitivity of the indicator. The indicator gives two types of signal: a signal of the beginning of a new trend; a signal of weakening of the current trend. Namely: when the histogram crosses the zero value - this is a signal of the beginning
Filter:
No reviews
Reply to review