Performance indicator
- Utilities
-
Mattia Impicciatore
 Hello,
I’m Mattia — a fintech developer, trader, and expert in MQL5, Python, and web technologies. - Version: 1.0
Overview
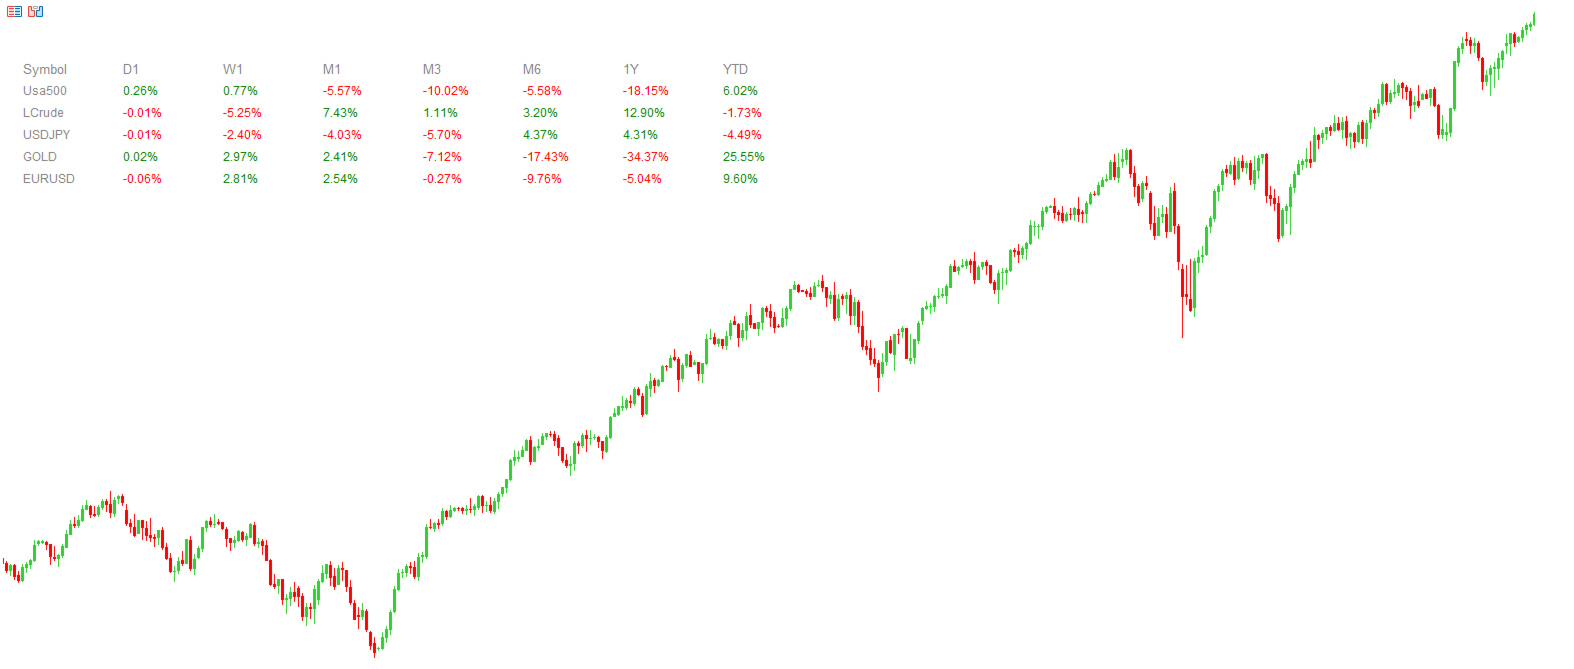
Performance Indicator shows a heatmap of percentage returns for a list of symbols over configurable time intervals. It is used to visually compare relative strength and weakness, without giving any guarantee of results.
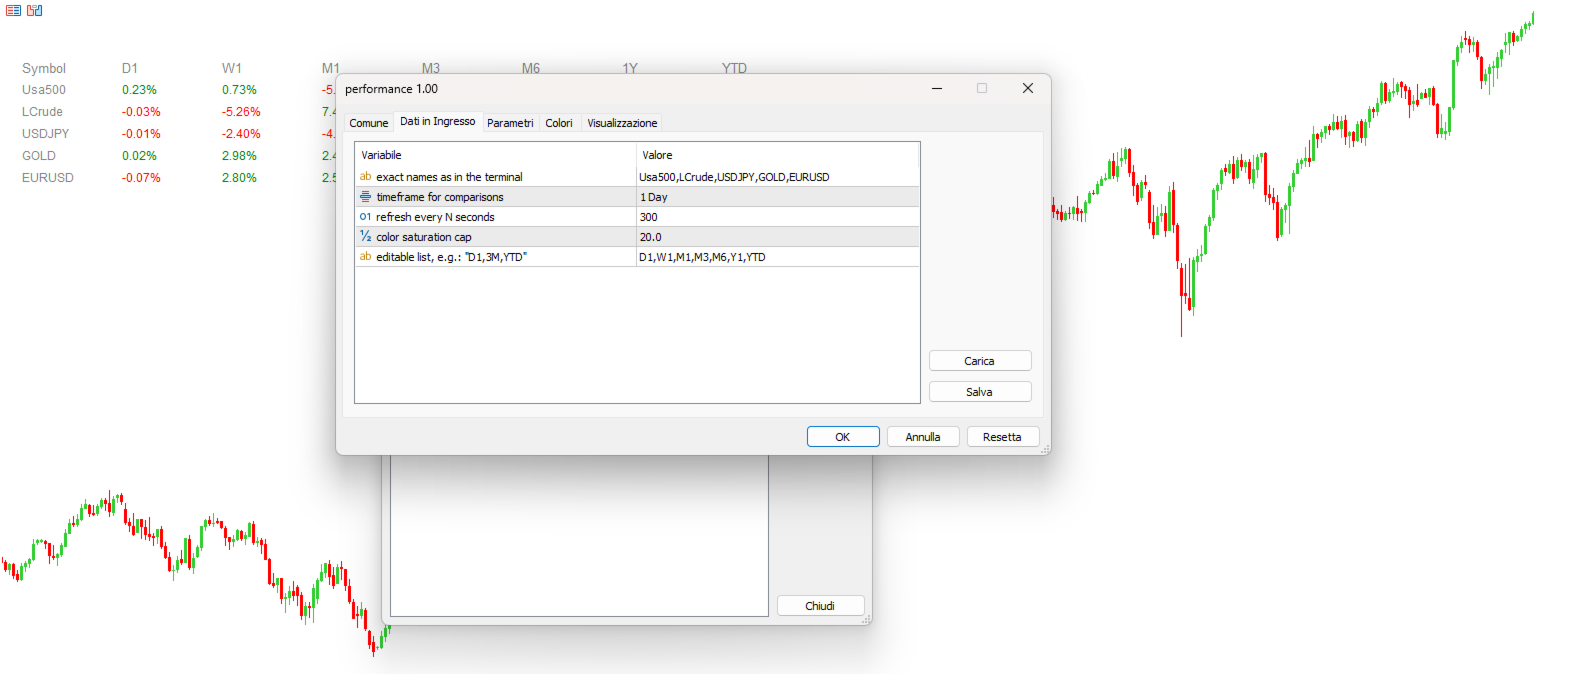
Configuration
SymbolsList: comma-separated symbols; must match exactly the names in the terminal.
BaseTF: base timeframe for calculations.
UpdateSeconds: interval in seconds for automatic refresh.
CapPercent: normalization value for color intensity.
PeriodsList: string defining the periods (e.g., D1, W1, M1, M3, M6, Y1, YTD); accepts formats like 1M, 2W, YTD.
Return Calculation
Standard periods: comparison between the current close and the close N periods ago.
YTD: uses the close nearest to the beginning of the current year for a consistent comparison.
Visual Encoding
Background: green for non-negative returns, red for negative; intensity scaled by CapPercent.
Text: green if the return is ≥ 0, red if negative, gray if data is unavailable. Dual encoding ensures readability.
Update Mechanism
A timer checks the elapsed time defined by UpdateSeconds and rebuilds the map only when allowed, with internal safeguards to prevent overly frequent refreshes.
Use Cases
-
Compare different assets across multiple horizons.
-
Monitor a portfolio to detect shifts in relative strength.
-
Modify PeriodsList in real time to explore different horizons.
Example
PeriodsList: "D1,1W,3M,YTD" — daily, weekly, 3 months, year-to-date.
Notes
-
Symbols must exist in the terminal.
-
Too frequent refreshes are internally limited; adjust UpdateSeconds carefully when using large lists.