Spread History Indicator

5

Description
Spread History is a simple yet essential indicator that displays the historical spread, candle by candle, in a separate window alongside its moving average. With a real‑time line and overlaid text on the main chart, you can easily monitor the spread applied by your broker at every market phase.

Purpose

  • Show the actual spread provided by the broker for each candle

  • Calculate and display the spread’s moving average over a configurable period

  • Overlay the current spread value and its average directly on the chart

  • Identify periods of higher spreads (e.g., market open/close, before economic news)

  • Help avoid unprofitable trades in adverse market conditions

Key Features

  • Dynamic historical spread line with customizable color

  • Simple Moving Average (SMA) of the spread over N bars

  • On‑chart label showing spread and current average

  • User‑configurable parameters: SMA period, line color, text color

  • Instant updates with zero lag

Target Users

  • Scalpers and day traders who need to avoid high spreads

  • Traders comparing different brokers or demo vs. live accounts

  • EA developers requiring consistent, low spreads

  • Analysts conducting post‑trade reviews or session optimization

Compatibility

  • Timeframes: all

  • Instruments: Forex, indices, cryptocurrencies, CFDs

  • Broker types: ECN, STP, Market Maker

Additional Tip
Combine Spread History with a market session indicator (Asia, Europe, US) to pinpoint the best trading hours more accurately.


historical spread, spread indicator, spread monitoring, spread analysis, broker spread, spread timeframe, forex spread, crypto spread, CFD spread, ECN spread, STP spread, low spread, high spread alert, spread volatility, trading session, market open, market close, news trading, scalping tool, day trading tool, intraday trading, spread SMA, spread moving average, spread dashboard, MT4 indicator, MT5 indicator, slippage indicator, session optimization, demo vs live comparison, spread risk management



Reviews 1
classicaltrading
900
classicaltrading 2026.09.16 07:39 

Perfect. Exactly what I wanted to quickly and easily visualize the spread history over time. The indicator loads in an instant - the best historical spread indicator I have seen yet.

Recommended products
Follow The Line MT5
Oliver Gideon Amofa Appiah
4.6 (35)
This indicator obeys the popular maxim that: "THE TREND IS YOUR FRIEND" It paints a GREEN line for BUY and also paints a RED line for SELL. (you can change the colors). It gives alarms and alerts of all kinds. IT DOES NOT REPAINT and can be used for all currency pairs and timeframes. Yes, as easy and simple as that. Even a newbie can use it to make great and reliable trades. NB: For best results, get my other premium indicators for more powerful and reliable signals. Get them here: https://www.m
FREE
PROMETHEUS TECHNICAN VERSION Free | By THE SONS A gift from The Sons — no strings, no trial, no expiry. Every trader deserves access to professional-grade market intelligence. That belief is why Prometheus Technical Version exists, and why it costs nothing. Consider it our handshake to the trading community. What You're Getting This is not a simplified tool dressed up as a gift. Prometheus Technican Version is a fully built, institutional-quality technical analysis indicator running a dual-model
FREE
Coral Indi
Dinh Duong Luong
Coral trend is   a trend-following indicator that is widely popular among FOREX traders . It is usually used as a confluence with other indicators. It uses combinations of moving averages with complex smoothing formulas! It has two configurable parameters: Coefficient   - smoothing ratio (*) Applied price Calculation: Coral = (-0.064) * B6 + 0.672 * B5 - 2.352 * B4 + 2.744 * B3
FREE
SC MTF Rsi MT5
Krisztian Kenedi
5 (7)
Relative Strength Index (RSI) indicator with multi-timeframe support, customizable visual signals, and configurable alert system. Freelance programming services, updates, and other TrueTL products are available on my MQL5 profile . Feedback and reviews are highly appreciated! What is RSI? Relative Strength Index (RSI) is a momentum oscillator that measures the speed and magnitude of price changes. The indicator oscillates between 0 and 100, comparing the magnitude of recent gains to recent lo
FREE
Northstar Flow Candles MT5 is a free chart indicator for traders who use Heikin Ashi candles to review trend context. Its purpose is visual analysis, with candle states and optional markers on the MetaTrader 5 chart. This is a visual tool. It does not place trades or provide popup, push or email notifications. Chart context Five candle states: strong bullish, bullish, balanced, bearish and strong bearish. Context settings based on fast and slow exponential moving averages, ADX and ATR-normalize
FREE
Mitimom
Danil Poletavkin
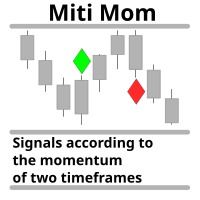
The indicator is based on Robert Miner's methodology described in his book "High probability trading strategies" and displays signals along with momentum of 2 timeframes. A Stochastic oscillator is used as a momentum indicator. The settings speak for themselves period_1 is the current timeframe, 'current' period_2 is indicated - the senior timeframe is 4 or 5 times larger than the current one. For example, if the current one is 5 minutes, then the older one will be 20 minutes The rest of the s
FREE
RSI abcd
Francisco Gomes Da Silva
3.75 (4)
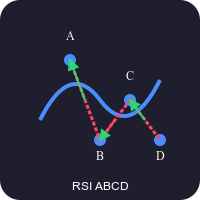
RSI ABCD Pattern Finder: Technical Strategy 1. How the Indicator Works Combines the classic RSI with automatic detection of ABCD harmonic patterns . Key Components Standard RSI (adjustable period) Peak and Trough Markers (arrows) ABCD Patterns (green/red lines) Overbought (70) and Oversold (30) Filters 2. MT5 Setup period = 14 ; // RSI period size = 4 ; // Maximum pattern size OverBought = 70 ; // Overbought level OverSold = 30 ; // Oversold level Filter = USE_FILTER_ YES ; // Confirmation filte
FREE
Dual Period Filter — Adaptive Coppock Curve for MT5 Overview The Coppock Curve is built from the sum of a long and a short rate of change, smoothed afterwards, and is used to observe the direction and strength of medium-term momentum. This indicator extends the classic calculation in two ways. First, the price source passes through an optional adaptive filter before the momentum is calculated. Nine filter types are available: None, SMA, EMA, RMA, Double WMA, Triple VWMA, HMA, LLAMA and Kalman.
FREE
VFI Quantum
Nikita Berdnikov
5 (1)
Introducing VFI (Volume Flow Indicator) – a trading indicator that analyzes the relationship between volume and price movement to identify key trading opportunities. The indicator displays the strength and direction of volume flow, providing clear signals about potential entry and exit points. Signals are formed based on zero line crossovers, crossovers between the VFI line and its exponential moving average (EMA), and when the indicator exits overbought and oversold zones. Attention! This stra
FREE
Donchian Breakout And Rsi
Mattia Impicciatore
4.33 (3)
General Description This indicator is an enhanced version of the classic Donchian Channel , upgraded with practical trading functions. In addition to the standard three lines (high, low, and middle), the system detects breakouts and displays them visually with arrows on the chart, showing only the line opposite to the current trend direction for a cleaner view. The indicator includes: Visual signals : colored arrows on breakout Automatic notifications : popup, push, and email RSI filter : to val
FREE
Fimathe PCM Indicador
Cristiano Rodrigo Olegini
5 (4)
Velas Forex FIMATHE PCM Indicator (FREE) The Velas Forex FIMATHE PCM Indicator is a free indicator designed to help traders analyze the market visually in a simple, fast, and effective way. Its purpose is to make it easier to identify market conditions through clear visual signals, allowing traders to make more confident trading decisions. Best result: 5M timeframe MT5 server time: 2:00 Management: 1 Take Profit: stop trading, wait for the next day 2 Losses: stop trading, wait for the next day
FREE
MSX Hybrid Heiken Scalper
Som Prakash Gehlot
5 (1)
MSX Hybrid Heiken Scalper Overview MSX Hybrid Heiken Scalper is a MetaTrader 5 indicator based on a modified Heiken Ashi methodology with closed-bar smoothing. The indicator is designed to display trend direction through color-coded candles while reducing sensitivity to short-term market fluctuations. All calculations are performed using completed candles, allowing historical values to remain fixed after bar close. Features • Modified Heiken Ashi calculation • Closed-bar processing • Color-code
FREE
The Bull DCA DowJones Signal – Premium Trend & Swing Indicator (WinWiFi Robot Series) Overview: Unlock the full potential of Index trading with the latest innovation from the WinWiFi Robot Series . "The Bull DCA DowJones Signal" is a precision-engineered indicator designed to conquer global Indices, Energy, and Forex markets. Optimized for the H4 Timeframe , this tool filters out market noise and delivers clear, actionable signals for Trend Following, Breakouts, and Pullbacks. Key Features & S
FREE
ThreeM Quantum Tunneling
Nguyen Duc Quy
3.6 (10)
There is a science, named Quantitative Finance, that allows to study the financial derivative pricing models using the methods of theoretical and mathematical physics. Lately I came across a paper that describes a new indicator for technical analysis that combines ideas from quantum physics and brings them to finance. I got interested in it and decided I would teach how to implement indicators based on a scientific papers in MQL5.  The original Moving Mini-Max paper [2] is written by Z.K. Silaga
FREE
VolumeBasedColorsBars
Henrique Magalhaes Lopes
VolumeBasedColorsBars — Free Powerful Volume Analysis for All Traders Unlock the hidden story behind every price bar! VolumeBasedColorsBars is a professional-grade, 100% FREE indicator that colorizes your chart candles based on real, adaptive volume analysis. Instantly spot surges in market activity, identify exhaustion, and catch the moves that matter. This indicator gives you:    • Dynamic color-coded bars for instant volume context    • Adaptive thresholds based on historical, session-awar
FREE
Reversal Composite Candles
MetaQuotes Ltd.
3.69 (16)
The idea of the system is to indentify the reversal patterns using the calculation of the composite candle. The reversal patterns is similar to the "Hammer" and "Hanging Man" patterns in Japanese candlestick analysis. But it uses the composite candle instead the single candle and doesn't need the small body of the composite candle to confirm the reversal. Input parameters: Range - maximal number of bars, used in the calculation of the composite candle. Minimum - minimal size of the composite can
FREE
Plain Simple SMA
Massimiliano Cianci
The Simple Moving Average (SMA) is a technical indicator that calculates the average price of an asset over a specific period. It smooths out price fluctuations, helping traders identify trends, support and resistance levels, and potential entry or exit points. Inputs: SMA Periods Timeframe Line Color This is a basic SMA indicator. I needed one but couldn’t find it anywhere, so I created it myself.
FREE
Are you tired of drawing trendlines every time you're analyzing charts? Or perhaps you would like more consistency in your technical analysis. Then this is for you. This indicator will draw trend lines automatically when dropped on a chart. How it works Works similar to standard deviation channel found on mt4 and mt5. It has 2 parameters: 1. Starting Bar 2. Number of bars for calculation The   starting bar   is the bar which drawing of the trend lines will begin, while the   number of bars for c
FREE
TK Rainbow
Nguyen Trung Khiem
5 (2)
TK - Rainbow Indicator Description: The TK - Rainbow indicator is a robust tool for technical analysis, designed to provide a clear view of market trends through a multi-line approach. With 30 lines calculated at different periods, it offers an extensive analysis of price movements. The indicator uses a dual-color scheme to highlight upward and downward trends, making it easy to interpret market conditions at a glance. Key Features: 30 Lines: Each line represents a different smoothing period to
FREE
Milhar do IBOV
Nilton Do Prado Ribeiro
This indicator plots the calculated levels of the IBOV's "thousand" regions on the mini-index, where there is strong institutional commitment, based on their Options Lock positions. In this sense, players tend to defend their positions, acting on the mini-index. With these regions on the chart, you can use the concept of bipolarity to seek trades both in defense and in post-breakout testing. If you're interested, see the link where B3 provides information on options positions for these price lev
FREE
Free automatic Fibonacci is an indicator that automatically plots a Fibonacci retracement based on the number of bars you select on the BarsToScan setting in the indicator. The Fibonacci is automatically updated in real time as new highest and lowest values appears amongst the selected bars. You can select which level values to be displayed in the indicator settings. You can also select the color of the levels thus enabling the trader to be able to attach the indicator several times with differe
FREE
Time Bars Ends
Jhoni Robby Susanto
5 (2)
The indicator that shows the countdown to the change of candles is equipped with an alert when the bar changes (the alert is not active if installed on the M1 time frame). Displays seconds if installed in time frame M1, displays minutes and seconds if installed in time frame above M1, and displays hours and minutes if installed in time frame h1 and above. The time displayed is calculated based on the running time.
FREE
MAPC
Pavel Gotkevitch
3 (1)
MAPC (Moving Average Percent's Change) shows the Moving Average's percent change from one period to another selected period allowing you to track the smoothed price change rate. MAPC is calculated according to the following equation: MAPC[i] = 100 * (MA[i] - MA[i - n]) / MA[i],  where: MA[i] - current Moving Average value;   MA[i - n] - value of the Moving Average that is n periods away from the current Moving Average value. Input Parameters Period - Moving Average period; Method - smoothing me
FREE
McGinley Dynamic Fusion – Trend Crossover and ATR Trade Levels McGinley Dynamic Fusion is a MetaTrader 5 (MT5) trend analysis indicator that uses the McGinley Dynamic smoothing method to help traders identify directional changes, trend crossovers, and potential trading setups while accounting for changes in market speed. Unlike a conventional moving-average crossover system, the McGinley Dynamic is designed to adapt its response to price behaviour, making it useful for traders analysing trend di
FREE
Pure Path
Jean Carlos Souza
ST Pure Path Indicator Description for Metatrader ST Pure Path Indicator Description for Metatrader This document aims to provide a clear and accessible description of the ST Pure Path indicator, developed for the Metatrader platform. It is designed to assist traders, especially those with little experience, in identifying market trends and decision points visually and intuitively. 1. Visual Identification The ST Pure Path appears on the chart as a continuous, solid line , with a thickness of 2
FREE
Donchian Pro
Paulo Henrique Faquineli Garcia
5 (3)
The Donchian Channel Channels are among the most popular tools of technical analysis, as they visually convey to the analyst the limits within which most price movement tends to occur. Channel users know that valuable information can be obtained at any time, whether prices are in the central region of a band or close to one of the border lines. One of the best known techniques to explore these concepts is Bollinger Bands. However, John Bollinger was not the only one to research the application
FREE
The indicator identifies when a divergence occurs between price and an indicator or oscillator. It identifies both regular and hidden divergences. Combined with your own rules and techniques, this indicator will allow you to create (or enhance) your own powerful system. For higher probability setups I can recommend you to use my Supply Demand indicator and trade only if the divergence occurs inside a zone. Supply zone for bearish div and demand zone for bullish div. The optimal scenario is if it
FREE
Pivot Points Indicator – a fast, reliable, and fully customizable pivot detection for MetaTrader 5. This indicator uses MetaTrader’s native iHighest and iLowest functions to identify pivot highs and lows by scanning for the highest and lowest prices within a user-defined window of bars. A pivot is confirmed only when the current bar is the absolute maximum or minimum within the selected range, ensuring accurate and timely signals based on robust built-in logic. Key Features No Repainting : Onc
FREE
IMR is a multi-layered quantitative reversal finder designed for discretionary price-action traders who refuse to trade blind. It does not generate entry signals, nor does it draw buy/sell arrows. Instead, it answers the three questions that matter most before you ever place a limit order: What is the market's statistical DNA right now? (Hurst Exponent) Is the current move backed by genuine strength, or is it exhausted? (ADX) Has price moved too far, too fast, with too much conviction — suggest
FREE
Liquidity Grab X — Liquidity Sweep & Grab Detector (MT5) Full Description Liquidity Grab X is a free rule-based indicator for MetaTrader 4 and MetaTrader 5 that identifies liquidity grabs — moments where price sweeps above a prior swing high or below a prior swing low, triggers resting stop orders, and then rejects back into range. These sweeps are commonly used by price-action and smart-money-concept (SMC) traders as a sign of exhaustion or a potential reversal trigger. How It Works Pivot Detec
FREE
Buyers of this product also purchase
Trend Sniper X
Sarvarbek Abduvoxobov
4.86 (43)
Trend Sniper X is a multi-timeframe trend-following indicator for MetaTrader 5 that helps traders identify trend direction and potential reversal points with clarity and precision. for MT4: https://www.mql5.com/en/market/product/193245 Price Information: The current price is promotional and is subject to change as upcoming updates and new features are released. Bonus Offer: To get the FREE Auto-Trade Assistant EA for this indicator, please message the author after purchasing. Code2Profit Channe
Smart Trend Trading System — MetaTrader 5 Message me on MQL5 after purchase to receive Smart Universal Expert Advisor for FREE, plus the online course, PDF manual, and private group access. STTS brings trend direction, entry and exit signals, reversal zones, and important price levels together on your chart. Follow the system manually, or connect a separate compatible EA for automated execution using your chosen settings. ONE SYSTEM. FOUR TRADING APPROACHES. STTS organizes its trading approaches
A new King in town - Indicator + Order management indications(tp1+tp2+tp3) + Optional Telegram Signal sender   INCLUDED (FREE) + Bonus EA Robot ( FULL TRADING  and SIGNAL SYSTEM ) Our best EA for Gold: Gold Slayer TRY > Reversion Queen  Expert advisor >JOIN Community Channel < NEW Free Automation EA link < click here ( disclaimer: this is new and still on testing and phase , use at your risk on demo) Free Telegram Bridge < click here  This indicator includes an advanced Strategy, a trading sys
Zoryk Gold
Reda El Koutbane
4.78 (18)
discount ends SOON next price 69 $ ZORYK — Advanced XAUUSD Signal System for MetaTrader 5 You know the feeling. You spend time analyzing gold. You wait for the entry. You finally open the trade, and price immediately moves against you. You close too early, move the Stop Loss or hesitate for a few seconds. Then the market reaches the exact destination you originally expected without you. The direction was not always the problem. The real problem was uncertainty. You did not know exactly where th
M5 Sniper
MeanFX
5 (3)
Get your trading edge in the line of sight M5 Sniper   is a new indicator by MeanFX. It combines   precise trading signals   with   adaptive TP/SL levels   - creating best possible statistical trades as a result! The price increases every 5 purchases, the next price is 79$ Message me after purchase to receive tips/guide and bonus EA Auto Optimisation only works on LIVE chart , needs data feed >JOIN Community Channel < What makes it stand out?   Proven statistical performance   on Gold XAUUSD
SuperScalp Pro
Van Minh Nguyen
4.54 (37)
SuperScalp Pro - Professional Multi-Layer Confluence Scalping System SuperScalp Pro is an advanced scalping indicator that upgrades the classic Supertrend with multiple intelligent confirmation filters. It helps you identify higher-probability Buy/Sell opportunities while significantly reducing false signals. Clear Buy and Sell arrows appear directly on the chart, along with automatic ATR-based Stop Loss and Take Profit levels calculated in real time. After purchase, please message me on MQL5 to
In 2019 I showed the whole world what this indicator can do. I traded its signals by hand, on a real account, in the open — the account was monitored live on Myfxbook, and I covered my experiment in detail on Facebook. The result: $10,000 became $941,411 in four months. The risk was deliberately extreme — the drawdown reached 54%, because in our profession profit and risk always go hand in hand. The Myfxbook screenshot is the first picture in the gallery. Looks like congratulations are in order:
ULTRA is a technical indicator that operates on an “all-in-one” basis—it independently analyzes the market, generates trading signals, displays levels for setting stop-loss orders, and suggests when to close trades to lock in profits or minimize losses. In other words, it doesn't matter if you don't know how to analyze the market, determine levels—where to set your stop-loss—or struggle with money management. ULTRA will do all of that for you! BUYER BONUS: After purchasing the ULTRA indicator, s
SMC Intraday Formula
VividMind Digital Solutions
5 (26)
Secure the Lowest Price Today. After purchase, contact via   MQL5 inbox   to receive your buyer kit and bonus. Let's be honest first. No indicator will make you profitable on its own. If someone tells you otherwise, they're selling you a dream. Every indicator that shows perfect buy/sell arrows can be made to look flawless — just zoom into the right window of history and screenshot the winners. We won't do that. SMC Intraday Formula is a tool. It reads the market structure for you, maps the hig
Gann Made Easy   is a professional and easy to use Forex trading system which is based on the best principles of trading using the theory of W.D. Gann. The indicator provides accurate BUY and SELL signals including Stop Loss and Take Profit levels. You can trade even on the go using PUSH notifications. PLEASE CONTACT ME AFTER PURCHASE TO GET TRADING  INSTRUCTIONS   AND GREAT EXTRA INDICATORS  FOR FREE! Probably you already heard about the Gann trading methods before. Usually the Gann theory is a
GoldenX Entry MT5
VividMind Digital Solutions
5 (17)
Price will increase by $20 every 10 buyers to maintain premium value. After purchase, contact via   MQL5 inbox   to receive your buyer kit and bonus. You have probably tested dozens of indicators before. But we are not here to be “just another signals indicator.” Behind GoldenX Entry is intensive research & development focused on building sophisticated algorithms designed to adapt to the real behavior of every instrument — not generic signals recycled everywhere else. From advanced Auto Optim
M1 Sniper MT5
Oleg Rodin
5 (7)
M1 SNIPER  is an easy to use trading indicator system. It is an arrow indicator which is designed for M1 time frame. The indicator can be used as a standalone system for scalping on M1 time frame and it can be used as a part of your existing trading system. Though this trading system was designed specifically for short-term trading, it still can be helpful for all traders. This trading system can be used with any forex pair and time frame, though lower time frames are recommended from M1 up to M
Gold Entry Sniper
Tahir Mehmood
5 (21)
Gold Entry Sniper – Professional Multi-Timeframe ATR Dashboard for Gold Scalping & Swing Trading Gold Entry Sniper is a cutting-edge MetaTrader 5 indicator designed to give traders precise buy/sell signals for XAUUSD and other symbols, powered by ATR Trailing Stop logic and a multi-timeframe analysis dashboard . Built for both scalpers and swing traders, it combines real-time market direction , dynamic stop levels , and professional visual dashboards to help you identify high-probability gold en
Auto Optimized SpeedAngle is an institutional-grade momentum vectoring system that eliminates curve-fitting through continuous Walk-Forward Optimization (WFO). Rather than relying on static inputs that degrade when market regimes shift, the indicator dynamically recalibrates its parameters using Out-of-Sample (OOS) validation, ensuring the displayed signals represent genuine statistical edges rather than historical anomalies. By shifting the focus from subjective visual angles to normalized, qua
Gold Trend Coach MT5
Cristhian Alexander Gaibor Cuasquer
5 (3)
Gold Trend Coach is a gold (XAUUSD) trend indicator for MetaTrader 5 with buy and sell signals, stop loss and three take profit targets, confirmed on bar close, a multi-timeframe coach dashboard and alerts to your phone and Telegram. Built for M5 scalping and M15 intraday during the London and New York sessions. Gold Trend Coach: XAUUSD gold trend signals with entry, stop and three targets. Launch price $39 for the first 20 copies, next price $59. Write me after purchase and your buyer kit is o
Next Update — Version 2.52 Coming Soon! [NEW] Get Ready for 4 Major New Features Designed to Enhance Your Market Analysis and Trading Workflow We’re taking market analysis to the next level with 4   new features designed to meet your trading needs. Introducing: TRADE OVERVIEW DASHBOARD CONFLUENCE AT ZONE STRONG & WEAK HIGH/LOW OPTIMAL TRADE ENTRY  —   OTE 1. TADE OVERVIEW DASHBOARD  A dashboard that helps you understand the overall market picture more easily, providing guidance to support yo
Atomic Analyst MT5
Issam Kassas
4.5 (64)
Atomic Analyst — MetaTrader 5 Message me on MQL5 after purchase to receive Smart Universal Expert Advisor for FREE, plus the online course, PDF manual, and private group access. Atomic Analyst brings price action, trend direction, entry and exit signals, Stop Loss and multiple Take Profit levels together on your chart. SEE THE SIGNAL. UNDERSTAND THE SETUP. Atomic Analyst organizes its analysis into clear visual information: • Buy and sell arrows to identify potential entries. • Stop Loss and mul
Boba Analysis Suite
Trade Ready Solutions LLC
5 (2)
Boba Analysis Suite Boba Analysis Suite is an analytical indicator for MetaTrader 5. It brings market structure, relevant price zones and broader market context together in a single chart view. Developed through practical experience as a trader and trading coach, it supports a structured analysis process: assessing market direction, identifying important levels and considering multiple timeframes together. Analysis in Context Individual signals gain meaning through context. Boba Analysis Suite h
Azimuth Pro
Ottaviano De Cicco
5 (7)
Azimuth Pro V2: Synthetic Fractal Structure and Confirmed Entries for MT5 Overview Azimuth Pro is a multi-level swing structure indicator by Merkava Labs . Four nested swing layers, swing-anchored VWAP, ABC pattern detection, three-timeframe structural filtering, and closed-bar confirmed entries — one chart, one workflow from micro-swings to macro-cycles. This is not a blind signal product. It is a structure-first workflow for traders who care about location, context, and timing. Halloween P
Zain Gold Scalping
Ahmed Gamal Abdel Nasser Mohamed
A complete price-action analysis tool built around dual independent entry logic, each confirmed against a volatility band, combined with a configurable set of nine optional confirmation filters that let you shape exactly how conservative or aggressive the tool's signals behave. Core Strategy Two independent entry setups, each triggering only when price moves outside a dynamic volatility band — giving two distinct ways to spot potential reversal points, which can be used together or separately.
FiboSniper Pro
Van Minh Nguyen
5 (4)
FiboSniper Pro - Multi-Filter Fibonacci System with Auto SL/TP and Control Panel FiboSniper Pro is a technical indicator that combines dynamic Fibonacci Envelopes with multiple confirmation filters to generate selective Buy and Sell signals. Fibonacci levels are calculated from Moving Average and ATR, then filtered by ADX, EMA, RSI, ATR, Volume, Time and Candle structure. The indicator displays automatic ATR-based Stop Loss and Take Profit levels directly on the chart, along with an interactive
Power Candles MT5
Daniel Stein
4.58 (12)
Power Candles - Self-Optimizing Strength Indicator Strength usually lives in a sub-window. The line runs below, the candle above, and your eye keeps connecting the two. Power Candles puts the strength into the candle itself, colored from dark red to dark green, so the chart reads at a glance and the sub-window stays closed. The indicator also finds its own settings for the symbol and timeframe in front of you. One click on [ Apply Best ] draws entry, Stop Loss and Take Profit at the exact prices
Quantum TrendPulse
Bogdan Ion Puscasu
5 (26)
Introducing Quantum TrendPulse , the ultimate trading tool that combines the power of SuperTrend , RSI , and Stochastic into one comprehensive indicator to maximize your trading potential. Designed for traders who seek precision and efficiency, this indicator helps you identify market trends, momentum shifts, and optimal entry and exit points with confidence. Key Features: SuperTrend Integration: Easily follow the prevailing market trend and ride the wave of profitability. RSI Precision: Detect
Tokyo mt5 Indicator
Vasiliy Strukov
5 (14)
Tokyo Indicator provides a clear visual overview of trend direction, potential trading signals, and market conditions. Its colour-coded, stepped trend line distinguishes bullish phases in blue from bearish phases in magenta. Matching directional arrows highlight potential buying and selling opportunities when the displayed trend changes. An integrated dashboard brings together the current signal, market bias, momentum, volatility, and signal quality in one convenient view. This allows traders t
Adaptive Price Action Engine Buy Indicator- Get EA Based on it for FREE. Self-Optimizing Multi-Timeframe Trend & Candlestick Intelligence Markets do not behave the same way all the time—and not every price-action pattern has the same value in every market regime. Adaptive Price Action Engine is designed to adapt to changing market conditions by combining trend structure, multi-timeframe analysis, candlestick patterns, and statistical optimization into one analytical framework. Two Adaptive Mode
Superhero
Ihor Otkydach
5 (3)
The SUPERHERO indicator is a multi-currency trading system designed on an "all-inclusive" basis. The indicator independently analyzes the market and provides signals on when to open and close trades. It uses Stop Loss and Take Profit orders. The R:R ratio is 1:1. This system can send push notifications to your smartphone, so you can place trades "on the go" without needing to be tied to a PC. It's perfect for proprietary trading firms. A BONUS FOR EVERY CUSTOMER: Every buyer of this indicator wi
Trend Catcher ind mt5
Ramil Minniakhmetov
5 (18)
TREND CATCHER INDICATOR Trend Catcher Indicator analyzes market price movements, using a combination of the author’s proprietary and customized adaptive trend-analysis indicators.  It identifies the true market direction by filtering out short-term noise and focusing on underlying momentum strength, volatility expansion, and price structure behavior.  It also uses a combination of smoothing and trend-filtering customized indicators such as moving averages, RSI, and volatility filters.   Real ope
Multi Currency Strength and Momentum Indicator MT5 Dynamic Forex28 Navigator is the evolution of our long-time, popular indicators, combining the power of three into one: Advanced Currency Strength28 Indicator (700 reviews) Advanced Currency IMPULSE with ALERT (530 reviews) CS28 Combo Signals (recent Bonus) The two predecessor indicators together have received more than 1,200 reviews on the MQL5 Market and have been a staple in the MT4 community since 2016. Dynamic Forex28 Navigator MT5 carries
Apex Patterns PRO Buy Indicator - Get Expert Advisor Based on it for FREE. Self-Optimizing Chart Pattern & Breakout Intelligence Traditional pattern scanners rely on fixed inputs, often underperforming when market volatility and structures shift. Apex Patterns PRO is designed to adapt to changing market conditions by combining structural chart pattern recognition, momentum filtering, and statistical self-optimization into one analytical framework. Adaptive Scanning Engine Self-Optimizing Patter
Crystal Heikin Ashi Signals
Muhammad Jawad Shabir
5 (5)
Crystal Heikin Ashi Signals—Professional Trend & Signal Detection Indicator Advanced Heikin Ashi Visualization with Intelligent Signal System for Manual & Automated Trading Final Price: $149 ---------> Price goes up $10 after every 10 sales . Limited slots available — act fast . Overview User Guide PDF Crystal Heikin Ashi Signals is a professional-grade MetaTrader 5 indicator that combines pure Heikin Ashi candle visualization with an advanced momentum-shift detection system. Designed for both m
More from author
Smart Volume Profile
Mattia Impicciatore
4.73 (15)
Smart Volume Profile is a professional volume profile indicator that calculates and displays in real time the distribution of volumes between two vertical lines, with buy/sell split and POC, VAH, VAL levels. Designed for both discretionary and systematic trading, it allows you to see where the market traded the most and how buying and selling pressure was distributed within the selected period. Why this indicator Full control of the analysis period thanks to two draggable VLINEs that define the
FREE
Overview This indicator monitors three types of support and resistance levels derived from previous periods: Daily (yesterday’s high and low), Weekly (last week), and Monthly (last month). It visually maps key price levels where reactions are more likely, making it valuable for identifying potential reversals as well as significant breakouts . Features Automatically draws: High/Low of yesterday (Daily) High/Low of the previous week (Weekly) High/Low of the previous month (Monthly) Each level has
FREE
Bollinger RSI ReEntry
Mattia Impicciatore
5 (3)
Expert Advisor Version If you prefer automated trading instead of manual signals, you can find the Expert Advisor version of this indicator here: https://www.mql5.com/en/market/product/148222 This indicator computes price reentry moments after a candle has pierced outside the Bollinger Bands , combining that signal with an RSI confirmation to reduce false positives. A Buy ReEntry signal is detected when price had moved below the lower band and then returns inside, with the optional confirmati
FREE
Description Candlestick Pattern Analyzer is an advanced tool for both discretionary and systematic traders, designed to automatically identify major Japanese candlestick patterns and deliver a detailed statistical analysis of their historical performance. This indicator is perfect for those who want to verify the real-world effectiveness of patterns and use them alongside confirmation filters (e.g., trend, key levels, volume) and a well‑defined risk‑management strategy. Key Features Automatic
Donchian Breakout And Rsi
Mattia Impicciatore
4.33 (3)
General Description This indicator is an enhanced version of the classic Donchian Channel , upgraded with practical trading functions. In addition to the standard three lines (high, low, and middle), the system detects breakouts and displays them visually with arrows on the chart, showing only the line opposite to the current trend direction for a cleaner view. The indicator includes: Visual signals : colored arrows on breakout Automatic notifications : popup, push, and email RSI filter : to val
FREE
Bollinger RSI ReEntry MT4
Mattia Impicciatore
5 (2)
Description (MT4) This indicator detects price reentry moments after a candle has pierced outside the Bollinger Bands, combining that signal with an optional RSI confirmation to reduce false positives. A Buy ReEntry signal is generated when price has moved below the lower band and then returns inside, optionally confirmed by the RSI just exiting an oversold condition. A Sell ReEntry signal is generated when price has moved above the upper band and then reenters, optionally confirmed by the RSI
FREE
Opening range
Mattia Impicciatore
1 (1)
Opening‑Range Sessions (GMT‑Aware) is a lightweight indicator that automatically draws the opening range — high, low, and a color‑filled box — for the main FX liquidity windows: Sydney, Tokyo, London and New York . The indicator detects your broker‑server time‑zone on the fly, so every session starts at the correct local moment, no matter where the server (or the trader) is located. Key features Automatic Time‑Zone Detection – Uses the server’s GMT offset; no manual time adjustment required when
FREE
Market Phase Analyzer
Mattia Impicciatore
3.75 (4)
General Description Clear indicators and simple rules to read the three key phases of the market. This indicator identifies in real time an accumulation phase based on the Asian session, detects any liquidity sweeps during the manipulation phase, and confirms the directional phase during distribution. It displays green arrows for the bullish phase and red arrows for the bearish phase, draws the Asia box with customizable color and border, and optionally shows the daily open line for quick intra
FREE
Advanced Economic Calendar Indicator This indicator displays all upcoming economic events directly on the chart, highlighting relevant news for the selected pair or instrument. It allows traders to anticipate high-volatility moments and plan their strategies with accuracy. Main Features Display of future events up to 5 days ahead (customizable). Filtering by news impact level (high, medium, low). Option to show vertical event lines and numbered markers for quick identification. Fully customizabl
FREE
False Breakout MT4
Mattia Impicciatore
False Breakout MT4 is an indicator designed to spot cases where price briefly breaks a recent support or resistance level and then quickly returns to the prior range. These false breakouts are valuable for discretionary analysis or contrarian trading approaches, providing visual cues without making predictive or automatic decisions. Main Features: Automatic detection of false breakouts around recent highs and lows (e.g., extended daily levels over two days). Clear visual representation with arro
FREE
False Breakout Detector
Mattia Impicciatore
5 (1)
Expert Advisor Version If you prefer automated trading instead of manual signals, you can find the Expert Advisor version of this indicator here: https://www.mql5.com/en/market/product/148310 False Breakout Detector is an indicator designed to identify situations where the price temporarily breaks a recent support or resistance level but quickly returns to the previous range. These false breakouts can be useful for discretionary analysis or contrarian trading strategies. Main Features: Automat
FREE
Description Market Phase Analyzer is an advanced indicator designed to identify the three main market phases: Accumulation , Manipulation , and Distribution . Through automatic session analysis, the indicator draws the Asia Box , detects sweep moves above or below key levels, and confirms reversals with the ATR filter to reduce false signals. Main Features Highlights the Asian session range with a customizable box. Automatic detection of bullish or bearish sweeps. Optional ATR filter for signal
FREE
SR PrevPeriods MT4 Overview SR PrevPeriods automatically plots the previous day’s, previous week’s, and previous month’s high and low directly on your MetaTrader 4 chart in real time. It’s a lightweight indicator designed to highlight historical support and resistance zones, which often align with price reaction areas, breakouts, and rebalancing points. What it does It draws horizontal lines at key previous levels and, if desired, text labels showing the exact value. The lines update automatic
FREE
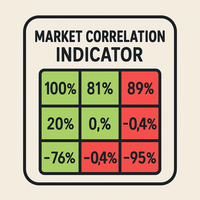
General Description This indicator calculates in real time the Pearson correlation coefficient between multiple financial instruments. It displays a dynamic correlation matrix that shows the strength and direction of relationships among currencies, indices, stocks, and commodities. Main Parameters SymbolsList : list of instruments to compare (comma separated) BarsToAnalyze : number of historical bars used for calculation TimeFrame : timeframe for correlation analysis Correlation Interpretation
FREE
SMA ReEntry MT4
Mattia Impicciatore
5 (1)
Description SMA Reentry is an indicator for MetaTrader 4 designed to identify reentry points within the main trend. It uses two Simple Moving Averages: a fast one to capture short-term movements and a slow one to filter the overall market direction. A buy signal occurs when the fast SMA is above the slow SMA and the price moves back above the fast SMA after being below it on the previous candle. A sell signal occurs when the fast SMA is below the slow SMA and the price moves back below it after
FREE
Short Description: A powerful tool to measure trend efficiency and filter market noise. Toggle between a sleek line chart or a color-coded histogram with threshold alerts. Key Features: Dual Plot Styles: Line (RSI-like) or colored histogram (Trend/Neutral/Range). Configurable Thresholds: Set your own upper (trend) and lower (range) levels. Multi-Mode Visualization: Clear visual cues—green for strong trends, gray for consolidation, red for ranging markets. Flexible Period: Adjustable calculation
FREE
SMA ReEntry
Mattia Impicciatore
1 (1)
What is SMA Reentry SMA Reentry is a professional indicator that signals reentry points in the direction of the trend using two simple moving averages (SMA): one fast and one slow. The indicator clearly shows when the price re-enters above or below the fast moving average, in the presence of a trend defined by the slow SMA. It is the ideal tool for those seeking clear pullback, breakout, and trend reentry signals. How It Works Identifies the main trend through the crossover of the fast and slow
FREE
Fair Value Gap Zone
Mattia Impicciatore
General Description The Fair Gap Value Indicator identifies and highlights “fair value gaps” on the MetaTrader 5 chart. A fair gap occurs when a price void forms between the low of one bar and the high of another, separated by an intermediate bar. The indicator draws colored rectangles (bullish and bearish) to emphasize these areas, providing clear visual support for price-action strategies. Key Features Bullish Gap Detection : highlights gaps between a bar’s low and the high of two bars prior w
FREE
ATR crossover histogram
Mattia Impicciatore
5 (1)
ATR Volatility Histogram for MT5 – Technical Volatility Analysis This indicator calculates and displays the difference between a fast ATR and a slow ATR as a histogram, allowing you to visualize changes in market volatility in real time. Calculation Volatility Difference = Fast ATR - Slow ATR Interpretation Positive values (green bars) indicate rising volatility and can confirm breakout momentum. Negative values (red bars) indicate falling volatility, potential consolidation, or loss of moment
FREE
Body Ratio Indicator for MT5 – Candle Strength and Compression Analyzer The Body Ratio Indicator is a technical tool for analyzing candlestick structure and identifying market conditions based on the ratio between the candle’s body (open-close) and its total range (high-low). This simple yet powerful calculation helps traders detect strong momentum candles, indecision candles, and range compression phases, which often precede major breakouts. Each candlestick is categorized in real time: Weak c
FREE
Candlestick Pattern Analyzer for MT4 Description Candlestick Pattern Analyzer is an advanced tool for both discretionary and systematic traders, built to automatically detect major Japanese candlestick patterns and deliver a detailed statistical breakdown of their historical performance. This indicator is perfect for those who want to objectively verify the real-world effectiveness of patterns and combine them with confirmation filters (e.g., trend, key levels, volume) and a well-defined risk m
Description: NR4 & NR7 Inside Bar Highlighter is an indicator that automatically detects price compression patterns based on a combination of NR4 or NR7 with an Inside Bar. The NR4 (Narrow Range 4) pattern identifies the candle with the smallest range among the last 4 bars, while NR7 considers the last 7. When this narrow-range condition occurs alongside an Inside Bar (a candle completely contained within the previous one), it often signals a low-volatility phase that may precede a strong breako
FREE
Simple Range Filter
Mattia Impicciatore
Simple Range Filter is an indicator designed to highlight candles with high or low volatility . It calculates the average range (High - Low) over a defined number of candles and dynamically adjusts the thresholds based on market conditions. Main Features: Dynamic calculation of average range Visual highlighting of bars with above or below-average range Configurable parameters for colors and calculation period Real-time updates (tick-by-tick) Use Cases: Helps identify periods of low volatility (
FREE
Description: NR4 & NR7 Inside Bar Highlighter for MetaTrader 4 is an indicator that automatically detects price compression patterns based on the combination of NR4 or NR7 with an Inside Bar . How it works: The NR4 (Narrow Range 4) pattern identifies the candle with the smallest range among the last 4 bars, while NR7 considers the last 7. When this narrow-range condition occurs alongside an Inside Bar (a candle completely contained within the previous one), it often signals a low-volatility ph
FREE
Description Volatility ATR Crossover Histogram is an indicator for MetaTrader 4 that measures the expansion and contraction of volatility by comparing a fast ATR with a slow ATR. The result is displayed in a colored histogram in a separate window. Green bars indicate an increasing volatility phase, while red bars indicate decreasing volatility. It is designed as a universal filter for entry timing, trade management, and market regime detection. How it works The indicator calculates two ATRs w
FREE
Overview Performance Indicator shows a heatmap of percentage returns for a list of symbols over configurable time intervals. It is used to visually compare relative strength and weakness , without giving any guarantee of results. Configuration SymbolsList: comma-separated symbols; must match exactly the names in the terminal. BaseTF: base timeframe for calculations. UpdateSeconds: interval in seconds for automatic refresh. CapPercent: normalization value for color intensity. PeriodsList: stri
FREE
What is Bias Finder The Bias Finder (with Export) is an advanced indicator designed to detect and analyze market statistical biases, providing a clear visualization of recurring tendencies. This tool is especially useful for both discretionary and systematic traders who want to integrate quantitative analysis into their trading strategies. Analysis Modes The indicator calculates and displays price bias according to different time logics: Hourly Bias : statistical analysis hour by hour. Weekday B
Bias Seasonal Pattern Analyzer for MT5 – Real-Time Seasonal Bias Analysis Bias Finder is an advanced tool for seasonal market analysis, designed to clearly display average profits generated during different time-based segments: Hourly Bias – shows the most profitable hours of the day Weekday Bias – reveals the best-performing day of the week for each symbol Day‑of‑Month Bias – analyzes behavior at the start and end of each month Monthly Bias – ideal for long-term seasonal or monthly trend analy
Download ready-to-use set files for Bollinger RSI ReEntry EA: https://c.mql5.com/31/1515/bollinger-rsi-Ea-Sets.zip Introduction Bollinger RSI ReEntry EA is an Expert Advisor for MetaTrader that combines Bollinger Bands and RSI to detect high-probability entry points. The strategy is designed to identify market re-entries after volatility spikes, with confirmation filters to increase signal reliability. Key Features Bollinger Bands Strategy : detects breakouts and re-entries at the bands for acc
False Breakout EA MT5
Mattia Impicciatore
Download ready-to-use set files for False Breakout EA: https://c.mql5.com/31/1514/False-Breakout-EA.zip False Breakout EA is an Expert Advisor designed to detect and exploit false breakouts on key support and resistance levels. The system uses daily candle analysis to identify re-entries after false breakouts, with an optional RSI confirmation filter to increase signal reliability. Trading logic Automatic detection of false breakouts on support and resistance. Optional RSI confirmation to filt
Filter:
classicaltrading
900
classicaltrading 2026.09.16 07:39 

Perfect. Exactly what I wanted to quickly and easily visualize the spread history over time. The indicator loads in an instant - the best historical spread indicator I have seen yet.

Reply to review