Fair Value Gap Zone

General Description

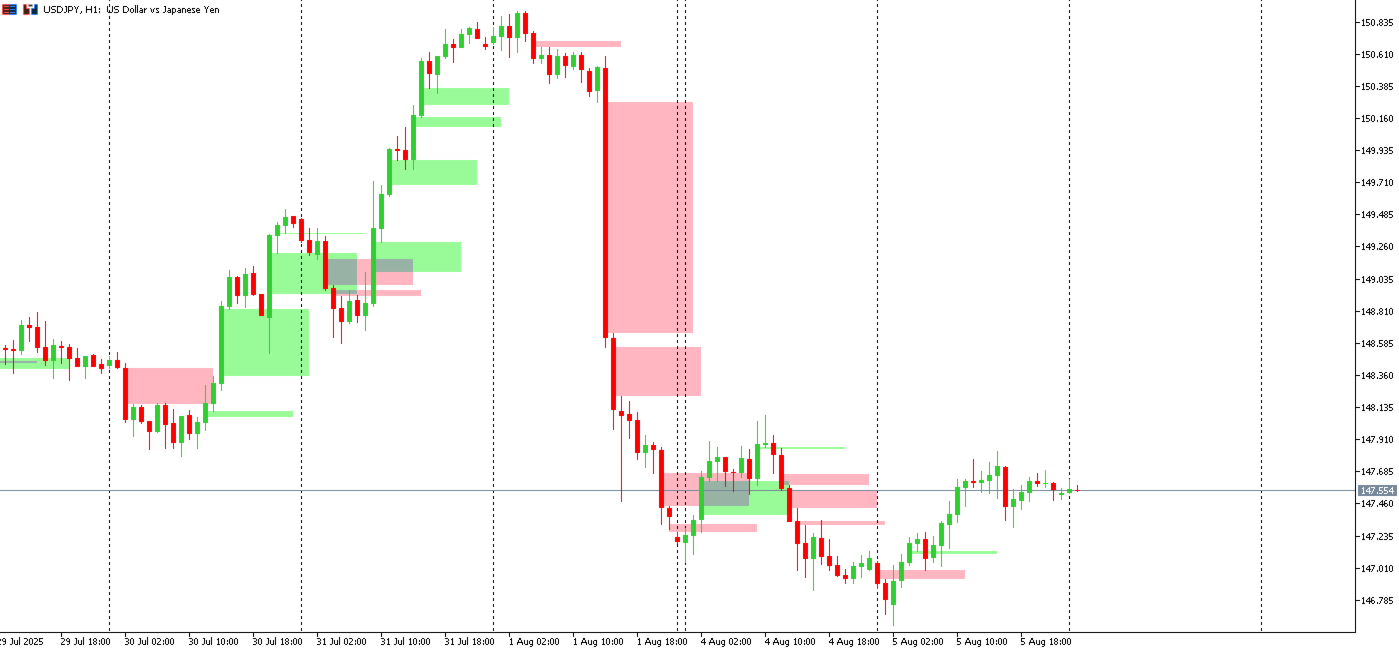
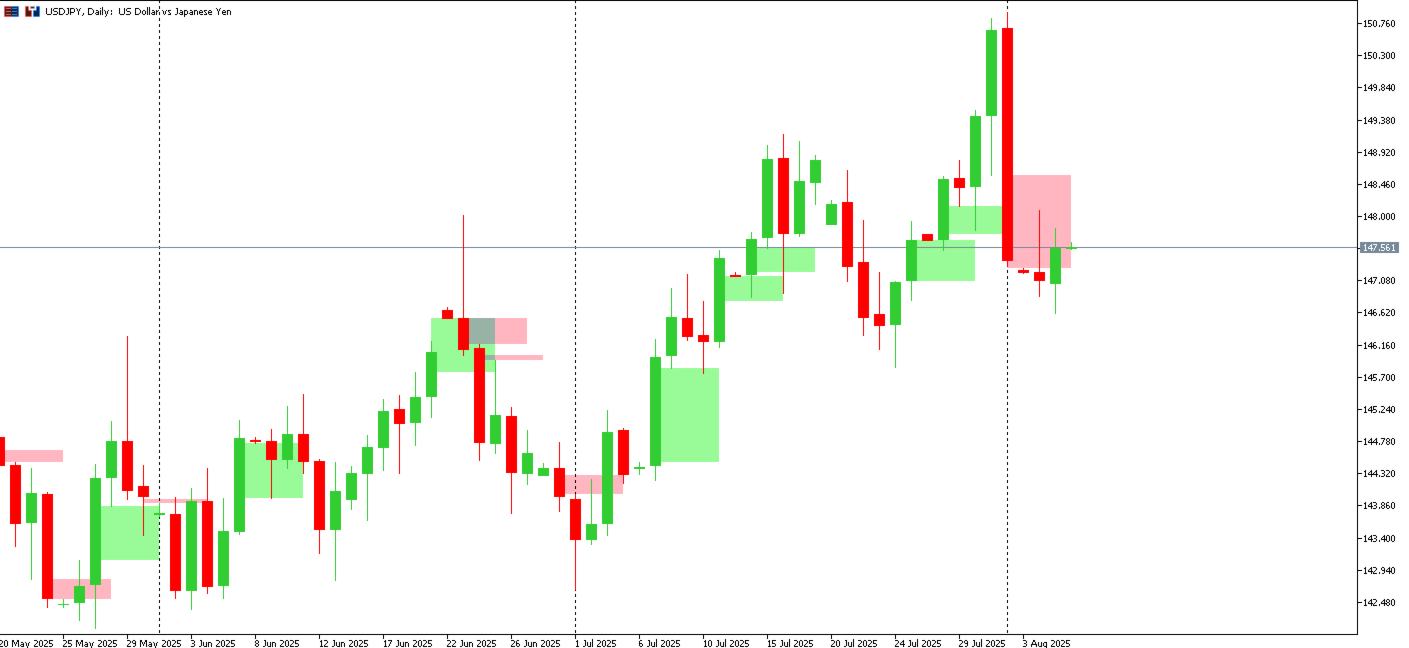
The Fair Gap Value Indicator identifies and highlights “fair value gaps” on the MetaTrader 5 chart. A fair gap occurs when a price void forms between the low of one bar and the high of another, separated by an intermediate bar. The indicator draws colored rectangles (bullish and bearish) to emphasize these areas, providing clear visual support for price-action strategies.

Key Features

  • Bullish Gap Detection: highlights gaps between a bar’s low and the high of two bars prior with green rectangles.

  • Bearish Gap Detection: highlights inverse gaps with red rectangles.

  • Dynamic Extension: ability to extend rectangles by a variable number of bars to the right.

  • Transparency Control: configurable opacity level to avoid obscuring the underlying chart.

  • Toggle Flags: options to enable or disable bullish and bearish gap plotting separately.

  • Historical Limit: optional limit on the number of bars scanned to improve performance on large datasets.

  • Automatic Cleanup: on timeframe change or first load, all previous gaps are removed and recreated.
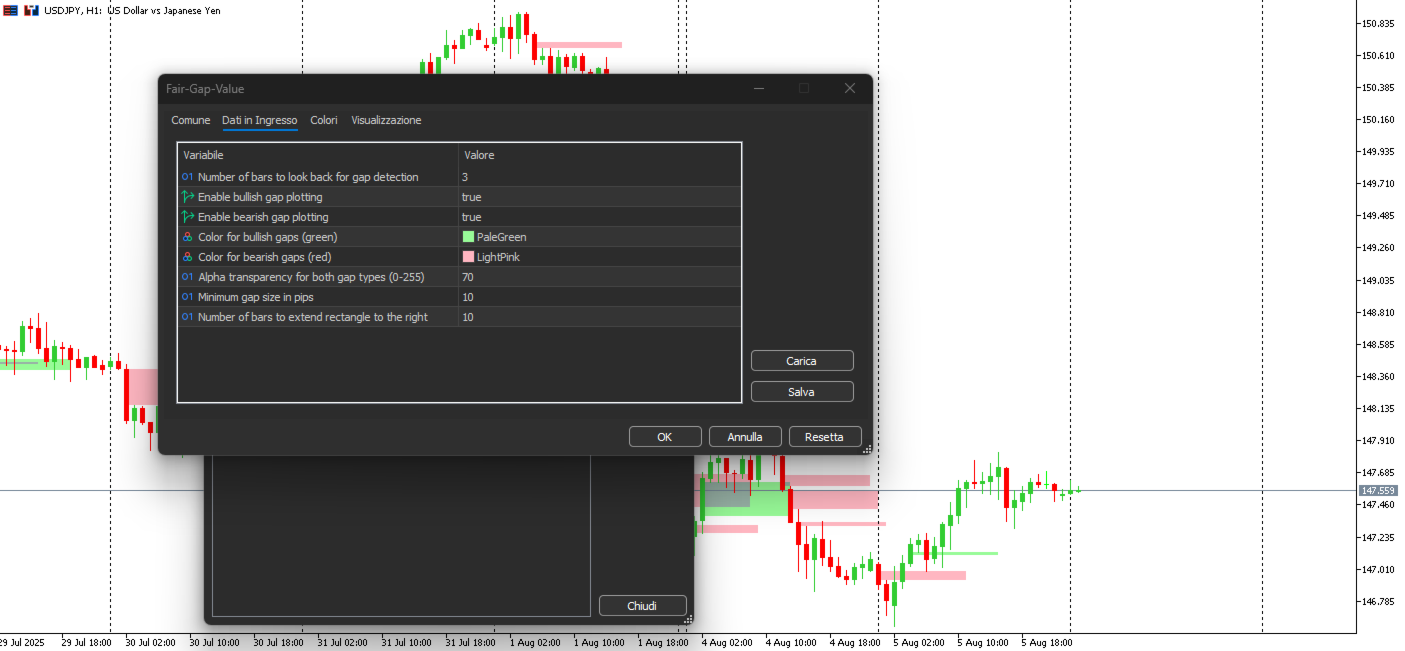
Input Parameters

  • LookbackBars: number of bars to look back for gap calculation (default 3).

  • MaxBars: maximum number of bars to scan (0 = no limit; default 0).

  • ShowBullGaps: enable/disable bullish gap plotting (default true).

  • ShowBearGaps: enable/disable bearish gap plotting (default true).

  • BullGapColor: color for bullish gaps (default green).

  • BearGapColor: color for bearish gaps (default red).

  • GapTransparency: rectangle transparency (0 = fully opaque, 255 = invisible; default 70).

  • MinGapPips: minimum gap size in pips to consider (default 10).

  • ExtendBars: additional bars to extend rectangles to the right (default 0).

How It Works

  1. Initialization: configures the buffer and removes any existing gap objects.

  2. Scanning: for each bar (within the MaxBars limit), computes the up-gap (low minus high) and down-gap (vice versa).

  3. Threshold Check: considers only gaps with size ≥ MinGapPips .

  4. Rectangle Creation: draws rectangles from the start point to the number of bars defined by ExtendBars , applying color and transparency.

  5. Updating: on timeframe change or first run, clears and redraws all gaps to ensure consistency.

Advantages

  • Visual Clarity: quickly identifies potential areas of interest.

  • Flexibility: separate controls for gap type, color, transparency, extension, and historical range.

  • Efficiency: automatic object management and optional bar limit to preserve performance.

Usage Tips

Combine the indicator with volume or trend filters to confirm gap validity. Adjust MaxBars and ExtendBars according to your timeframe and instrument volatility.


fair value gap, value gap zone, fair value gap indicator, bullish gap detection, bearish gap detection, MT5 gap indicator, MetaTrader 5 gap tool, price void detection, gap rectangle overlay, dynamic gap extension, transparency control, gap type toggle, historical gap limit, automatic gap cleanup, fair gap scanner, gap threshold filter, minimum gap pips, extendable rectangles, price-action gaps, gap zone analysis, chart gap overlay, fair gap strategy, gap alert system, gap zone dashboard, gap scanning tool, fair gap visualization, gap detection MT5, support-resistance gap, gap analysis tool, gap zone indicator


Recommended products
Macro-R Pro Signal — Advanced Trading Signal Indicator Macro-R Pro Signal is a professional trading indicator designed to deliver high-quality BUY and SELL signals with enhanced precision and reduced market noise. By combining Bollinger Bands, RSI, and adaptive volatility filtering , this indicator helps traders identify high-probability reversal points while avoiding unfavorable market conditions. How the Strategy Works This indicator is built on a mean reversion + momentum confirmation concep
FREE
Raymond Cloudy Day
The Hung Ngo
5 (3)
Raymond Cloudy Day Indicator for MT5 – Pivot-Based Reversal and Trend Levels Raymond Cloudy Day Indicator is a pivot-based level indicator for MetaTrader 5 (MT5). It was developed by Ngo The Hung based on Raymond’s original idea and is designed to give a structured view of potential reversal zones, trend extensions and support/resistance levels directly on the chart. The default settings are optimised for XAUUSD on the H1 timeframe, but the indicator can be tested and adjusted for other symbols
FREE
Simple Weis Wave
Jean Jacques Huve Ribeiro
3.67 (3)
One of the best tools for analyzing volume, Weis Wave was idelized by David Weis, to facilitate the reading of directional flow. For the VSA method disciples it is an evolution of the practices created by Richard Wycoff, facilitating a predictive reading of the market, always seeking an accumulation and distribution of the negotiated contracts. Cumulative wave volume  Range of wave ( removed) Average Wave volume Ref "Tim Ord lectures" ( removed)
FREE
The indicator highlights the points that a professional trader sees in ordinary indicators. VisualVol visually displays different volatility indicators on a single scale and a common align. Highlights the excess of volume indicators in color. At the same time, Tick and Real Volume, Actual range, ATR, candle size and return (open-close difference) can be displayed. Thanks to VisualVol, you will see the market periods and the right time for different trading operations. This version is intended f
FREE
VWAP Anchor Tool
Jackson Mukurani Wanguthi
Anchored VWAP is a lightweight, interactive volume-weighted average price indicator designed for traders who need precision without clutter. Unlike standard VWAP that resets every session, this tool lets you drop up to five custom anchors directly on any candle. Each anchor calculates VWAP from that exact point forward, complete with standard deviation bands to highlight where price may find support or resistance relative to volume. Key Features: • Up to 5 simultaneous anchors — compare multi
FREE
English VWAP Daily (Clean) is a simple and lightweight indicator that plots the classic Daily VWAP (Volume Weighted Average Price) directly on your MT5 chart. Features: Classic Daily VWAP calculation Supports real volume (if available) or tick volume Timezone offset option to match your broker’s server time Weekend merge option (merge Saturday/Sunday data into Friday) Clean version → no arrows, no alerts, only VWAP line VWAP is widely used by institutional traders to identify fair value, su
FREE
VolumeBasedColorsBars
Henrique Magalhaes Lopes
VolumeBasedColorsBars — Free Powerful Volume Analysis for All Traders Unlock the hidden story behind every price bar! VolumeBasedColorsBars is a professional-grade, 100% FREE indicator that colorizes your chart candles based on real, adaptive volume analysis. Instantly spot surges in market activity, identify exhaustion, and catch the moves that matter. This indicator gives you:    • Dynamic color-coded bars for instant volume context    • Adaptive thresholds based on historical, session-awar
FREE
Basic Vwap
james mugendi
4 (1)
Simple Vwap with the daily, weekly and monthly VWAP is the abbreviation for   volume-weighted average price , which is a technical analysis tool that shows the ratio of an asset's price to its total trade volume. It provides traders and investors with a measure of the average price at which a stock is traded over a given period of time. How it's used Identify entry and exit points:   Traders can use VWAP to determine when to buy or sell an asset.   Understand price trends :  Traders can use V
FREE
Auto Fibonacci Retracement Indicator — Flexible and Reliable This isn’t just another Auto Fibonacci Retracement indicator. It’s one of the most flexible and dependable tools available . If you find it useful, please consider leaving a review or comment — your feedback means a lot! Check out my other helpful tools below: Smart Alert Manager   - Set up advanced alerts and send them to Mobile, Telegram, Discord, Webhook... Timeframes Trend Scanner    - Scan the trend of assets in difference timefr
FREE
Free automatic Fibonacci is an indicator that automatically plots a Fibonacci retracement based on the number of bars you select on the BarsToScan setting in the indicator. The Fibonacci is automatically updated in real time as new highest and lowest values appears amongst the selected bars. You can select which level values to be displayed in the indicator settings. You can also select the color of the levels thus enabling the trader to be able to attach the indicator several times with differe
FREE
Automatic Trendlines
Pasi Hakamaki
4.68 (50)
The indicator draws trendlines on chart. This indicator has six inputs. User can specify alternative labels for both lines. If multiple instances of the indicator are used, the labels must differ. User can set width and color of the lines and depth which specifies what significant peaks should be used. For example, Depth=10 sets trendlines using the current peaks and valleys that have at least 10 bars to the right and to the left and that have highs/lows less/greater than the peak's high/low. In
FREE
The Volume Weighted ATR indicator is a helpful tool for measuring market activity. It is based on the idea of the Volume-Weighted ATR. Combining these two elements helps identify potential turning points or breakout opportunities. The indicator for the classification of the activity of the market uses the moving average and its multiples. Accordingly, where the VWATR bar is located (relative to the moving average), it is labelled as ultra-low, low, average, high, very high or ultra high. The Vo
FREE
LT Donchian Channel
Thiago Duarte
4.86 (7)
Donchian Channel is an indicator created by Richard Donchian. It is formed by taking the highest high and the lowest low of the last specified period in candles. The area between high and low is the channel for the chosen period. Its configuration is simple. It is possible to have the average between the upper and lower lines, plus you have alerts when price hits one side. If you have any questions or find any bugs, please contact me. Enjoy!
FREE
MACD Enhanced
Nikita Berdnikov
5 (3)
Introducing the MACD  Enhanced – an advanced MACD (Moving Average Convergence Divergence) indicator that provides traders with extended capabilities for trend and momentum analysis in financial markets. The indicator uses the difference between the fast and slow exponential moving averages to determine momentum, direction, and strength of the trend, creating clear visual signals for potential entry and exit points. Attention! To achieve the best results, it is recommended to adapt the indicator
FREE
HTF Candles Nika overlays full-size candles from any higher timeframe directly onto your current chart in MetaTrader 5. It gives you a clear multi-timeframe view without leaving your chart. Key Features - Draws higher timeframe candles as filled rectangles with wicks on the current chart - Supports standard candlestick and Heiken Ashi display modes - Live countdown timer showing time remaining until the current HTF candle closes - Customizable colors for bullish and bearish candles - Auto or m
FREE
VWAP Diaria
Samuel De Souza Ferreira
Daily VWAP — Institutional Reference for Intraday Value The Daily VWAP is a professional indicator based on the Volume-Weighted Average Price (VWAP) , designed to reveal the true balance between price and volume throughout the trading session. Unlike traditional moving averages, the Daily VWAP incorporates the weight of traded volume in every price movement, providing a much more accurate reference to the behavior of institutional traders and large market participants. What the indicator deliver
FREE
SmartPullback
Samuel Jesus Fidalgo Lopez
Smart Pullback Pro v4 High-Probability Pullback Indicator for MT5 Smart Pullback Pro v4 is a professional trend-following indicator for MetaTrader 5 that identifies high-probability pullback entries in real time. It automatically plots entry zones, Stop Loss, and Take Profit levels directly on the chart, giving traders a complete visual trading plan with every signal. How It Works Smart Pullback Pro v4 combines multiple confluence filters to eliminate low-quality signals and focus only on va
FREE
Weis Waves
Flavio Javier Jarabeck
2.83 (18)
The original author is David Weis, an expert in the Wyckoff Method. The Weis Wave is a modern adaptation of the 1930's Wyckoff Method, another expert in Tape Reading techniques and Chart Analysis. Weis Waves takes market volume and stacks it into waves according to price conditions giving the trader valuable insights about the market conditions. If you want to learn more about this subject you can find tons of videos in YouTube. Just look for "The Wickoff Method", "Weis Wave" and "Volume Spread
FREE
Pivot Points Indicator – a fast, reliable, and fully customizable pivot detection for MetaTrader 5. This indicator uses MetaTrader’s native iHighest and iLowest functions to identify pivot highs and lows by scanning for the highest and lowest prices within a user-defined window of bars. A pivot is confirmed only when the current bar is the absolute maximum or minimum within the selected range, ensuring accurate and timely signals based on robust built-in logic. Key Features No Repainting : Onc
FREE
My Candle Patterns
Francisco Gomes Da Silva
5 (1)
This indicator is a demo version of the complete My candle, which can be downloaded here: Candle Patterns Creator With the full version, you can create your own candle rules and modify a traditional candle pattern to be more accurate according to your strategy. The indicator includes several example candle rules, but here I will demonstrate only a few: Pattern Rule Candle Green C > O Candle Red C < O Doji C = O Hammer (C > O and (C-O) *2 < O-L and (C-O) *0.5 > H-C) or (C < O and (O-C) *2 < C-L a
FREE
PZ Penta O MT5
PZ TRADING SLU
3.5 (4)
The Penta-O is a 6-point retracement harmonacci pattern which usually precedes big market movements. Penta-O patterns can expand and repaint quite a bit. To make things easier this indicator implements a twist: it waits for a donchian breakout in the right direction before signaling the trade. The end result is an otherwise repainting indicator with a very reliable trading signal. The donchian breakout period is entered as an input. [ Installation Guide | Update Guide | Troubleshooting | FAQ | A
FREE
PROMETHEUS TECHNICAN VERSION Free | By THE SONS A gift from The Sons — no strings, no trial, no expiry. Every trader deserves access to professional-grade market intelligence. That belief is why Prometheus Technical Version exists, and why it costs nothing. Consider it our handshake to the trading community. What You're Getting This is not a simplified tool dressed up as a gift. Prometheus Technican Version is a fully built, institutional-quality technical analysis indicator running a dual-model
FREE
Value Chart Candlesticks
Flavio Javier Jarabeck
4.57 (14)
The idea of a Value Chart indicator was presented in the very good book I read back in 2020 , " Dynamic Trading Indicators: Winning with Value Charts and Price Action Profile ", from the authors Mark Helweg and David Stendahl. The idea is simple and the result is pure genius: Present candlestick Price analysis in a detrended way! HOW TO READ THIS INDICATOR Look for Overbought and Oversold levels. Of course, you will need to test the settings a lot to find the "correct" one for your approach. It
FREE
Friend of the Trend: Your Trend Tracker Master the market with Friend of the Trend , the indicator that simplifies trend analysis and helps you identify the best moments to buy, sell, or wait. With an intuitive and visually striking design, Friend of the Trend analyzes price movements and delivers signals through a colorful histogram: Green Bars : Signal an uptrend, indicating buying opportunities. Red Bars : Alert to a downtrend, suggesting potential selling points. Orange Bars : Represent cons
FREE
VFI Quantum
Nikita Berdnikov
5 (1)
Introducing VFI (Volume Flow Indicator) – a trading indicator that analyzes the relationship between volume and price movement to identify key trading opportunities. The indicator displays the strength and direction of volume flow, providing clear signals about potential entry and exit points. Signals are formed based on zero line crossovers, crossovers between the VFI line and its exponential moving average (EMA), and when the indicator exits overbought and oversold zones. Attention! This stra
FREE
Golden Delta Library — Free MT5 Tools Market Description Short Description Golden Delta Library is a free MT5 toolkit for traders who want cleaner chart structure, Renko-based context, risk planning, and practical execution panels. The collection includes Renko indicators, SuperTrend / ADX Renko variants, XAUUSD helper panels, and RiskLab TradeDesk tools. Each product is designed to be lightweight, visual, and useful on live charts without promising automated profits or replacing trader judgme
FREE
Are you tired of drawing trendlines every time you're analyzing charts? Or perhaps you would like more consistency in your technical analysis. Then this is for you. This indicator will draw trend lines automatically when dropped on a chart. How it works Works similar to standard deviation channel found on mt4 and mt5. It has 2 parameters: 1. Starting Bar 2. Number of bars for calculation The   starting bar   is the bar which drawing of the trend lines will begin, while the   number of bars for c
FREE
Easy VWAP
Luca Spinello
VWAP Indicator, the short form of Volume Weighted Average Price, is similar to a moving average but takes into consideration the tick volume of the candles. The indicator calculates the moving average multiplying the price of each candle for the tick volume in the candle. Said calculation weighs with more significance price where more transactions were made. Features: Visual styling customizable Period customizable Ease of use
FREE
MA Color Candles Indicator MA Color Candles is an indicator for visually displaying market trends by coloring chart candles. It does not add objects or distort price data, instead coloring real candles based on the state of two moving averages. This enables quick trend assessment and use as a filter in trading strategies. How It Works Bullish trend: Fast MA above slow MA, slow MA rising (green candles). Bearish trend: Fast MA below slow MA, slow MA falling (red candles). Neutral state: Candles
FREE
High Low Open Close
Alexandre Borela
4.98 (44)
If you like this project, leave a 5 star review. This indicator draws the open, high, low and closing prices for the specified period and it can be adjusted for a specific timezone. These are important levels looked by many institutional and professional traders and can be useful for you to know the places where they might be more active. The available periods are: Previous Day. Previous Week. Previous Month. Previous Quarter. Previous year. Or: Current Day. Current Week. Current Month. Current
FREE
Buyers of this product also purchase
SuperScalp Pro
Van Minh Nguyen
4.63 (24)
SuperScalp Pro – Advanced Multi-Filter Scalping Indicator System SuperScalp Pro is an advanced scalping indicator that combines the classic Supertrend with multiple intelligent confirmation filters to help identify trading opportunities. It works efficiently across multiple timeframes from M1 to H4, with optimized performance on XAUUSD, BTCUSD, and major Forex pairs. The indicator provides clear Buy and Sell signals, along with automatically calculated entry price, stop loss, and take profit lev
Divergence Bomber
Ihor Otkydach
4.9 (89)
Each buyer of this indicator also receives the following for free: The custom utility "Bomber Utility", which automatically manages every trade, sets Stop Loss and Take Profit levels, and closes trades according to the rules of this strategy Set files for configuring the indicator for various assets Set files for configuring Bomber Utility in the following modes: "Minimum Risk", "Balanced Risk", and "Wait-and-See Strategy" A step-by-step video manual to help you quickly install, configure, and s
Gold Entry Sniper
Tahir Mehmood
5 (9)
Gold Entry Sniper – Professional Multi-Timeframe ATR Dashboard for Gold Scalping & Swing Trading Gold Entry Sniper is a cutting-edge MetaTrader 5 indicator designed to give traders precise buy/sell signals for XAUUSD and other symbols, powered by ATR Trailing Stop logic and a multi-timeframe analysis dashboard . Built for both scalpers and swing traders, it combines real-time market direction , dynamic stop levels , and professional visual dashboards to help you identify high-probability gold en
Entry In The Zone and SMC Multi Timeframe is a real-time 2-in-1 market analysis tool that combines market structure analysis and a No Repaint BUY / SELL signal system into a single indicator, built on Smart Money Concepts (SMC) — a widely adopted framework used by professional traders to understand market structure. This indicator helps you see the market more clearly, make decisions based on structure rather than guesswork, and focus on high-probability zones where price is more likely to react
SignalTech MT5 is an unique fully rule based trading system for EURUSD, USDCHF, USDJPY, AUDUSD, NZDUSD, EURJPY, AUDJPY, NZDJPY, CADJPY.  All the winning trades with chart setups are published on the comments page. 2026-05 3458 Pips (Until 05-20 NY Closed) 2026-04 2243 Pips 2026-03 2165 Pips 2026-02 2937 Pips 2026-01 2624 Pips 2025-12 1174 Pips It can generate signals with Buy/Sell Arrows and Pop-Up/Sound Alerts. Each signal has clear Entry and Stop Loss levels, which should be automatically flag
Azimuth Pro
Ottaviano De Cicco
5 (7)
Azimuth Pro V2: Synthetic Fractal Structure and Confirmed Entries for MT5 Overview Azimuth Pro is a multi-level swing structure indicator by Merkava Labs . Four nested swing layers, swing-anchored VWAP, ABC pattern detection, three-timeframe structural filtering, and closed-bar confirmed entries — one chart, one workflow from micro-swings to macro-cycles. This is not a blind signal product. It is a structure-first workflow for traders who care about location, context, and timing. V2 Launch Offe
Power Candles MT5
Daniel Stein
5 (8)
Power Candles V3 - Self-Optimizing Strength Indicator Power Candles V3 turns currency and instrument strength into an actionable trade plan on every chart it is attached to. Instead of just coloring candles, it runs a live auto-optimization in the background and hands you the best Stop Loss, Take Profit and signal threshold for the symbol in front of you. One click adopts it for live trading - entry, Stop Loss and Take Profit rays appear on the chart at the exact prices, and alerts fire with dir
Let's be honest first. No indicator will make you profitable on its own. If someone tells you otherwise, they're selling you a dream. Every indicator that shows perfect buy/sell arrows can be made to look flawless — just zoom into the right window of history and screenshot the winners. We won't do that. SMC Intraday Formula is a tool. It reads the market structure for you, maps the highest-probability price zones, and tells you exactly what the smart money footprint looks like right now — in pl
ARIPoint
Temirlan Kdyrkhan
1 (1)
ARIPoint is a powerful trading companion designed to generate high-probability entry signals with dynamic TP/SL/DP levels based on volatility. Built-in performance tracking shows win/loss stats, PP1/PP2 hits, and success rates all updated live. Key Features: Buy/Sell signals with adaptive volatility bands Real-time TP/SL/DP levels based on ATR Built-in MA Filter with optional ATR/StdDev volatility Performance stats panel (Success, Profit/Loss, PP1/PP2) Alerts via popup, sound, push, or email Cu
Gann Made Easy   is a professional and easy to use Forex trading system which is based on the best principles of trading using the theory of W.D. Gann. The indicator provides accurate BUY and SELL signals including Stop Loss and Take Profit levels. You can trade even on the go using PUSH notifications. PLEASE CONTACT ME AFTER PURCHASE TO GET TRADING  INSTRUCTIONS   AND GREAT EXTRA INDICATORS   FOR FREE! Probably you already   heard   about the Gann trading methods before. Usually the Gann theory
FX Trend MT5 NG
Daniel Stein
5 (4)
FX Trend NG: The Next Generation Multi-Market Trend Intelligence Overview FX Trend NG is a professional multi-timeframe trend and market monitoring tool designed to give you a complete structural overview of the market in seconds. Instead of switching between dozens of charts, you instantly see which symbols are trending, where momentum is fading, and where strong alignment exists across timeframes. This tool is part of the Stein Investments ecosystem - 18+ tools plus Max, your 1-on-1 AI tradi
New Update of   Smart Trend Trading System MT5 For  2026 Market: If You Buy this Indicator you will Get my Professional Trade Manager + EA  for FREE . First of all Its worth emphasizing here that this Trading System is Non-Repainting   , Non Redrawing and Non Lagging Indicator Which makes it ideal from both manual and robot trading .  [Online course] , [manual] and [download presets] . The Smart Trend Trading System MT5 is a comprehensive trading solution tailored for new and experienced traders
Trend Screener Pro MT5
STE S.S.COMPANY
4.85 (104)
Trend Screener Indicator --Professional Trend Trading & Market Scanning System for MetaTrader Unlock the true power of trend trading with Trend Screener Indicator — a complete multi-currency, multi-timeframe trend analysis solution powered by Fuzzy Logic,Trend Pulse Technology  and advanced market structure algorithms.   Trend Screener transforms your MetaTrader platform into a professional-grade Trend Analyzer and Market Scanner, helping you identify high-probability trend opportunities, early
KT Alpha Hunter Arrows MT5
KEENBASE SOFTWARE SOLUTIONS
Most arrow indicators give you a signal and leave you to figure out the rest. KT Alpha Hunter Arrows gives you the full trading plan. Every signal arrow prints with a full plan already drawn: entry line, stop-loss, four take-profit levels, and a live edge verdict telling you whether this symbol and time-frame is worth trading right now. An included Trade Manager EA handles the execution after you enter, so discipline stays intact when the market gets loud. Non-repaint. Closed-bar signals only. B
GoldenX Entry MT5
Kareem Abbas
5 (5)
You have probably tested dozens of indicators before.  But we are not here to be “just another signals indicator.” Behind GoldenX Entry is intensive research & development focused on building sophisticated algorithms designed to adapt to the real behavior of every instrument — not generic signals recycled everywhere else. From advanced Auto Optimizer technology that automatically discovers the best settings for every timeframe, to detailed historical performance analysis and market-adaptive l
FX Power MT5 NG
Daniel Stein
5 (31)
FX Power: Analyze Currency Strength for Smarter Trading Decisions Overview FX Power is your go-to tool for understanding the real strength of currencies and Gold in any market condition. By identifying strong currencies to buy and weak ones to sell, FX Power simplifies trading decisions and uncovers high-probability opportunities. Whether you’re looking to follow trends or anticipate reversals using extreme delta values, this tool adapts seamlessly to your trading style. Don’t just trade—trade
Market Structure Order Block Dashboard MT5 is an MT5 indicator designed for traders who want to read market structure and the main price reaction zones directly on the chart. It combines BOS, ChoCH, Order Blocks, Fair Value Gaps (FVG), Liquidity, Kill Zones, Volume Profile, and a compact dashboard for quick analysis. This indicator targets traders who use market structure, ICT and Smart Money concepts as a decision framework. It can help spot trend continuations, possible reversals, price imbala
Introducing   Quantum Breakout PRO , the groundbreaking MQL5 Indicator that's transforming the way you trade Breakout Zones! Developed by a team of experienced traders with trading experience of over 13 years,   Quantum Breakout PRO   is designed to propel your trading journey to new heights with its innovative and dynamic breakout zone strategy. Quantum Breakout Indicator will give you signal arrows on breakout zones with 5 profit target zones and stop loss suggestion based on the breakout b
Gem SIGNAL
Shengzu Zhong
5 (1)
GEM Signal Pro GEM Signal Pro is a trend-following indicator for MetaTrader 5, designed for traders who want clearer signals, more structured trade setups, and practical risk management directly on the chart. Instead of showing only a simple arrow, GEM Signal Pro helps present the full trade idea in a cleaner and more readable way. When conditions are confirmed, the indicator can display the entry price, stop loss, and take profit targets on the chart, helping traders review the setup more effic
Trend Forecaster
Alexey Minkov
5 (7)
Trend Forecaster – Since 2023. The Trend Forecaster indicator utilizes a unique proprietary algorithm to determine entry points for a breakout trading strategy. The indicator identifies price clusters, analyzes price movement near levels, and provides a signal when the price breaks through a level. The Trend Forecaster indicator is suitable for all financial assets, including currencies (Forex), metals, stocks, indices, and cryptocurrencies. You can also adjust the indicator to work on any time
Btmm state engine pro
Garry James Goodchild
5 (4)
BTMM State Engine Pro is a MetaTrader 5 indicator for traders who use the Beat The Market Maker approach: Asian session context, kill zone timing, level progression, peak formation detection, and a multi-pair scanner from a single chart. It combines cycle state logic with a built-in scanner dashboard so you do not need the same tool on many charts at once. What it does Draws the Asian session range; session times can follow broker server offset or be set in inputs. Tracks level progression (L
Atomic Analyst MT5
Issam Kassas
3.94 (31)
New Update of   Atomic Analyst MT5 For  2026 Market: If You Buy this Indicator you will Get my Professional   Trade Manager + EA  for   FREE . First of all Its worth emphasizing here that this Trading Indicator is   Non-Repainting   , Non Redrawing and Non Lagging Indicator   Indicator, Which makes it ideal from both manual and robot trading.  User manual: settings, inputs and strategy . The Atomic Analyst  is a PA Price Action Indicator that uses Strength and Momentum of the price to find a bet
This dashboard shows the latest available   harmonic patterns   for the selected symbols, so you will save time and be more efficient /   MT4 version . Free Indicator:   Basic Harmonic Pattern Comparison of "Basic Harmonic Pattern" vs. "Basic Harmonic Patterns Dashboard" Indicators Feature Basic Harmonic Pattern Basic Harmonic Patterns Dashboard Functionality Detects and displays harmonic patterns on a single chart Searches multiple symbols and timeframes for harmonic patterns, displays res
FX Levels MT5
Daniel Stein
5 (13)
FX Levels: Exceptionally Accurate Support & Resistance for All Markets Quick Overview Looking for a reliable way to pinpoint support and resistance levels across any market—currencies, indices, stocks, or commodities? FX Levels merges our traditional “Lighthouse” method with a forward-thinking dynamic approach, offering near-universal accuracy. By drawing from real-world broker experience and automated daily plus real-time updates, FX Levels helps you identify reversal points, set profit targe
OrderFlux | Footprint Orderflow for MetaTrader 5 Version 2.0 – Real-time Bid/Ask Visualization for Active Traders OrderFlux is a footprint and orderflow indicator for MT5. It shows not only where the price has moved, but what happens inside the movement: Bid/Ask volume per price level, delta, imbalance, and volume distribution. Many charts only show you the final result of a candle. OrderFlux shows you the path to get there. This is exactly what helps when you want to read market participation i
Quantum TrendPulse
Bogdan Ion Puscasu
5 (25)
Introducing Quantum TrendPulse , the ultimate trading tool that combines the power of SuperTrend , RSI , and Stochastic into one comprehensive indicator to maximize your trading potential. Designed for traders who seek precision and efficiency, this indicator helps you identify market trends, momentum shifts, and optimal entry and exit points with confidence. Key Features: SuperTrend Integration: Easily follow the prevailing market trend and ride the wave of profitability. RSI Precision: Detect
RelicusRoad Pro MT5
Relicus LLC
4.96 (24)
RelicusRoad Pro: Quantitative Market Operating System 70% OFF LIFETIME ACCESS (LIMITED TIME) - JOIN 2,000+ TRADERS Why do most traders fail even with "perfect" indicators? Because they trade Single Concepts in a vacuum. A signal without context is a gamble. To win consistently, you need CONFLUENCE . RelicusRoad Pro is not a simple arrow indicator. It is a complete Quantitative Market Ecosystem . It maps the "Fair Value Road" price travels on, distinguishing between random noise and true structur
Grabber System MT5
Ihor Otkydach
4.83 (23)
Let me introduce you to an excellent technical indicator – Grabber, which works as a ready-to-use "All-Inclusive" trading strategy. Within a single code, it integrates powerful tools for technical market analysis, trading signals (arrows), alert functions, and push notifications. Every buyer of this indicator also receives the following for free: Grabber Utility for automatic management of open orders Step-by-step video guide: how to install, configure, and trade with the indicator Custom set fi
First of all Its worth emphasizing here that this Trading Tool is Non Repainting , Non Redrawing and Non Lagging Indicator , Which makes it ideal for professional trading . [Online course] ,   and   [manual] The Smart Price Action Concepts Indicator is a very powerful tool for both new and experienced traders . It packs more than 20 useful indicators into one , combining advanced trading ideas like Inner Circle Trader Analysis and Smart Money Concepts Trading Strategies . This indicator focuses
Trend Lines PRO MT5
Roman Podpora
5 (1)
TREND LINES PRO  -   helps understand where the market is truly changing direction. The indicator shows real trend reversals and points where major players re-enter. You see   BOS lines   Trend changes and key levels on higher timeframes — without complex settings or unnecessary noise. Signals don't repaint and remain on the chart after the bar closes. MT4 VERSION   - Reveals its maximum potential when combined with the   RFI LEVELS PRO   indicator What the indicator shows: Real shifts   trend
More from author
Smart Volume Profile
Mattia Impicciatore
4.71 (7)
Smart Volume Profile is a professional volume profile indicator that calculates and displays in real time the distribution of volumes between two vertical lines, with buy/sell split and POC, VAH, VAL levels. Designed for both discretionary and systematic trading, it allows you to see where the market traded the most and how buying and selling pressure was distributed within the selected period. Why this indicator Full control of the analysis period thanks to two draggable VLINEs that define the
FREE
Support and Resistance MultiTime
Mattia Impicciatore
4.75 (4)
Overview This indicator monitors three types of support and resistance levels derived from previous periods: Daily (yesterday’s high and low), Weekly (last week), and Monthly (last month). It visually maps key price levels where reactions are more likely, making it valuable for identifying potential reversals as well as significant breakouts . Features Automatically draws: High/Low of yesterday (Daily) High/Low of the previous week (Weekly) High/Low of the previous month (Monthly) Each level has
FREE
Bollinger RSI ReEntry
Mattia Impicciatore
5 (3)
Expert Advisor Version If you prefer automated trading instead of manual signals, you can find the Expert Advisor version of this indicator here: https://www.mql5.com/en/market/product/148222 This indicator computes price reentry moments after a candle has pierced outside the Bollinger Bands , combining that signal with an RSI confirmation to reduce false positives. A Buy ReEntry signal is detected when price had moved below the lower band and then returns inside, with the optional confirmati
FREE
Download ready-to-use set files for Bollinger RSI ReEntry EA: https://c.mql5.com/31/1515/bollinger-rsi-Ea-Sets.zip Introduction Bollinger RSI ReEntry EA is an Expert Advisor for MetaTrader that combines Bollinger Bands and RSI to detect high-probability entry points. The strategy is designed to identify market re-entries after volatility spikes, with confirmation filters to increase signal reliability. Key Features Bollinger Bands Strategy : detects breakouts and re-entries at the bands for acc
Donchian Breakout And Rsi
Mattia Impicciatore
4.5 (2)
General Description This indicator is an enhanced version of the classic Donchian Channel , upgraded with practical trading functions. In addition to the standard three lines (high, low, and middle), the system detects breakouts and displays them visually with arrows on the chart, showing only the line opposite to the current trend direction for a cleaner view. The indicator includes: Visual signals : colored arrows on breakout Automatic notifications : popup, push, and email RSI filter : to val
FREE
Market Phase Analyzer
Mattia Impicciatore
4 (3)
General Description Clear indicators and simple rules to read the three key phases of the market. This indicator identifies in real time an accumulation phase based on the Asian session, detects any liquidity sweeps during the manipulation phase, and confirms the directional phase during distribution. It displays green arrows for the bullish phase and red arrows for the bearish phase, draws the Asia box with customizable color and border, and optionally shows the daily open line for quick intra
FREE
Opening range
Mattia Impicciatore
Opening‑Range Sessions (GMT‑Aware) is a lightweight indicator that automatically draws the opening range — high, low, and a color‑filled box — for the main FX liquidity windows: Sydney, Tokyo, London and New York . The indicator detects your broker‑server time‑zone on the fly, so every session starts at the correct local moment, no matter where the server (or the trader) is located. Key features Automatic Time‑Zone Detection – Uses the server’s GMT offset; no manual time adjustment required when
FREE
Bollinger RSI ReEntry MT4
Mattia Impicciatore
5 (2)
Description (MT4) This indicator detects price reentry moments after a candle has pierced outside the Bollinger Bands, combining that signal with an optional RSI confirmation to reduce false positives. A Buy ReEntry signal is generated when price has moved below the lower band and then returns inside, optionally confirmed by the RSI just exiting an oversold condition. A Sell ReEntry signal is generated when price has moved above the upper band and then reenters, optionally confirmed by the RSI
FREE
Candlestick Pattern Analyzer for MT4 Description Candlestick Pattern Analyzer is an advanced tool for both discretionary and systematic traders, built to automatically detect major Japanese candlestick patterns and deliver a detailed statistical breakdown of their historical performance. This indicator is perfect for those who want to objectively verify the real-world effectiveness of patterns and combine them with confirmation filters (e.g., trend, key levels, volume) and a well-defined risk m
Expert Advisor Version If you prefer automated trading instead of manual signals, you can find the Expert Advisor version of this indicator here: https://www.mql5.com/en/market/product/148310 False Breakout Detector is an indicator designed to identify situations where the price temporarily breaks a recent support or resistance level but quickly returns to the previous range. These false breakouts can be useful for discretionary analysis or contrarian trading strategies. Main Features: Automat
FREE
False Breakout MT4
Mattia Impicciatore
False Breakout MT4 is an indicator designed to spot cases where price briefly breaks a recent support or resistance level and then quickly returns to the prior range. These false breakouts are valuable for discretionary analysis or contrarian trading approaches, providing visual cues without making predictive or automatic decisions. Main Features: Automatic detection of false breakouts around recent highs and lows (e.g., extended daily levels over two days). Clear visual representation with arro
FREE
Description Market Phase Analyzer is an advanced indicator designed to identify the three main market phases: Accumulation , Manipulation , and Distribution . Through automatic session analysis, the indicator draws the Asia Box , detects sweep moves above or below key levels, and confirms reversals with the ATR filter to reduce false signals. Main Features Highlights the Asian session range with a customizable box. Automatic detection of bullish or bearish sweeps. Optional ATR filter for signal
FREE
Advanced Economic Calendar Indicator This indicator displays all upcoming economic events directly on the chart, highlighting relevant news for the selected pair or instrument. It allows traders to anticipate high-volatility moments and plan their strategies with accuracy. Main Features Display of future events up to 5 days ahead (customizable). Filtering by news impact level (high, medium, low). Option to show vertical event lines and numbered markers for quick identification. Fully customizabl
FREE
SR PrevPeriods MT4 Overview SR PrevPeriods automatically plots the previous day’s, previous week’s, and previous month’s high and low directly on your MetaTrader 4 chart in real time. It’s a lightweight indicator designed to highlight historical support and resistance zones, which often align with price reaction areas, breakouts, and rebalancing points. What it does It draws horizontal lines at key previous levels and, if desired, text labels showing the exact value. The lines update automatic
FREE
SMA ReEntry
Mattia Impicciatore
1 (1)
What is SMA Reentry SMA Reentry is a professional indicator that signals reentry points in the direction of the trend using two simple moving averages (SMA): one fast and one slow. The indicator clearly shows when the price re-enters above or below the fast moving average, in the presence of a trend defined by the slow SMA. It is the ideal tool for those seeking clear pullback, breakout, and trend reentry signals. How It Works Identifies the main trend through the crossover of the fast and slow
FREE
ATR crossover histogram
Mattia Impicciatore
5 (1)
ATR Volatility Histogram for MT5 – Technical Volatility Analysis This indicator calculates and displays the difference between a fast ATR and a slow ATR as a histogram, allowing you to visualize changes in market volatility in real time. Calculation Volatility Difference = Fast ATR - Slow ATR Interpretation Positive values (green bars) indicate rising volatility and can confirm breakout momentum. Negative values (red bars) indicate falling volatility, potential consolidation, or loss of moment
FREE
General Description This indicator calculates in real time the Pearson correlation coefficient between multiple financial instruments. It displays a dynamic correlation matrix that shows the strength and direction of relationships among currencies, indices, stocks, and commodities. Main Parameters SymbolsList : list of instruments to compare (comma separated) BarsToAnalyze : number of historical bars used for calculation TimeFrame : timeframe for correlation analysis Correlation Interpretation
FREE
Description Spread History is a simple yet essential indicator that displays the historical spread, candle by candle, in a separate window alongside its moving average. With a real‑time line and overlaid text on the main chart, you can easily monitor the spread applied by your broker at every market phase. Purpose Show the actual spread provided by the broker for each candle Calculate and display the spread’s moving average over a configurable period Overlay the current spread value and its av
FREE
SMA ReEntry MT4
Mattia Impicciatore
5 (1)
Description SMA Reentry is an indicator for MetaTrader 4 designed to identify reentry points within the main trend. It uses two Simple Moving Averages: a fast one to capture short-term movements and a slow one to filter the overall market direction. A buy signal occurs when the fast SMA is above the slow SMA and the price moves back above the fast SMA after being below it on the previous candle. A sell signal occurs when the fast SMA is below the slow SMA and the price moves back below it after
FREE
Description Candlestick Pattern Analyzer is an advanced tool for both discretionary and systematic traders, designed to automatically identify major Japanese candlestick patterns and deliver a detailed statistical analysis of their historical performance. This indicator is perfect for those who want to verify the real-world effectiveness of patterns and use them alongside confirmation filters (e.g., trend, key levels, volume) and a well‑defined risk‑management strategy. Key Features Automatic
Body Ratio Indicator for MT5 – Candle Strength and Compression Analyzer The Body Ratio Indicator is a technical tool for analyzing candlestick structure and identifying market conditions based on the ratio between the candle’s body (open-close) and its total range (high-low). This simple yet powerful calculation helps traders detect strong momentum candles, indecision candles, and range compression phases, which often precede major breakouts. Each candlestick is categorized in real time: Weak c
FREE
Description: NR4 & NR7 Inside Bar Highlighter is an indicator that automatically detects price compression patterns based on a combination of NR4 or NR7 with an Inside Bar. The NR4 (Narrow Range 4) pattern identifies the candle with the smallest range among the last 4 bars, while NR7 considers the last 7. When this narrow-range condition occurs alongside an Inside Bar (a candle completely contained within the previous one), it often signals a low-volatility phase that may precede a strong breako
FREE
Description: NR4 & NR7 Inside Bar Highlighter for MetaTrader 4 is an indicator that automatically detects price compression patterns based on the combination of NR4 or NR7 with an Inside Bar . How it works: The NR4 (Narrow Range 4) pattern identifies the candle with the smallest range among the last 4 bars, while NR7 considers the last 7. When this narrow-range condition occurs alongside an Inside Bar (a candle completely contained within the previous one), it often signals a low-volatility ph
FREE
Short Description: A powerful tool to measure trend efficiency and filter market noise. Toggle between a sleek line chart or a color-coded histogram with threshold alerts. Key Features: Dual Plot Styles: Line (RSI-like) or colored histogram (Trend/Neutral/Range). Configurable Thresholds: Set your own upper (trend) and lower (range) levels. Multi-Mode Visualization: Clear visual cues—green for strong trends, gray for consolidation, red for ranging markets. Flexible Period: Adjustable calculation
FREE
Description Volatility ATR Crossover Histogram is an indicator for MetaTrader 4 that measures the expansion and contraction of volatility by comparing a fast ATR with a slow ATR. The result is displayed in a colored histogram in a separate window. Green bars indicate an increasing volatility phase, while red bars indicate decreasing volatility. It is designed as a universal filter for entry timing, trade management, and market regime detection. How it works The indicator calculates two ATRs w
FREE
Simple Range Filter
Mattia Impicciatore
Simple Range Filter is an indicator designed to highlight candles with high or low volatility . It calculates the average range (High - Low) over a defined number of candles and dynamically adjusts the thresholds based on market conditions. Main Features: Dynamic calculation of average range Visual highlighting of bars with above or below-average range Configurable parameters for colors and calculation period Real-time updates (tick-by-tick) Use Cases: Helps identify periods of low volatility (
FREE
Overview Performance Indicator shows a heatmap of percentage returns for a list of symbols over configurable time intervals. It is used to visually compare relative strength and weakness , without giving any guarantee of results. Configuration SymbolsList: comma-separated symbols; must match exactly the names in the terminal. BaseTF: base timeframe for calculations. UpdateSeconds: interval in seconds for automatic refresh. CapPercent: normalization value for color intensity. PeriodsList: stri
FREE
What is Bias Finder The Bias Finder (with Export) is an advanced indicator designed to detect and analyze market statistical biases, providing a clear visualization of recurring tendencies. This tool is especially useful for both discretionary and systematic traders who want to integrate quantitative analysis into their trading strategies. Analysis Modes The indicator calculates and displays price bias according to different time logics: Hourly Bias : statistical analysis hour by hour. Weekday B
Bias Seasonal Pattern Analyzer for MT5 – Real-Time Seasonal Bias Analysis Bias Finder is an advanced tool for seasonal market analysis, designed to clearly display average profits generated during different time-based segments: Hourly Bias – shows the most profitable hours of the day Weekday Bias – reveals the best-performing day of the week for each symbol Day‑of‑Month Bias – analyzes behavior at the start and end of each month Monthly Bias – ideal for long-term seasonal or monthly trend analy
False Breakout EA MT5
Mattia Impicciatore
Download ready-to-use set files for False Breakout EA: https://c.mql5.com/31/1514/False-Breakout-EA.zip False Breakout EA is an Expert Advisor designed to detect and exploit false breakouts on key support and resistance levels. The system uses daily candle analysis to identify re-entries after false breakouts, with an optional RSI confirmation filter to increase signal reliability. Trading logic Automatic detection of false breakouts on support and resistance. Optional RSI confirmation to filt
Filter:
No reviews
Reply to review