
Bollinger RSI ReEntry MT4
- Indicators
-
Mattia Impicciatore
 Hello,
I’m Mattia — a fintech developer, trader, and expert in MQL5, Python, and web technologies. - Version: 1.0
Description (MT4)
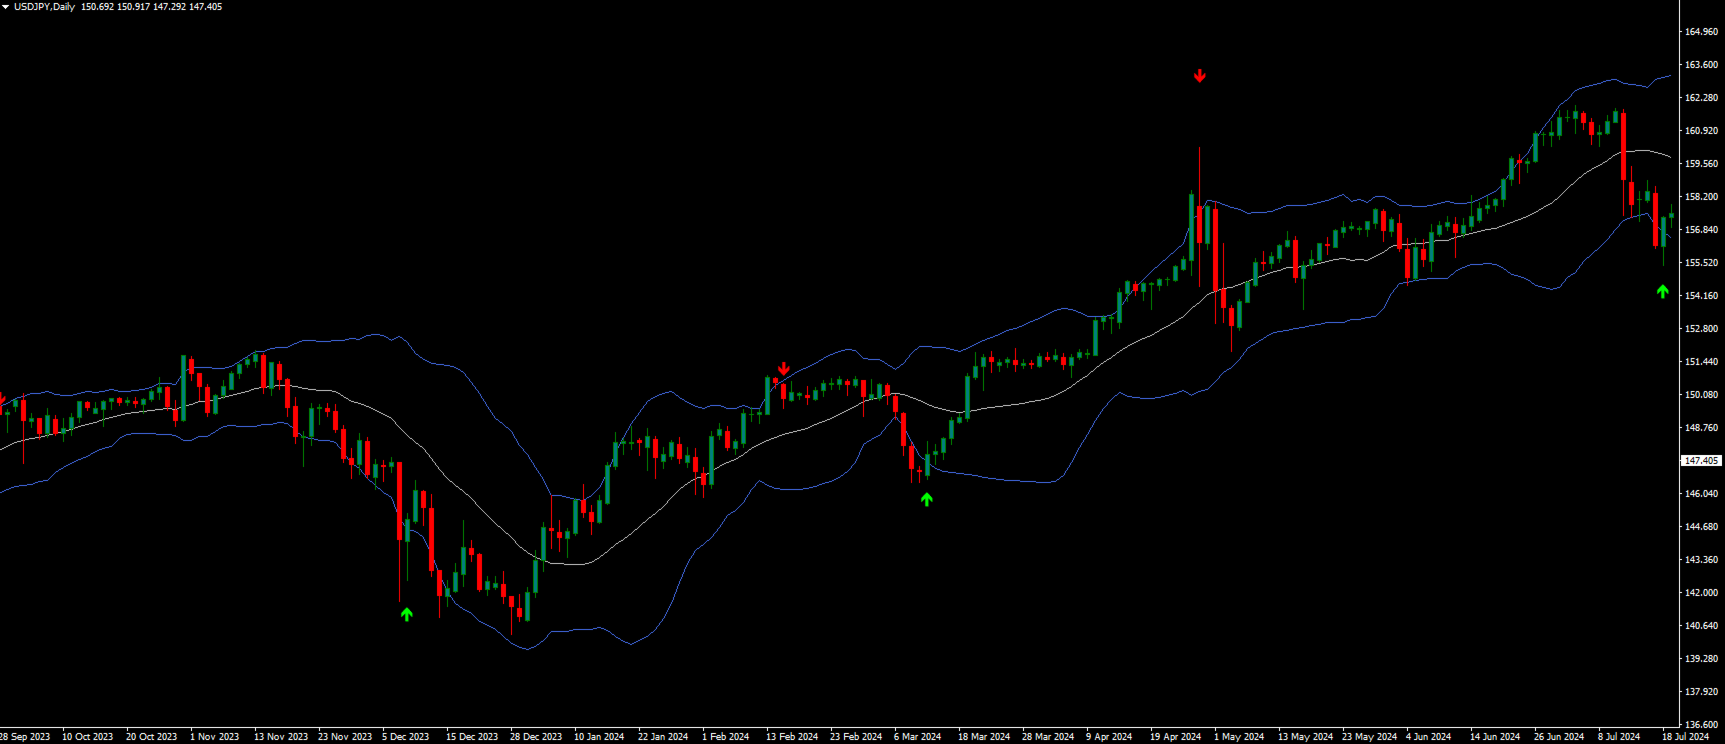
This indicator detects price reentry moments after a candle has pierced outside the Bollinger Bands, combining that signal with an optional RSI confirmation to reduce false positives.
A Buy ReEntry signal is generated when price has moved below the lower band and then returns inside, optionally confirmed by the RSI just exiting an oversold condition.
A Sell ReEntry signal is generated when price has moved above the upper band and then reenters, optionally confirmed by the RSI just exiting an overbought condition.
Signals are marked with arrows on the chart, placed with a slight offset (half the candle range) outside highs/lows for clarity.
Key Features
-
Manual calculation of Bollinger Bands (simple moving average + standard deviation).
-
Optional RSI filter to validate reentries (exit from oversold/overbought).
-
Buy/Sell ReEntry signals based on price returning inside the bands after an excursion outside.
-
Distinct arrow visualization for buy and sell signals.
-
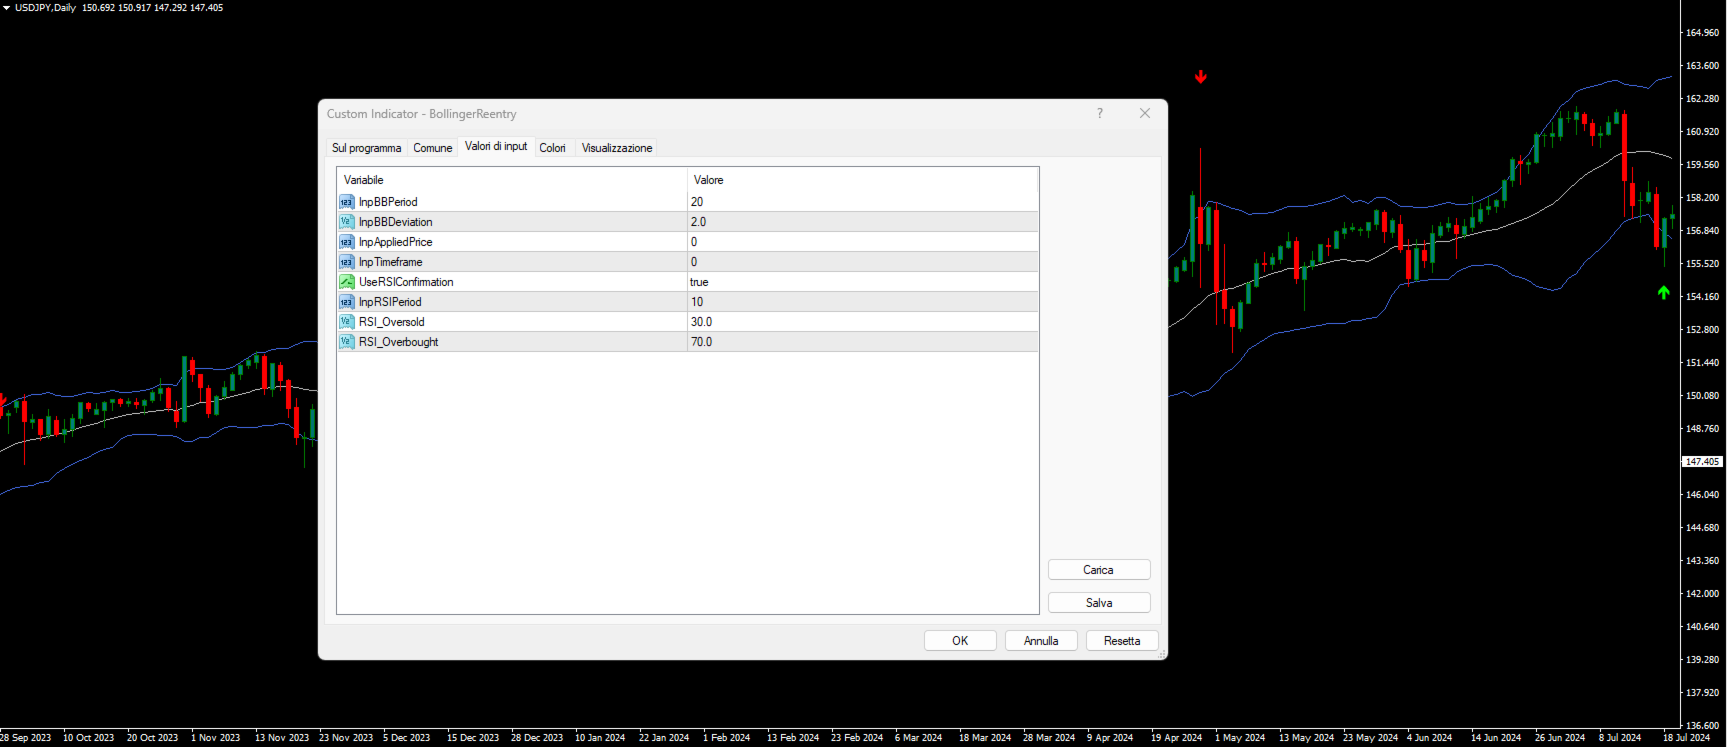
Fully configurable parameters: BB period, deviation, RSI period, overbought/oversold thresholds, timeframe.
-
Classic MT4 RSI implementation (per-shift reading via iRSI ), with intelligent fallback that does not block signals if RSI is unavailable or unreliable.
-
Note on timeframes: if the analyzed timeframe differs from the chart’s timeframe, temporal alignment is basic; in multi-timeframe scenarios signals may not perfectly coincide in time without advanced mapping.
Input Parameters
-
InpBBPeriod – Period of the Bollinger Bands.
-
InpBBDeviation – Standard deviation multiplier for the bands.
-
InpTimeframe – Timeframe to analyze.
-
UseRSIConfirmation – Enables/disables RSI confirmation.
-
InpRSIPeriod – Period of the RSI.
-
RSI_Oversold – Oversold threshold for buy confirmation.
-
RSI_Overbought – Overbought threshold for sell confirmation.
How It Works
-
The simple moving average and standard deviation are calculated manually to derive the Bollinger Bands.
-
It checks whether price temporarily moved outside the bands and then reentered (reentry).
-
If enabled, directional confirmation is taken from RSI: exit from oversold for buys, exit from overbought for sells.
-
A signal arrow is drawn at the reentry point with a visual offset (half the candle range) for better readability.
Benefits
-
Reduces false breakouts by exploiting reentry instead of mere breach.
-
RSI confirmation adds momentum context, filtering weaker signals.
-
Easy to combine with other tools for multi-layer validation.
Recommended Indicators to Combine
-
Candlestick Pattern Analyzer MT4: useful to validate price structure immediately before or after the reentry. Candle patterns confirm direction or reversal, creating confluence with the reentry signal and increasing its reliability. Available here: https://www.mql5.com/en/market/product/145982
Usage Suggestions
-
Use alongside candlestick pattern analysis (e.g., via the Candlestick Pattern Analyzer MT4) to confirm price structure and the strength of the entry idea.
-
Avoid taking signals in isolation: look for confluence with support/resistance or higher-timeframe trends.
-
Pair with volume or trend filters to improve risk/reward profile.



































































must try...