Market Structure ICT MT4
- Indicators
- Version: 2.21
- Updated: 5 May 2026
- Activations: 20

Market Structure ICT Indicator
1. Automated Market Structure The biggest advantage is reducing errors from subjective interpretation.
-
Accurate Trend Identification: Automatically identifies BOS (Break of Structure) for trend continuation and CHoCH (Change of Character) for trend reversals.
-
Swing Classification: Users can select the market structure type, from Short-term to Intermediate and Long-term, making it suitable for both Scalpers and Swing Traders.
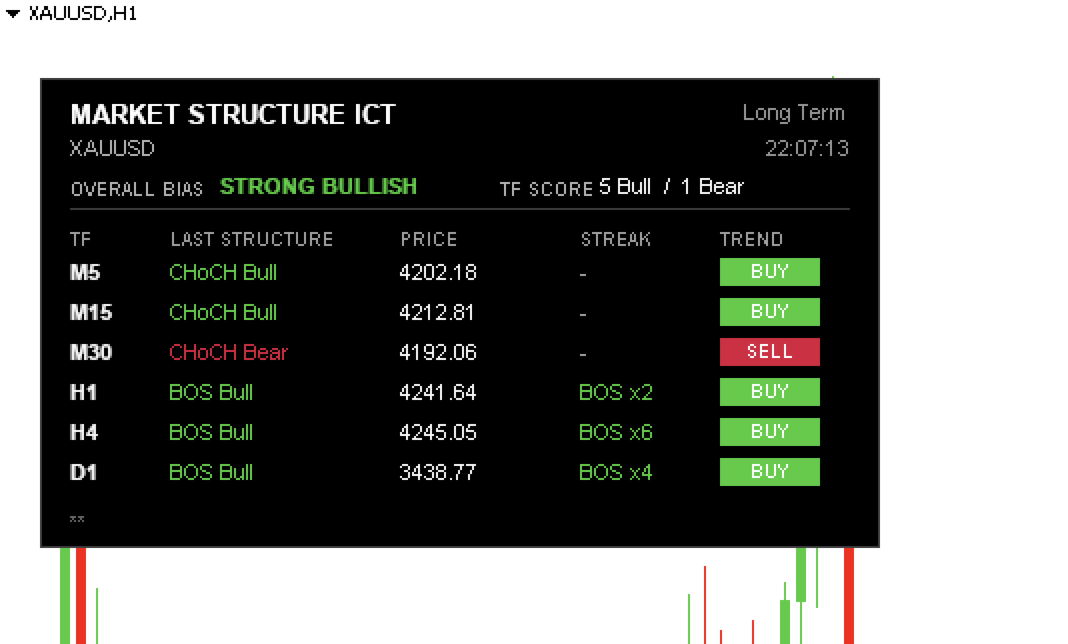
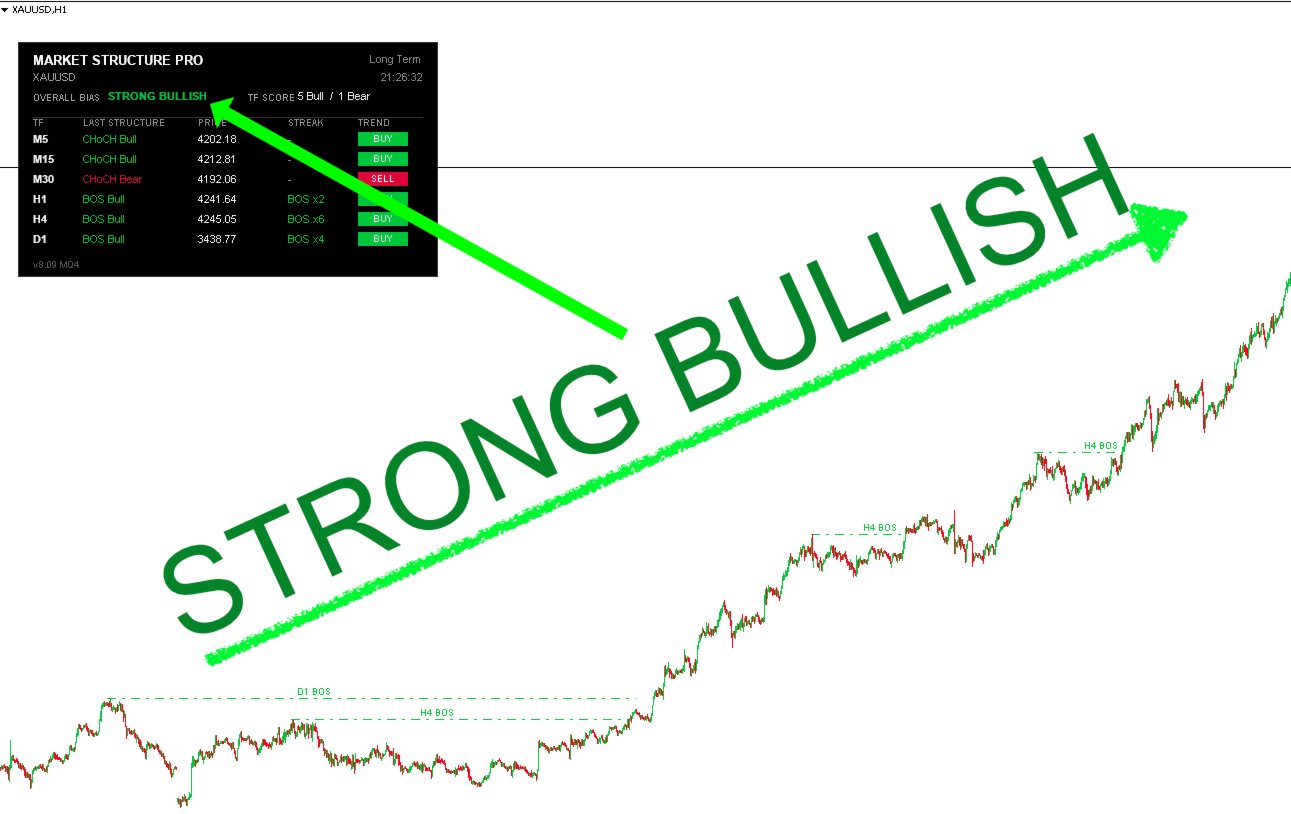
2. Professional Dashboard No need to switch screens to check other timeframes.
-
One-Glance Analysis: The dashboard displays the status of all timeframes (M1 to W1) on a single screen.
-
Scoring System: Summarizes the Overall Bias (e.g., "Strong Bullish" or "Mixed") by scoring smaller timeframes, giving you confidence in trade decisions.
-
Trend Freshness: Alerts you if a BOS is a "Fresh Break" (just happened) or an older structure.
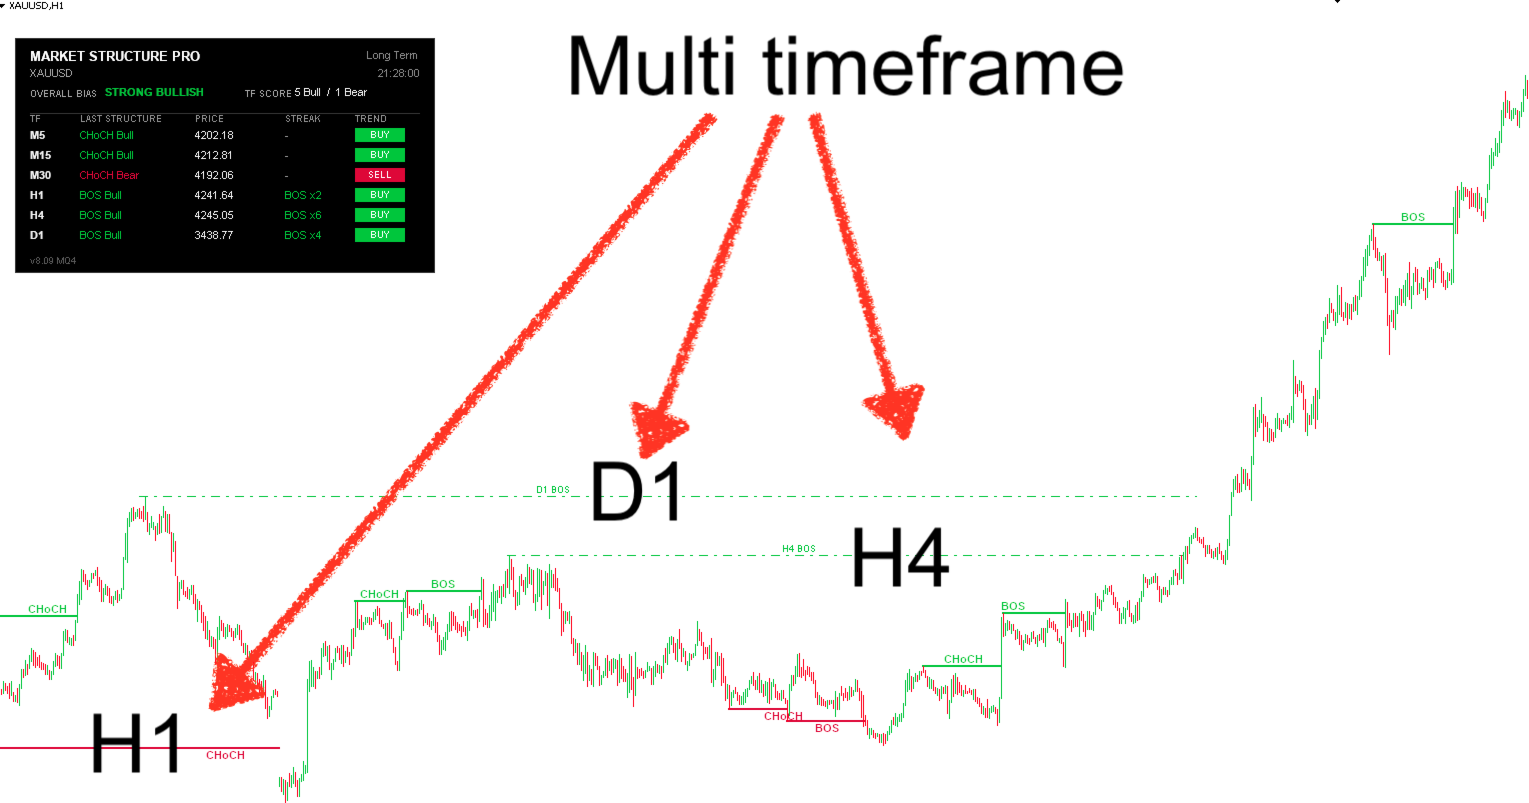
3. MTF On-Chart Display A powerful feature for finding precise entry points.
-
See the Big Picture on Small Charts: You can open an M5 chart but command the indicator to draw H1 or H4 market structures directly on it.
-
Benefit: Helps you trade lower timeframes without losing direction and instantly identify higher timeframe support/resistance.
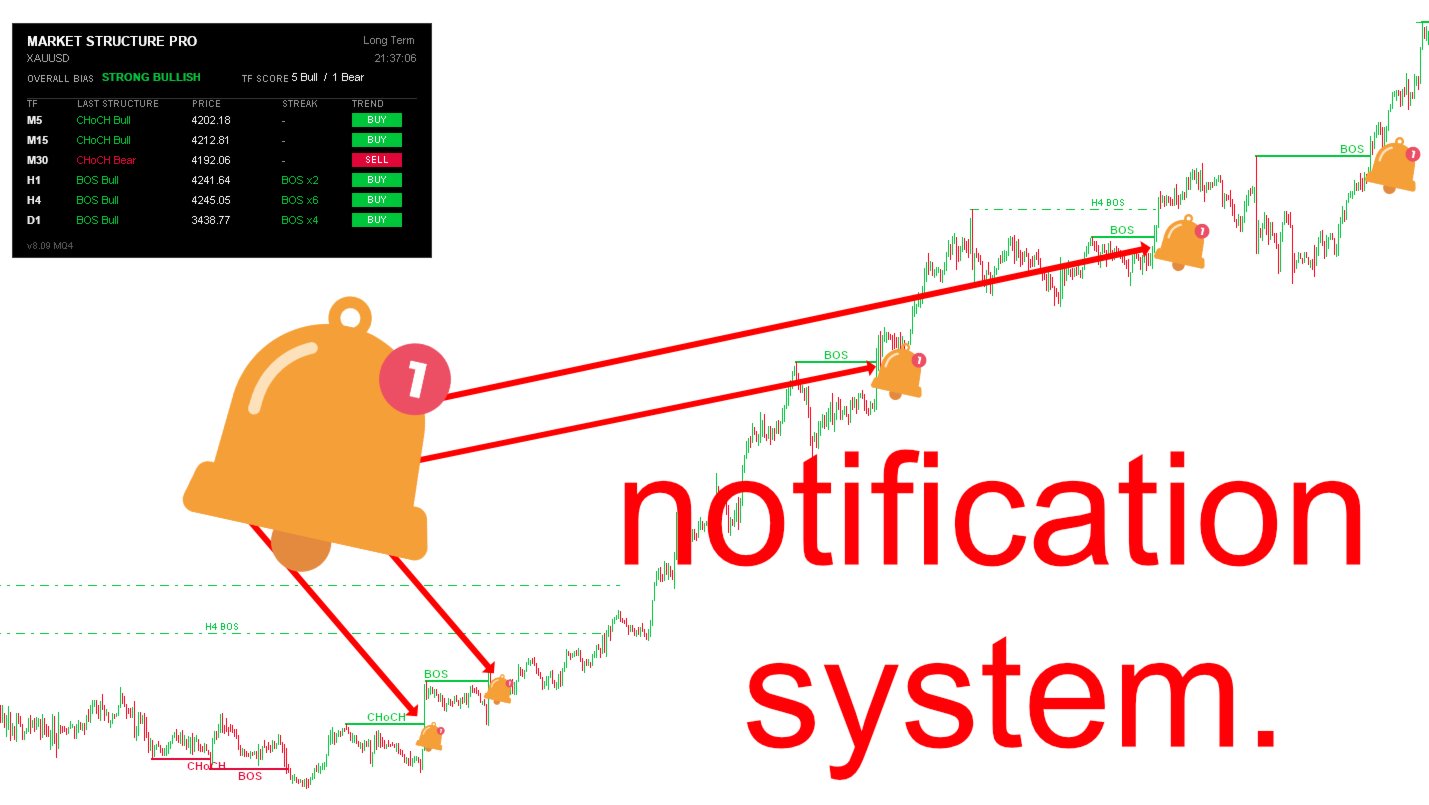
4. Smart Alert System
-
Never Miss a Beat: Supports both Popup alerts on screen and Push Notifications to mobile.
-
Filterable Signals: Customizable to alert only when structure breaks occur in the timeframes you are interested in.


User didn't leave any comment to the rating