ABC Harmonic Pattern Indicator MT4
- Indicators
- Eda Kaya
- Version: 2.1
ABC Harmonic Pattern Indicator MT4
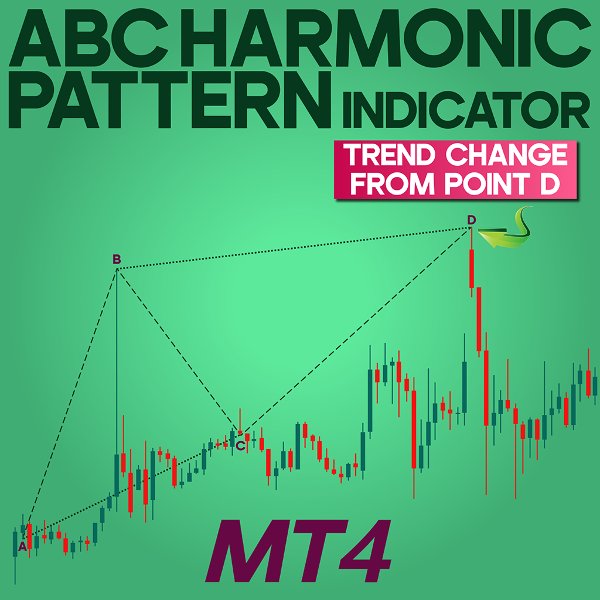
The ABC Harmonic Pattern indicator is a popular technical analysis tool, particularly effective for identifying harmonic reversal patterns. It works by detecting symmetrical price movements and exact Fibonacci ratios to determine the likely reversal point at D. This indicator functions automatically and visually illustrates the full pattern structure using red lines on the chart.
«Indicator Installation & User Guide»
MT4 Indicator Installation | ABC Harmonic Pattern Indicator MT5 | ALL Products By TradingFinderLab | Best MT4 Indicator: Refined Order Block Indicator for MT4 | Best MT4 Utility: Trade Assistant Expert TF MT4 | TP & SL Tool: Risk Reward Ratio Calculator RRR MT4 | Money Management: Easy Trade Manager MT4 | Trade Copier: Free Fast Local Trade Copier MT4 | Money management + prop protector: Trade Assist Prop Protector MT4
ABC Harmonic Pattern Specifications Table
The features of the ABC Harmonic Pattern indicator are shown in the table below:| Category | Price Action – Candlestick – Harmonic Pattern |
| Platform | MetaTrader 4 |
| Skill Level | Intermediate |
| Indicator Type | Continuation – Reversal |
| Timeframe | Multi Timeframe |
| Trading Style | Day Trading |
| Trading Market | All Markets |
Indicator Overview
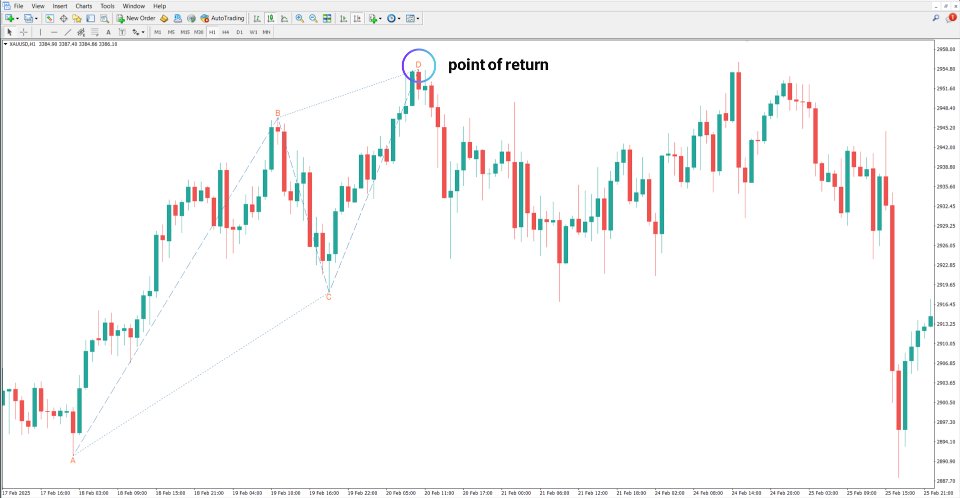
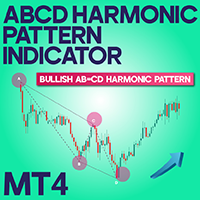
This indicator is specifically designed to detect price patterns based on the ABCD formation. It automatically identifies the four main points—A, B, C, and D—and uses the Fibonacci relationships between AB, BC, and CD waves to assess symmetry in price and time. By recognizing both bullish and bearish structures, the tool helps traders locate reversal zones and define entry or exit points.
Uptrend Conditions
For example, in the GBP/USD chart, the pattern appears when the price moves downward from point A to B, retraces upward to point C, and then falls again to point D. At this point, a reversal from D suggests the beginning of a bullish trend.
Downtrend Conditions
A bearish pattern can be observed on the XAU/USD (gold) chart. In this scenario, the price rises from A to B, pulls back to C, and climbs again to D. This behavior indicates the formation of a bearish ABCD pattern. Point D is then identified as a potential reversal zone, providing an opportunity to consider sell positions.
Indicator Settings
The indicator configuration includes the following options:
• Minimum Length Of Wave (candle): Defines the minimum wave length in candles
• Num Of Previous Candle: Sets the number of previous candles for analysis
• Show Lines: Enables the display of pattern lines
• Break Pivot: Highlights the break pivot level
• Original pivot to broken pivot (Pipet): Specifies the allowed distance between original and broken pivots
• Shift: Adjusts the horizontal placement of the pattern
• Bullish Pattern: Activates detection of bullish patterns
• Bearish Pattern: Activates detection of bearish patterns
• Style Of Line: Allows customization of line style
• Width Of Line: Adjusts the thickness of the lines
• Custom Color Lines (Bearish Harmonic): Sets custom colors for bearish patterns
• Custom Color Lines (Bullish Harmonic): Sets custom colors for bullish patterns
• Custom Color Of Text: Defines the color for text displayed on the chart
Conclusion
The ABC Harmonic Pattern indicator is a specialized technical analysis tool that efficiently identifies potential reversal zones by applying precise Fibonacci ratios and evaluating symmetry in price structures. It supports traders in making more informed decisions by clearly outlining key turning points in the market.
