Market Structure ICT MT4

Indicatore Market Structure ICT

1. Struttura di Mercato Automatizzata Il vantaggio principale è la riduzione degli errori dovuti all'interpretazione soggettiva.

  • Identificazione precisa del trend: Identifica automaticamente BOS (Rottura della Struttura) per la continuazione e CHoCH (Cambio di Carattere) per l'inversione.

  • Classificazione degli Swing: L'utente può scegliere il tipo di struttura (breve, medio o lungo termine), adatto sia agli Scalper che agli Swing Trader.

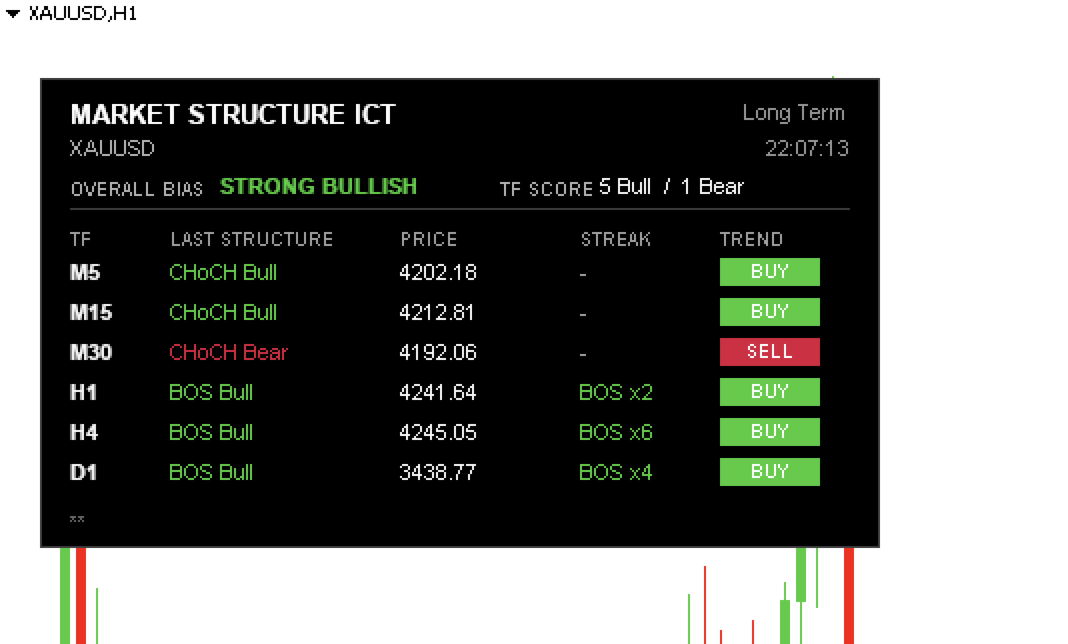
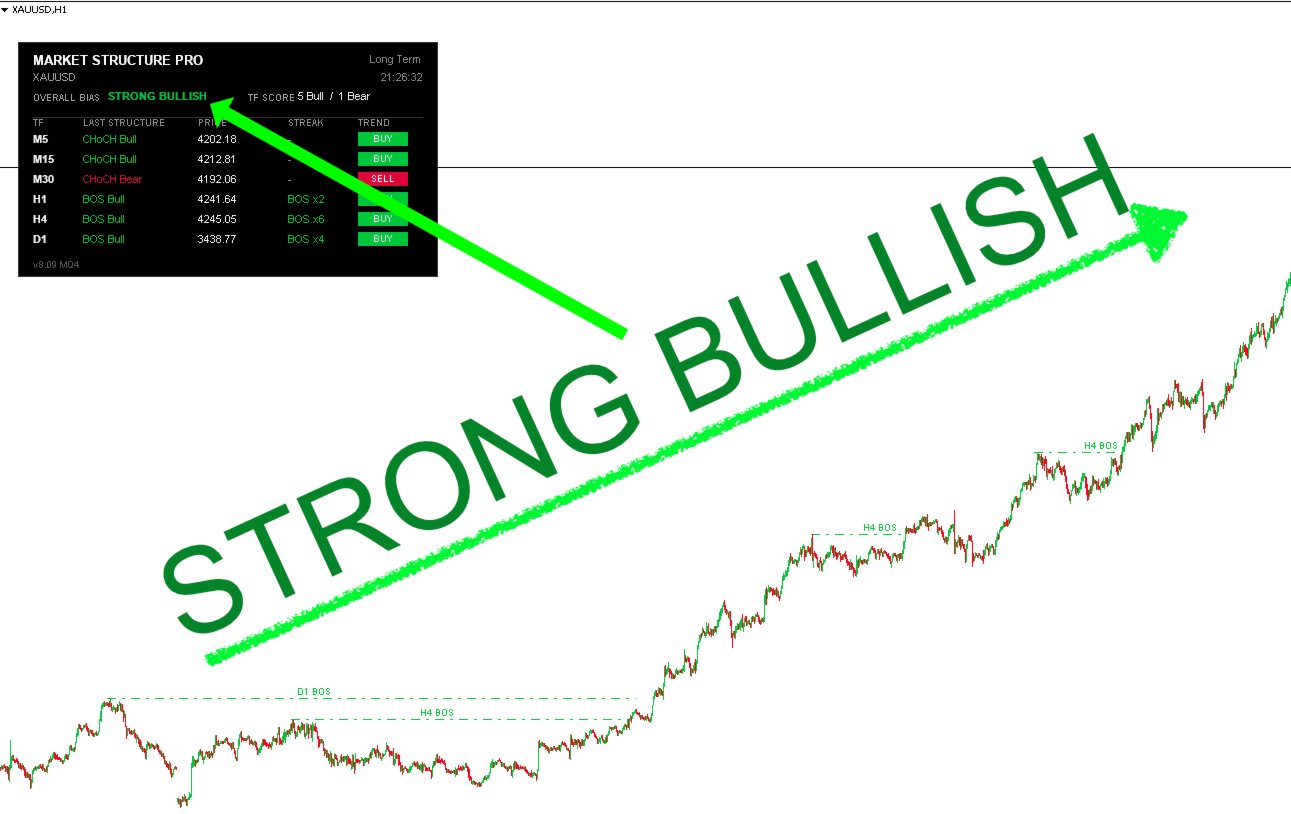
2. Dashboard Professionale Non c'è bisogno di cambiare schermata per controllare altri timeframe.

  • Analisi a colpo d'occhio: La dashboard mostra lo stato di tutti i timeframe (da M1 a W1) in un'unica schermata.

  • Sistema di Punteggio: Riassume il Bias Generale (Overall Bias) (es. "Forte Rialzista" o "Misto") calcolando i punteggi dei timeframe minori.

  • Freschezza del Trend: Avvisa se una rottura (BOS) è "Recente" (Fresh Break) o vecchia.

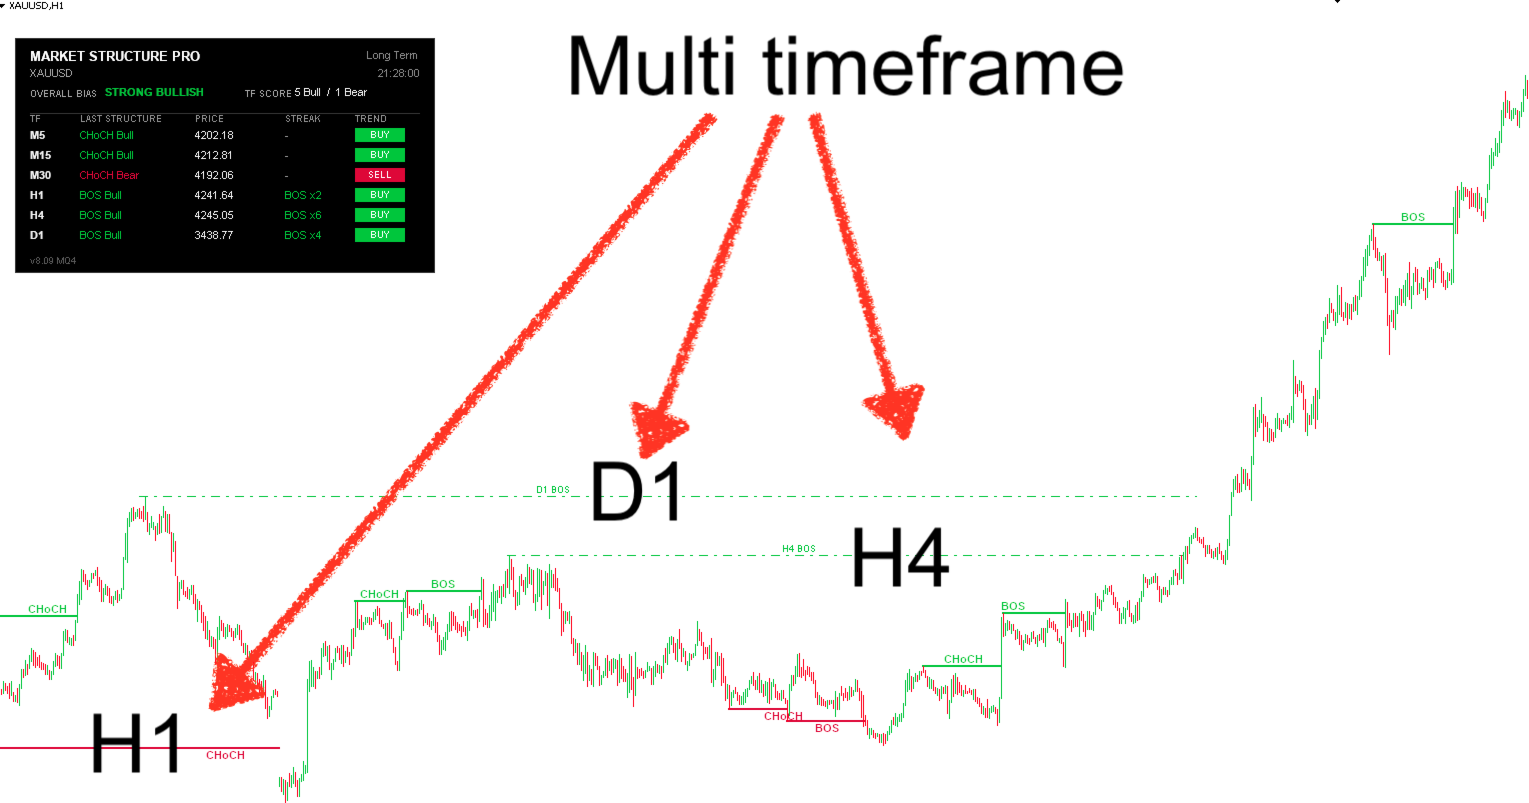
3. Visualizzazione MTF sul Grafico Una funzione potente per trovare punti di ingresso precisi.

  • Vedere il quadro generale nel piccolo: Puoi aprire un grafico M5 ma far disegnare all'indicatore le strutture H1 o H4 direttamente su di esso.

  • Vantaggio: Ti aiuta a fare trading su timeframe bassi senza perdere la direzione e a identificare istantaneamente supporti/resistenze maggiori.

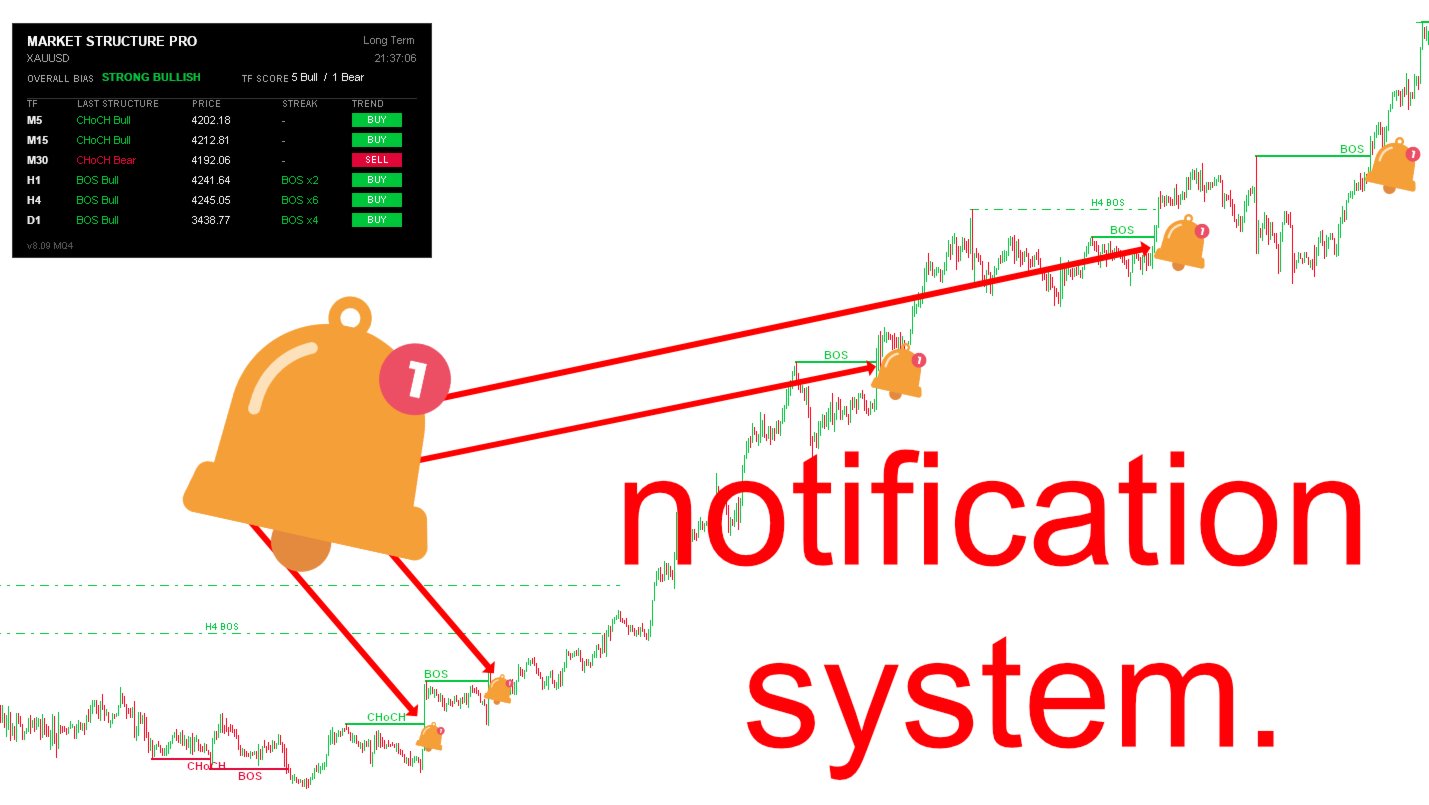
4. Sistema di Avvisi Intelligente

  • Non perdere nessun movimento: Supporta avvisi Popup su schermo e notifiche Push sul cellulare.

  • Filtraggio dei segnali: Configurabile per avvisare solo quando si verificano rotture della struttura nei timeframe di tuo interesse.


Prodotti consigliati
Transition Trend
Tatiana Savkevych
The Transition Trend indicator shows the points of potential market reversal. The indicator's smart algorithm detects the trend, filters out market noise and generates entry signals and exit levels. Simple, visual and efficient trend detection. Uses just one parameter for settings. The indicator does not redraw and does not lag. You can set up message alerts as sound or email. Works on all currency pairs and all timeframes. Ready-made trading system.
Fibonacci Trend Marker   — è un indicatore di tendenza che analizza il comportamento della candela corrente rispetto all’intervallo Alto-Basso (High-Low, HL) delle candele precedenti utilizzando i livelli di ritracciamento di Fibonacci. Monitora visivamente la forza del trend, segnalando un possibile indebolimento o inversione attraverso un cambio di colore della candela. Caratteristiche: Progettato per trader orientati al trend, aiuta a identificare rapidamente i cambiamenti di tendenza basat
Double Fractal Entry Bot trades automatically using fractal breakouts or rebounds. It detects precise entry points, places SL and TP based on market structure, and includes logic to manage risk and avoid false signals. Simple, smart, and powerful. This product is also available for MetaTrader 5 =>  https://www.mql5.com/en/market/product/143608 Double Fractal Entry Bot is an intelligent trading robot based on the proven logic of the Double Fractal Entry indicator. It analyzes price using upper a
Indicador de Fibonacci Semanal para MT4 Maximize suas operações no mercado financeiro com o Indicador de Fibonacci Semanal para MetaTrader 4 (MT4) , a ferramenta essencial para traders que buscam identificar pontos estratégicos de suporte e resistência com base na ação do preço da última semana. Principais Recursos: Atualização Automática : O indicador recalcula os níveis de Fibonacci automaticamente a cada novo candle semanal. Níveis Personalizados : Traça apenas os níveis essenciais de Fibonac
Signal Eskiya
Vitalii Zakharuk
Signal Eskiya, in addition to channel lines, reflects entry signals in the form of arrows. Trading strategies using the channel indicator belong to the classic methods of technical analysis, are easy to execute, and therefore available even to beginners. Price ranges work equally well on any trading assets and timeframes, they can be used both independently and with additional confirmation from oscillators and market volumes. American traders say: “Trend is your friend”, which means “Trend is
High Low Predict
Thomas Bradley Butler
This indicator is designed to help you forecast the potential high and low prices for the current trading day, based on the high and low of the previous day. It does this by applying a customizable percentage increase or decrease to those levels. How It Works: The idea is simple: It looks at the previous day's high and low prices and then adjusts them by a percentage you choose. Here's what that means: Predicted High: This is calculated by taking the high price of the previous day and adding a p
XFibo Auto Fibonacci
Welinton Dos Reis Goncalves
5 (1)
Use with disciplined risk management. Fibonacci entry system based on the golden zone 38.2 - 61.8 where the entry is confirmed at 23.6 with indications of Take Profit 3:1. Automatically plotted Fibonacci contains retracement and expansion Fibonacci in a single indicator. Up to 77% win rate with this system. FTMO challenge pass with 0.50% risk and 1.50% R:R.
Sensitive Signal
Aleksey Ivanov
5 (2)
The Sensitive Signal ( SS ) indicator, using the filtering methods  (which includes cluster multicurrency analysis) developed by the author, allows, with a high degree of probability, to establish the beginning of the true (filtered from interference - random price walks) trend movement. It is clear that such an indicator is very effective for trading on the currency exchange , where signals are highly distorted by random noise. The filtration developed by the author is carried out
The only volatility calculator for ANY custom time period. Place up to 5 vertical lines on chart at your chosen times to find the average volatility / expected price movement for any custom time period starting at each line time (e.g. from the time you opened your trade  or from the start of a session etc). Use the average volatility to set achievable take profit targets for your trades.  Also use the visual on-chart HISTORICAL lines to easily analyse price action at specific times of day + get
Divergence dashboard
Jan Flodin
4.64 (11)
I recommend you to read the   product's blog  (manual) from start to end so that it is clear from the beginning what the indicactor offers. This multi time frame and multi symbol divergence dashboard indicator sends an alert when one or two different divergences have been identified. It can be used with all time frames from M1 to MN. It is possible to enable moving average or RSI trend filter to filter out only the strongest setups. It should be combined with your own confirmation rules, techni
OBTE = Order Block Type I OBTI Indicator MT4 is the most accurate and customizable indicator on the market. It was developed to facilitate the analysis of operations based on candlestick patterns and supply-demand zones. These zones are possible movement reversal points. For this indicator is generated by the order block of smart money concept. Input parameters: 1. Multiple timeframes : M1 M5 M15 M30 H1 H4 D1 W1 MN1 2. Default input: H1 H4 D1 W1 MN1 3. Notifications / Send Emails / Notification
The ABC Indicator analyzes the market through waves, impulses, and trends, helping identify key reversal and trend-change points. It automatically detects waves A, B, and C, along with stop-loss and take-profit levels. A reliable tool to enhance the accuracy and efficiency of your trading. This product is also available for MetaTrader 5 =>  https://www.mql5.com/en/market/product/128178 Key Features of the Indicator: 1. Wave and Trend Identification:    - Automatic detection of waves based on mov
NO REPAINT ADVANCED CHART PATTERN INDICATOR By definition, a price ( chart)  pattern is a recognizable configuration of price movement that is identified using a series of  trendlines  and/or curves. When a price pattern signals a change in trend direction, it is known as a reversal pattern; a continuation pattern occurs when the trend continues in its existing direction following a brief pause. Advanced Chart Pattern Tracker is designed to find the MOST ACCURATE patterns. A special script is a
Projection Trend
Tatiana Savkevych
Projection Trend - a Forex arrow indicator without redrawing does not change its signals when the market situation changes, does not adjust to the chart. The signals given by him are unambiguous. Traders build a trading system that provides good signals 80-90% of the time. The indicator showing the points of entry and exit from the market with arrows is able to bring results not only in the Forex market, but also when working with binary options. You can buy it and install it in MetaTrader you
MA Speedometer
Davit Beridze
4.6 (10)
Dashboard for Ma Speedometer:  https://www.mql5.com/en/market/product/116784 Non standard attitude to the standard moving average indicator. The essence of the indicator is to determine the strength and speed of the price direction by determining the tilt angle of the moving average. A point is taken on the fifteenth MA candle and a point on the last closed MA candle, a straight line is drawn between them, it is movable and on a hemisphere shows an angle of inclination from 90 degrees to -90. a
American Hunters
Mehmet Ozhan Hastaoglu
This indicator guides you like a hunter. Tacheprofit and StopLoss levels. See the difference in the experiment. Works in all periods. Works at all rates. You can win with this system. The crossing of the mean and the re-test were done according to the rule. You can see the transactions by moving backwards on the strategy test screen. The whole system is automatically calculated.
I recommend you to read the   product's blog  (manual) from start to end so that it is clear from the beginning what the indicactor offers. This multi time frame and multi symbol indicator sends an alert when one or more trend reversal candle patterns have been identified on several time frames. It can be used with all time frames from M5 to MN. It is possible to enable moving average or RSI trend filter to filter out only the strongest setups. Combined with your own rules and techniques, this
I recommend you to read the   product's blog  (manual) from start to end so that it is clear from the beginning what the indicactor offers. This multi time frame and multi symbol supply and demand zone dashboard indicator sends alerts when the price has reached a supply/demand zone. It is also possible to use it to be alerted about regular double tops/bottoms instead of zones. It can be used with all time frames from M1 to MN. It is possible to use RSI, divergence (MACD, OsMA, RSI or Awesome) a
Trend dashboard
Jan Flodin
1 (1)
I recommend you to read the   product's blog  (manual) from start to end so that it is clear from the beginning what the indicactor offers. This multi time frame and multi symbol trend indicator sends an alert when a strong trend or trend reversal has been identified. It can do so by selecting to build up the dashboard using Moving average (single or double ( both MA:s aligned and price above/below both ) ), RSI, Bollinger bands, ADX, Composite index, Parabolic SAR, Awesome (AO), MACD (signal l
My indicator is 1000%, it never repaints, it works in every time period, there is only 1 variable, it sends notifications to your phone even if you are on vacation instead of at work, in a meeting, and there is also a robot version of this indicator With a single indicator you can get rid of indicator garbage It is especially suitable for scalping in the m1 and m5 time frames on the gold chart, and you can see long trends in the h1 time frame.
According to the law of nature which states that everything is a vibration, I have built this measurement model and which detects the best frequencies in the movement of the price, so just adjust the frequency in the input parameter of the candlestick watcher how are they arranged on the level lines (support/resistance). Lists of good frequencies   :   236, 369,417,528, 618,741,963,1236,1484.   You can also search for the frequency that suits your asset! just use the parameter:   frequency
Moving pivot Average Fibonacci The  indicator compares the selected period with its counterpart from the previous period. The indicator determines the moving Fibonacci levels for the day or any time interval to assess the price movement range from the time average. The indicator helps predict the expected high or low for the day based on historical time data. The pivot line can be considered an average trend line and use it in a variety of trading strategies. If you have any question about the
It could help to calculate Risk-Reward easily before placing a BUY-SELL position. TradeSizeCalculator is a Multi-Tasking Calculator. It will calculate the others when we define the value in one of the columns. Stoploss, risk percentage, risk-money, lot size, take-profit , reward-money, and reward-ratio. Depending on which value is changed. All values in the columns are editable. Also, we can get those calculation results by drag-drop the stop-loss/take-profit line. Parameter: The inputs below ar
This indicator helps to identify market sessions, It's High/Low, Open Range (OR), range of the sessions in pips and percentage of previous day (change%) under OHLC. It is also editable for any brokerage market watch time. For traders who use session trading strategies such as Mark B. Fisher ACD it can be super effective, where they can edit OR from the settings to either line or box.  We tried to make the settings easier to edit, for traders' use on different markets, charts and brokerage time.
FIBO Trend PRO mt4
Evgenii Aksenov
5 (6)
The indicator allows you to instantly determine the current trend by color and FIBO levels. Higher Timeframe the panel shows the current trend of higher periods, helping to determine the strength of the trend Trade according to the trend when changing the color of candles or trade against the trend when the price hit the extreme levels of the   FIBO Trend PRO  indicator     Advantages of the FIBO Trend PRO Indicator never repaint and does not change their values Very easy to use and intuitive
Channels + S & R Indicator (CSRI) Indicator draws 3 channels (Large, Medium, Small) within bars’ range of current timeframe and pair / instrument. It can identify Support and Resistance levels within any chosen channel. Additionally Fibonacci levels can be drawn for Large Channel. All lines and levels can be customized by color and width. Identify Support and Resistance Levels for any Channel: IdentifySupportAndResistanceLevels - Identify Support and Resistance Levels IdentifySRforChannel – Ide
Cuervo Candles Scalping II
Cristobal Hidalgo Soriano
Características principales: Estrategia de scalping : El Crow Candles Scalping EA se enfoca en aprovechar movimientos rápidos en el mercado . La estrategia se basa en la identificación de patrones de velas y análisis técnico para tomar decisiones de entrada y salida. 2.Gestión de riesgos avanzada: El EA incorpora una gestión de riesgos sólida para proteger tu cuenta de operaciones. Puedes ajustar los parámetros de stop-loss y take-profit para adaptar el nivel de riesgo a tus preferencias. 3.Con
L'indicatore Quadrato di Gann è uno strumento potente di analisi di mercato basato sull'articolo "Formula Matematica per le Previsioni di Mercato" scritto da W.D. Gann. Questo strumento utilizza concetti matematici e teorie di Gann per effettuare un'analisi precisa del mercato. Utilizza i quadrati di 144, 90, 52 e anche il quadrato di 9. Inoltre, integra il metodo del  per il quadrato di 9 e la sua relazione con canali e modelli stellari di quel quadrato. Manuale Utente e Applicazione: Prima di
The correlation coefficient reflects the relationship between two values. It shows the dependence of changes in one value on changes in another. For example, from changes in the price of EURUSD and EURNZD. The correlation coefficient in trade, currency relations is constantly changing. Special indicators of correlation help to define it, trace changes, draw correct conclusions. One of them is the Hubbles Correlator indicator. The indicator allows you to simultaneously display several other char
ABCD Harmonic Patterns
Mehmet Ozhan Hastaoglu
Thanks to this indicator, you can easily see the new ABCD harmonic patterns in the chart. If the two price action lengths are equal, the system will give you a signal when it reaches the specified level. You can set the limits as you wish. For example, You can get the signal of the price, which occurs in the Fibonaci 38.2 and 88.6 retracements, and then moves for the same length, at the level you specify. For example, it will alarm you when the price reaches 80% as a percentage. In vertical
Gli utenti di questo prodotto hanno anche acquistato
Gann Made Easy
Oleg Rodin
4.82 (148)
Gann Made Easy è un sistema di trading Forex professionale e facile da usare che si basa sui migliori principi del trading utilizzando la teoria di mr. WD Gann. L'indicatore fornisce segnali ACQUISTA e VENDI accurati, inclusi i livelli di Stop Loss e Take Profit. Puoi fare trading anche in movimento utilizzando le notifiche PUSH. CONTATTATEMI DOPO L'ACQUISTO PER RICEVERE CONSIGLI DI TRADING, BONUS E L'ASSISTENTE EA GANN MADE EASY GRATUITAMENTE! Probabilmente hai già sentito parlare molte volte d
Game Changer Indicator
Vasiliy Strukov
5 (7)
Game Changer è un indicatore di tendenza rivoluzionario, progettato per essere utilizzato su qualsiasi strumento finanziario, per trasformare il tuo Metatrader in un potente analizzatore di trend. L'indicatore non ridisegna e non subisce ritardi. Funziona su qualsiasi intervallo temporale e aiuta a identificare i trend, segnala potenziali inversioni, funge da meccanismo di trailing stop e fornisce avvisi in tempo reale per risposte tempestive del mercato. Che tu sia un trader esperto, un profess
Attualmente 20% di sconto! La soluzione migliore per ogni principiante o trader esperto! Questo software per cruscotti funziona su 28 coppie di valute. Si basa su 2 dei nostri indicatori principali (Advanced Currency Strength 28 e Advanced Currency Impulse). Offre un'ottima panoramica dell'intero mercato Forex. Mostra i valori di forza delle valute avanzate, la velocità di movimento delle valute e i segnali per 28 coppie Forex in tutti i (9) timeframe. Immaginate come migliorerà il vostro tra
Meravith
Ivan Stefanov
5 (1)
L'indicatore analizza il volume da ogni punto e calcola i livelli di esaurimento del mercato per quel volume. È composto da tre linee: Linea di esaurimento del volume rialzista Linea di esaurimento del volume ribassista Una linea che indica la tendenza del mercato. Questa linea cambia colore per riflettere se il mercato è rialzista o ribassista. Puoi analizzare il mercato da qualsiasi punto di partenza tu scelga. Una volta che una linea di esaurimento del volume è raggiunta, identifica un nuovo
M1 Sniper
Oleg Rodin
4.89 (18)
M1 SNIPER è un sistema di indicatori di trading facile da usare. Si tratta di un indicatore a freccia progettato per l'intervallo temporale M1. L'indicatore può essere utilizzato come sistema autonomo per lo scalping sull'intervallo temporale M1 e come parte del tuo sistema di trading esistente. Sebbene questo sistema di trading sia stato progettato specificamente per il trading sull'intervallo temporale M1, può comunque essere utilizzato anche con altri intervalli temporali. Inizialmente ho pro
Scalper Inside PRO
Alexey Minkov
4.74 (69)
An exclusive indicator that utilizes an innovative algorithm to swiftly and accurately determine the market trend. The indicator automatically calculates opening, closing, and profit levels, providing detailed trading statistics. With these features, you can choose the most appropriate trading instrument for the current market conditions. Additionally, you can easily integrate your own arrow indicators into Scalper Inside Pro to quickly evaluate their statistics and profitability. Scalper Inside
Currency Strength Exotics
Bernhard Schweigert
4.88 (33)
ATTUALMENTE SCONTATO DEL 20%! La soluzione migliore per qualsiasi principiante o trader esperto! Questo indicatore è specializzato nel mostrare la forza della valuta per qualsiasi simbolo come coppie esotiche, materie prime, indici o futures. È il primo nel suo genere, qualsiasi simbolo può essere aggiunto alla nona riga per mostrare la vera forza della valuta di Oro, Argento, Petrolio, DAX, US30, MXN, TRY, CNH ecc. Si tratta di uno strumento di trading unico, di alta qualità e conveniente pe
Advanced Supply Demand
Bernhard Schweigert
4.91 (296)
Year-End Trading SALE – Save 50% While It Lasts! Best Solution for any Newbie or Expert Trader! This indicator is a unique, high quality and affordable trading tool because we have incorporated a number of proprietary features and a new formula. With this update, you will be able to show double timeframe zones. You will not only be able to show a higher TF but to show both, the chart TF, PLUS the higher TF: SHOWING NESTED ZONES. All Supply Demand traders will love it. :) Important Information Re
Trend indicator AI
Ramil Minniakhmetov
5 (74)
Trend Ai indicator è un ottimo strumento che migliorerà l'analisi di mercato di un trader combinando l'identificazione della tendenza con punti di ingresso utilizzabili e avvisi di inversione. Questo indicatore consente agli utenti di navigare nelle complessità del mercato forex con fiducia e precisione Oltre ai segnali primari, l'indicatore Ai di tendenza identifica i punti di ingresso secondari che si presentano durante i pullback o i ritracciamenti, consentendo ai trader di capitalizzare le
M1 Arrow
Oleg Rodin
5 (19)
Una strategia intraday basata su due principi fondamentali del mercato. L'algoritmo si basa sull'analisi dei volumi e delle onde di prezzo utilizzando filtri aggiuntivi. L'algoritmo intelligente dell'indicatore fornisce un segnale solo quando due fattori di mercato si combinano in uno solo. L'indicatore calcola le onde di un certo intervallo sul grafico M1 utilizzando i dati dell'intervallo di tempo più alto. E per confermare l'onda, l'indicatore utilizza l'analisi per volume. Questo indicatore
SMC Easy Signal
Mohamed Hassan
4.73 (15)
3 copies left at $65, next price is $120 SMC Easy Signal was built to remove the confusion around the smart money concept by turning structural shifts like BOS (Break of Structure) and CHoCH (Change of Character) into simple buy and sell trading signals. It simplifies market structure trading by automatically identifying breakouts and reversals as they happen, allowing traders to focus on execution rather than analysis. Whether the market is continuing its trend or preparing to reverse, the i
Se acquisti questo indicatore, riceverai il mio Trade Manager Professionale   + EA  GRATUITAMENTE. Innanzitutto è importante sottolineare che questo sistema di trading è un indicatore Non-Repainting, Non-Redrawing e Non-Lagging, il che lo rende ideale sia per il trading manuale che per quello automatico. Corso online, manuale e download di preset. Il "Sistema di Trading Smart Trend MT5" è una soluzione completa pensata sia per i trader principianti che per quelli esperti. Combina oltre 10 indic
Questo indicatore è un indicatore per l'analisi automatica delle onde perfetto per il trading pratico! Caso... Nota:   non sono abituato a usare nomi occidentali per la classificazione delle onde a causa dell'influenza della convenzione di denominazione di Tang Lun (Tang Zhong Shuo Zen), ho chiamato l'onda base come   penna   e la banda dell'onda secondaria come   segmento   At allo stesso tempo, il segmento ha la direzione del trend. La denominazione   è principalmente segmento di trend   (que
PRO Renko System
Oleg Rodin
5 (29)
PRO Renko System è un sistema di trading altamente accurato appositamente progettato per il trading di grafici RENKO. Questo è un sistema universale che può essere applicato a vari strumenti di trading. Il sistema neutralizza efficacemente il cosiddetto rumore di mercato che consente di accedere a segnali di inversione accurati. L'indicatore è molto facile da usare e ha un solo parametro responsabile della generazione del segnale. Puoi facilmente adattare lo strumento a qualsiasi strumento di
FX Power MT4 NG
Daniel Stein
4.95 (20)
FX Power: Analizza la Forza delle Valute per Decisioni di Trading Più Intelligenti Panoramica FX Power è lo strumento essenziale per comprendere la reale forza delle principali valute e dell'oro in qualsiasi condizione di mercato. Identificando le valute forti da comprare e quelle deboli da vendere, FX Power semplifica le decisioni di trading e rivela opportunità ad alta probabilità. Che tu segua le tendenze o anticipi inversioni utilizzando valori estremi di Delta, questo strumento si adatta
Looking for a powerful yet lightweight swing detector that accurately identifies market structure turning points? Want clear, reliable buy and sell signals that work across any timeframe and any instrument? Buy Sell Arrow MT Swing is built exactly for that — precision swing detection made simple and effective. This indicator identifies Higher Highs (HH) , Higher Lows (HL) , Lower Highs (LH) , and Lower Lows (LL) with remarkable clarity. It is designed to help traders easily visualize market str
Dynamic Forex28 Navigator
Bernhard Schweigert
4.43 (7)
Dynamic Forex28 Navigator - Lo strumento di trading Forex di nuova generazione. ATTUALMENTE SCONTATO DEL 49%. Dynamic Forex28 Navigator è l'evoluzione dei nostri indicatori popolari di lunga data, che combinano la potenza di tre in uno: Advanced Currency Strength28 Indicator (695 recensioni) + Advanced Currency IMPULSE con ALERT (520 recensioni) + CS28 Combo Signals (Bonus). Dettagli sull'indicatore https://www.mql5.com/en/blogs/post/758844 Cosa offre l'indicatore di forza di nuova generazione?
ACB Breakout Arrows
KEENBASE SOFTWARE SOLUTIONS
4.15 (34)
L’indicatore ACB Breakout Arrows fornisce un segnale di ingresso cruciale rilevando uno specifico pattern di breakout. Monitora costantemente il grafico alla ricerca di un momentum stabile in una direzione e segnala con precisione l’ingresso poco prima del movimento principale.  Ottieni lo scanner multi-simbolo e multi-timeframe qui - Scanner per ACB Breakout Arrows MT4 Caratteristiche principali Lo Stop Loss e il Take Profit sono calcolati automaticamente dall'indicatore. Include una dashboard
Currency Strength Wizard è un indicatore molto potente che ti fornisce una soluzione all-in-one per un trading di successo. L'indicatore calcola la potenza di questa o quella coppia forex utilizzando i dati di tutte le valute su più intervalli di tempo. Questi dati sono rappresentati in una forma di indice di valuta facile da usare e linee elettriche di valuta che puoi utilizzare per vedere il potere di questa o quella valuta. Tutto ciò di cui hai bisogno è collegare l'indicatore al grafico che
ATTUALMENTE SCONTATO DEL 26% La soluzione migliore per ogni principiante o trader esperto! Questo indicatore è uno strumento di trading unico, di alta qualità e conveniente perché abbiamo incorporato una serie di caratteristiche proprietarie e una nuova formula. Con un solo grafico è possibile leggere la forza delle valute per 28 coppie Forex! Immaginate come migliorerà il vostro trading perché sarete in grado di individuare l'esatto punto di innesco di una nuova tendenza o di un'opportunità
Trend Screener
STE S.S.COMPANY
4.79 (95)
Indicatore di tendenza, soluzione unica rivoluzionaria per il trading di tendenze e il filtraggio con tutte le importanti funzionalità di tendenza integrate in un unico strumento! È un indicatore multi-timeframe e multi-valuta al 100% non ridipingibile che può essere utilizzato su tutti i simboli/strumenti: forex, materie prime, criptovalute, indici e azioni. OFFERTA A TEMPO LIMITATO: l'indicatore di screening di supporto e resistenza è disponibile a soli 50$ e a vita. (Prezzo originale 250$) (o
Day Trader Master è un sistema di trading completo per i day trader. Le systeme se compose de due indicatori. Un indicar est un signal fléché pour acheter et vendre. C'est l'indicateur de fleche que vous obtenez. Je vous fournirai le deuxième indicaur gratuitement. Le deuxième indicaur è un indicaur de tendance spécialement conçu pour être utilisé conjointement avec ces flèches. GLI INDICATORI NON SI RIPETONO E NON RITARDANO! Usare questo sistema è molto semplice. Devi solo seguire i segnali del
Entry Points Pro
Yury Orlov
4.62 (172)
Indicatore top per MT5 che fornisce segnali accurati per entrare in un trade senza riverniciare! Può essere applicato a qualsiasi attività finanziaria: forex, criptovalute, metalli, azioni, indici.  La versione MT5 è qui Fornirà segnali di trading piuttosto precisi e ti dirà quando è meglio aprire un trade e chiuderlo. Guarda il video (6:22) con un esempio di elaborazione di un solo segnale che ha ripagato l'indicatore! La maggior parte dei trader migliora i propri risultati di trading dura
Hidden Cycles
Lev Vladimirovic Marushkin
5 (1)
Black Friday Sale – Limited Time! Grab Hidden Cycles for only $129 (regular price $179 ). This is your chance to boost your strategy with a powerful, easy-to-use cycle-based trading tool. Offer ends soon — don’t miss it! Based on Universal Laws — NOT Some Guy’s Algorithm: Let the market adjust to the Hidden Cycles Geometry — not the other way around. Most indicators are based on a man-made formula. They often lag, fail over time, or need constant re-optimization.  Hidden Cycles is different.
Adaptive Volatility Range [AVR] is a powerful tool for identifying key trend reversal points. AVR accurately reflects the Average True Range (ATR) of volatility, taking into account the Volume-Weighted Average Price (VWAP). The indicator adapts to any market volatility by calculating the average volatility over a specific period, ensuring a stable rate of profitable trades. You receive not just an indicator but a professional automated trading system , AVR-EA . Advantages: Automated Trading Sys
SMC Blast Signal with FVG, BOS and trend Breakout The SMC Blast Signal  is a  Precise trading system for Meta Trader 4 that uses Smart Money Concepts (SMC) , including Fair Value Gaps (FVG) and Break of Structure (BOS) , to identify high-probability trades. It incorporates a Trend Filter using a higher timeframe moving average, ensuring trades align with the prevailing market trend. TREND SIGNAL-FVG DETECTION-BOS DETECTION-TRADE CONFIRMED-Precise Signal entries on m15  Best TF-M15 AND ABOVE Be
Upper and Lower Reversal - Sistema per la previsione anticipata dei momenti di inversione. Ti consente di trovare punti di svolta dei prezzi ai confini dei canali di movimento dei prezzi superiore e inferiore. L'indicatore non si ricolorerà né cambierà mai la posizione delle frecce del segnale. Le frecce rosse sono un segnale di acquisto, le frecce blu sono un segnale di vendita. Si adatta a qualsiasi intervallo temporale e strumento di trading L'indicatore non si ridisegna, funziona solo quan
Advanced Currency IMPULSE with ALERT
Bernhard Schweigert
4.91 (489)
ATTUALMENTE SCONTATO DEL 31%! La soluzione migliore per ogni principiante o trader esperto! Questo indicatore è uno strumento di trading unico, di alta qualità e conveniente perché abbiamo incorporato una serie di caratteristiche proprietarie e una formula segreta. Con un solo grafico fornisce avvisi per tutte le 28 coppie di valute. Immaginate come migliorerà il vostro trading perché sarete in grado di individuare l'esatto punto di innesco di una nuova tendenza o opportunità di scalping! Co
Binary Trader Master è un indicatore basato su frecce che prevede la chiusura della candela. Fa la sua analisi all'interno di una sola candela. Quando la candela si apre sono necessari alcuni istanti per fare l'analisi e prevedere la chiusura della candela. Quindi genera un segnale. L'indicatore ti consente anche di applicare limiti di tempo che può utilizzare per l'analisi, il che significa che puoi effettivamente dire all'indicatore quanto tempo è consentito per l'analisi all'interno della can
Royal Wave Pro M4
Vahidreza Heidar Gholami
5 (3)
Royal Wave is a Trend-Power oscillator which has been programmed to locate and signal low-risk entry and exit zones. Its core algorithm statistically analyzes the market and generates trading signals for overbought, oversold and low volatile areas. By using a well-designed alerting system, this indicator makes it easier to make proper decisions regarding where to enter and where to exit trades. Features Trend-Power Algorithm Low risk Entry Zones and Exit Zones Predictions for Overbought and Over
Altri dall’autore
Teoria delle Onde di Elliott Automatizzata 1. Conteggio automatico e riduzione della soggettività Onde d'Impulso (1-2-3-4-5): Usa regole rigide per mostrare la struttura corretta. Onde Correttive (A-B-C): Aiuta a trovare opportunità di rientro nel trend. 2. Analisi Multi-Grado Analizza 3 livelli: Minor: Movimenti rapidi. Intermediate: Trend principale. Primary: Quadro generale. 3. Obiettivi di prezzo e Ingresso Proiezione di Fibonacci: Calcola i target futuri. Linee di Breakout: Mostra dove entr
Indicatore: Currency Strength Meter Pro Visualizzazione dell'ampiezza del mercato Pro: Dashboard pulita invece di grafici disordinati. Visione immediata di forza/debolezza. Benefici: Risparmio di tempo e selezione rapida delle coppie. Classifica e ordinamento automatici Pro: Ordina automaticamente dal "Più forte" al "Più debole". Benefici: Individua subito i Vincitori e i Perdenti del periodo. Logica valuta intelligente Pro: Inverte automaticamente i valori per coppie miste (es. EURUSD vs USDJPY
Italian Scansione "Smart Money" (Volume Markers): Le frecce indicano un volume anomalo (superiore alla media) con chiari colori verde/rosso. Aiuta a identificare l'ingresso dei grandi investitori e a filtrare i falsi segnali. Avvisi Critici (Alerts): Non serve fissare lo schermo. Il sistema ti avvisa immediatamente quando il prezzo incrocia la linea POC (Point of Control), che è spesso un punto decisivo per la continuazione o l'inversione. Struttura di Mercato Istantanea (Developing Profile): Mo
Teoria delle Onde di Elliott Automatizzata 1. Conteggio automatico e riduzione della soggettività Onde d'Impulso (1-2-3-4-5): Usa regole rigide per mostrare la struttura corretta. Onde Correttive (A-B-C): Aiuta a trovare opportunità di rientro nel trend. 2. Analisi Multi-Grado Analizza 3 livelli: Minor: Movimenti rapidi. Intermediate: Trend principale. Primary: Quadro generale. 3. Obiettivi di prezzo e Ingresso Proiezione di Fibonacci: Calcola i target futuri. Linee di Breakout: Mostra dove entr
Squeeze Momentum Alert 1. Identifica i Punti di "Esplosione" del Prezzo (The "Squeeze") Il vantaggio principale è la capacità di catturare i momenti di "consolidamento" prima di un grande movimento. Perché è utile: Lo strumento ti dice: "Il grafico si sta comprimendo, preparati al prossimo scatto" , assicurandoti di non perdere l'inizio di un trend. 2. Distingue la "Forza" del Trend (Color Coded Momentum) L'istogramma usa 4 colori : Verde Lime (Lime): Rialzo forte. Verde Scuro (Dark Green): Rial
Italian (Italiano) ICT_SuperTrend è uno strumento "All-in-One" per visualizzare il quadro completo del mercato. Sistema di Trading Ibrido Combina Trend Following e Concetti Smart Money / ICT . Entrate e Uscite Chiare Segnali a freccia per i cambi di trend. Linea SuperTrend ottima come Trailing Stop . Livelli di Liquidità Automatizzati Scansiona Swing Highs/Lows . BSL: Resistenza superiore. SSL: Supporto inferiore. Rilevamento Fair Value Gap (FVG) Disegna un Box quando appare un FVG. Evidenzia zo
Indicatore Volume Profile Pro Questo indicatore è lo strumento Volume Profile Pro , che aiuta ad analizzare "a quale prezzo avviene la maggiore attività di trading". Presenta le seguenti capacità speciali: Modalità di Visualizzazione (Display Modes) Volume Profile (Normale): Mostra il volume totale degli scambi (Total Volume) a ogni livello di prezzo per identificare zone chiave di supporto e resistenza. Delta / Money Flow: Mostra la "differenza" tra pressione di acquisto e vendita (Buy vs Sell)
Auto TPSL MT5
Sathit Sukhirun
Buy 1 Get 1 Free Key Benefits of Using Auto TPSL (Take Profit / Stop Loss) "Auto TPSL" is an Expert Advisor (EA) designed to automatically manage Take Profit (TP) and Stop Loss (SL) for your orders in MetaTrader. This offers significant advantages for traders: Saves Time and Reduces Workload: You don't need to manually set TP/SL for every order. The EA will handle it automatically as soon as an order is opened. Consistency in Risk Management: Helps you maintain discipline in setting profit tar
FREE
Indicatore Market Structure ICT 1. Struttura di Mercato Automatizzata Il vantaggio principale è la riduzione degli errori dovuti all'interpretazione soggettiva. Identificazione precisa del trend: Identifica automaticamente BOS (Rottura della Struttura) per la continuazione e CHoCH (Cambio di Carattere) per l'inversione. Classificazione degli Swing: L'utente può scegliere il tipo di struttura (breve, medio o lungo termine), adatto sia agli Scalper che agli Swing Trader. 2. Dashboard Professionale
Buy 1 Get 1 Free Key Features and Advantages of VWAP 1. It Shows the "True Price" or "Consensus Price" This is its most important feature. While a Simple Moving Average (MA) gives equal weight to every price, VWAP tells us what the average price really is, based on where the majority of money (volume) agreed to trade. Example: If the price of 100 had 1,000,000 shares traded, but the price of 101 only had 100 shares traded... VWAP will give significantly more weight to the 100 price. 2. It
Auto TPSL MT4
Sathit Sukhirun
Buy 1 Get 1 Free Key Benefits of Using Auto TPSL (Take Profit / Stop Loss) "Auto TPSL" is an Expert Advisor (EA) designed to automatically manage Take Profit (TP) and Stop Loss (SL) for your orders in MetaTrader. This offers significant advantages for traders: Saves Time and Reduces Workload: You don't need to manually set TP/SL for every order. The EA will handle it automatically as soon as an order is opened. Consistency in Risk Management: Helps you maintain discipline in setting profit tar
FREE
Buy 1 get 1 free how each of these input fields is used and what happens on your chart when you adjust their values: Custom text for comment : How to use : Type any text you want into the "Value" field. Result : The text you type will appear in the top-left corner of the chart window (known as the Chart Comment). You might use this for the indicator's name, version, or your own short notes. Lookback period for regression calculation : How to use : Enter an integer (e.g., 100, 200, 300). Result
This system is very useful for trading because it solves several classic problems: 1. Objectivity & Precision Benefit: It eliminates the trader's personal bias. Every trader might draw a trendline slightly differently, but this indicator uses a precise mathematical logic (Fractals) to find the pivot points. The resulting lines are objective and consistent every time. 2. ️ Dynamic Updates Benefit: Your chart is always current. As soon as a new pivot is confirmed, the new trendline is drawn
Squeeze Momentum Alert 1. Identifica i Punti di "Esplosione" del Prezzo (The "Squeeze") Il vantaggio principale è la capacità di catturare i momenti di "consolidamento" prima di un grande movimento. Perché è utile: Lo strumento ti dice: "Il grafico si sta comprimendo, preparati al prossimo scatto" , assicurandoti di non perdere l'inizio di un trend. 2. Distingue la "Forza" del Trend (Color Coded Momentum) L'istogramma usa 4 colori : Verde Lime (Lime): Rialzo forte. Verde Scuro (Dark Green): Rial
Italian (Italiano) ICT_SuperTrend è uno strumento "All-in-One" per visualizzare il quadro completo del mercato. Sistema di Trading Ibrido Combina Trend Following e Concetti Smart Money / ICT . Entrate e Uscite Chiare Segnali a freccia per i cambi di trend. Linea SuperTrend ottima come Trailing Stop . Livelli di Liquidità Automatizzati Scansiona Swing Highs/Lows . BSL: Resistenza superiore. SSL: Supporto inferiore. Rilevamento Fair Value Gap (FVG) Disegna un Box quando appare un FVG. Evidenzia zo
Indicatore: Currency Strength Meter Pro Visualizzazione dell'ampiezza del mercato Pro: Dashboard pulita invece di grafici disordinati. Visione immediata di forza/debolezza. Benefici: Risparmio di tempo e selezione rapida delle coppie. Classifica e ordinamento automatici Pro: Ordina automaticamente dal "Più forte" al "Più debole". Benefici: Individua subito i Vincitori e i Perdenti del periodo. Logica valuta intelligente Pro: Inverte automaticamente i valori per coppie miste (es. EURUSD vs USDJPY
Buy 1 get 1 free how each of these input fields is used and what happens on your chart when you adjust their values: Custom text for comment : How to use : Type any text you want into the "Value" field. Result : The text you type will appear in the top-left corner of the chart window (known as the Chart Comment). You might use this for the indicator's name, version, or your own short notes. Lookback period for regression calculation : How to use : Enter an integer (e.g., 100, 200, 300). Result
This system is very useful for trading because it solves several classic problems: 1. Objectivity & Precision Benefit: It eliminates the trader's personal bias. Every trader might draw a trendline slightly differently, but this indicator uses a precise mathematical logic (Fractals) to find the pivot points. The resulting lines are objective and consistent every time. 2. ️ Dynamic Updates Benefit: Your chart is always current. As soon as a new pivot is confirmed, the new trendline is drawn au
Buy 1 Get 1 Free Key Features and Advantages of VWAP 1. It Shows the "True Price" or "Consensus Price" This is its most important feature. While a Simple Moving Average (MA) gives equal weight to every price, VWAP tells us what the average price really is, based on where the majority of money (volume) agreed to trade. Example: If the price of 100 had 1,000,000 shares traded, but the price of 101 only had 100 shares traded... VWAP will give significantly more weight to the 100 price. 2. It
Indicatore Volume Profile Pro Questo indicatore è lo strumento Volume Profile Pro , che aiuta ad analizzare "a quale prezzo avviene la maggiore attività di trading". Presenta le seguenti capacità speciali: Modalità di Visualizzazione (Display Modes) Volume Profile (Normale): Mostra il volume totale degli scambi (Total Volume) a ogni livello di prezzo per identificare zone chiave di supporto e resistenza. Delta / Money Flow: Mostra la "differenza" tra pressione di acquisto e vendita (Buy vs Sell)
Italian Scansione "Smart Money" (Volume Markers): Le frecce indicano un volume anomalo (superiore alla media) con chiari colori verde/rosso. Aiuta a identificare l'ingresso dei grandi investitori e a filtrare i falsi segnali. Avvisi Critici (Alerts): Non serve fissare lo schermo. Il sistema ti avvisa immediatamente quando il prezzo incrocia la linea POC (Point of Control), che è spesso un punto decisivo per la continuazione o l'inversione. Struttura di Mercato Istantanea (Developing Profile): Mo
Filtro:
Nessuna recensione
Rispondi alla recensione