Market Structure ICT MT4
- 지표
- 버전: 2.21
- 업데이트됨: 5 5월 2026
- 활성화: 20

Market Structure ICT 인디케이터
1. 자동화된 시장 구조 분석 가장 큰 장점은 주관적인 해석으로 인한 오류를 줄여준다는 것입니다.
-
정확한 추세 식별: 추세 지속을 위한 **BOS (구조 돌파)**와 추세 반전을 위한 **CHoCH (추세 성격 변화)**를 자동으로 식별합니다.
-
스윙 분류: 단기, 중기, 장기 등 시장 구조 유형을 선택할 수 있어 스캘퍼와 스윙 트레이더 모두에게 적합합니다.
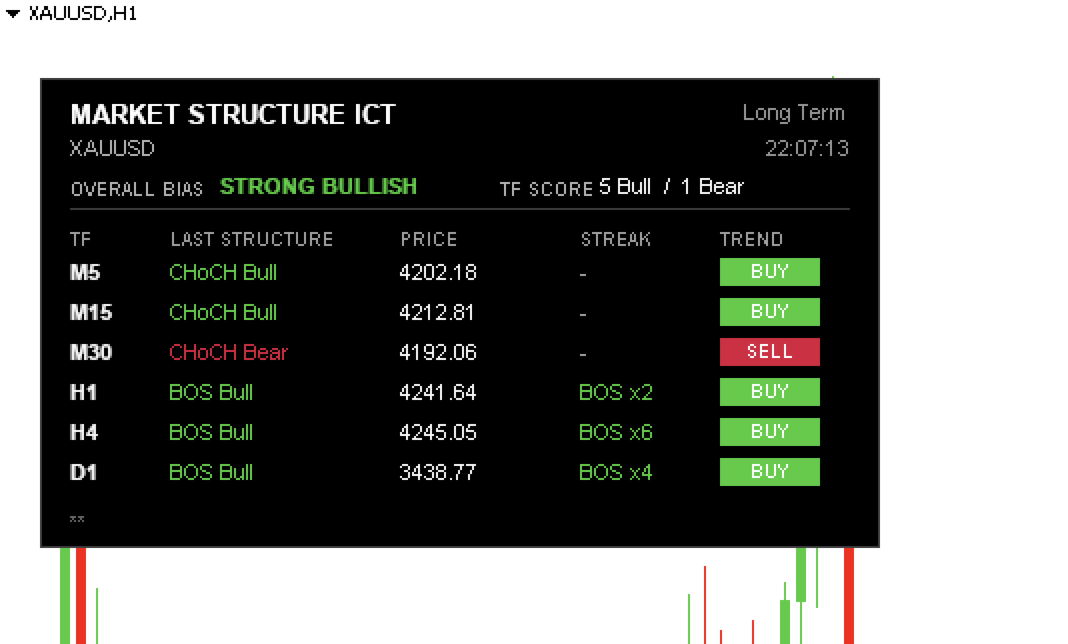
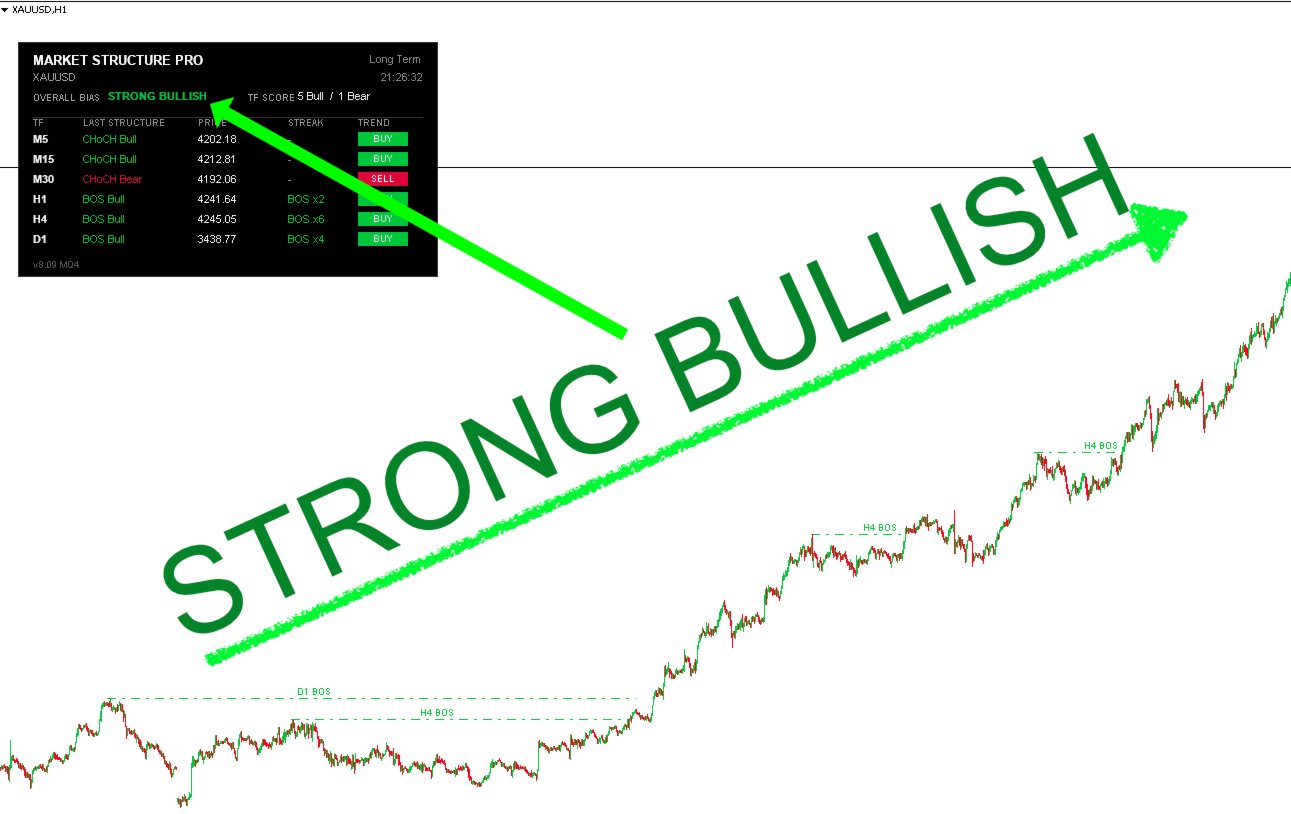
2. 전문 대시보드 다른 타임프레임을 확인하기 위해 화면을 전환할 필요가 없습니다.
-
한눈에 보는 분석: 대시보드는 모든 타임프레임(M1~W1)의 상태를 한 화면에 표시합니다.
-
점수 시스템: 하위 타임프레임의 점수를 합산하여 전반적인 편향 (Overall Bias)(예: "강한 상승" 또는 "혼조")을 요약해 줍니다.
-
추세의 신선도: BOS가 방금 발생한 "신규 돌파(Fresh Break)"인지 오래된 구조인지 알려줍니다.
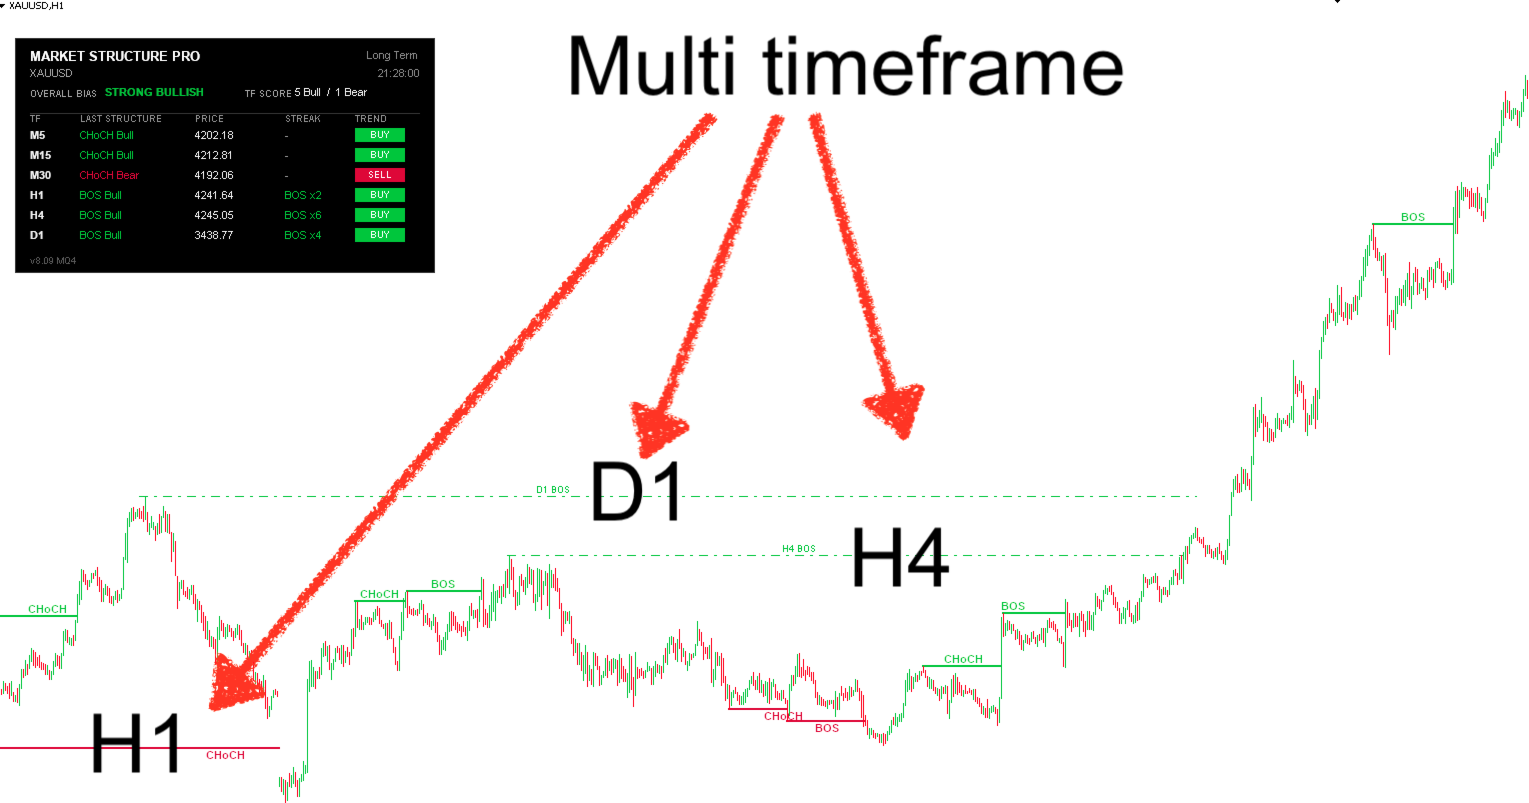
3. 차트 상의 MTF 표시 (멀티 타임프레임) 정밀한 진입 시점을 찾는 강력한 기능입니다.
-
작은 차트에서 큰 그림 보기: M5 차트를 켜두고 H1이나 H4의 시장 구조선을 그 위에 바로 표시할 수 있습니다.
-
이점: 방향성을 잃지 않고 낮은 타임프레임에서 거래할 수 있으며, 상위 타임프레임의 지지/저항을 즉시 파악할 수 있습니다.
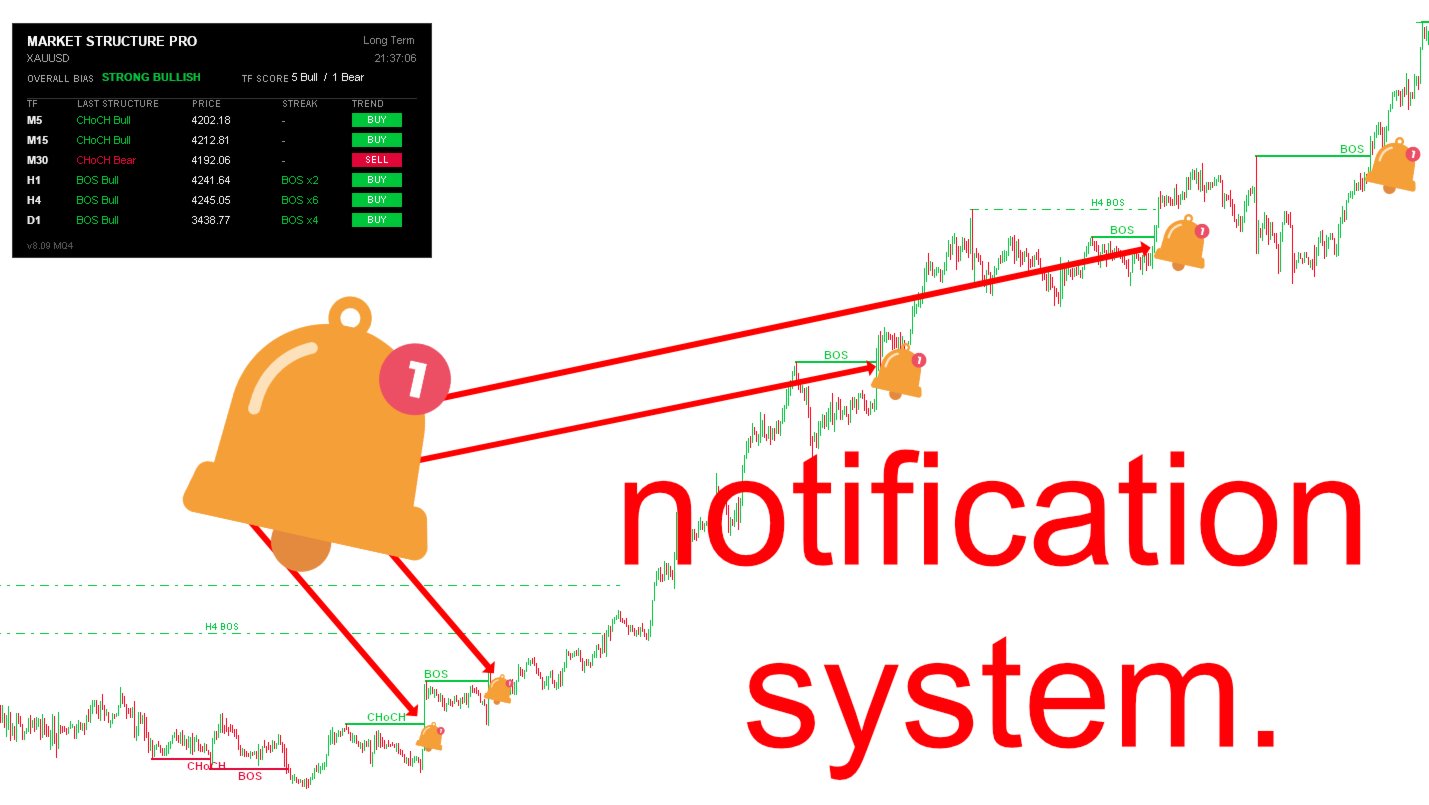
4. 스마트 알림 시스템
-
놓치지 않는 기회: 화면 팝업 알림과 모바일 푸시 알림을 모두 지원합니다.
-
신호 필터링: 관심 있는 타임프레임에서 구조 돌파가 발생할 때만 알림을 받도록 설정할 수 있습니다.


사용자가 평가에 대한 코멘트를 남기지 않았습니다