Market Structure ICT MT4
- Göstergeler
- Sürüm: 2.21
- Güncellendi: 5 Mayıs 2026
- Etkinleştirmeler: 20

-
Market Structure ICT İndikatörü
1. Otomatik Piyasa Yapısı (Market Structure) En büyük avantajı, öznel yorumlamadan kaynaklanan hataları azaltmasıdır.
-
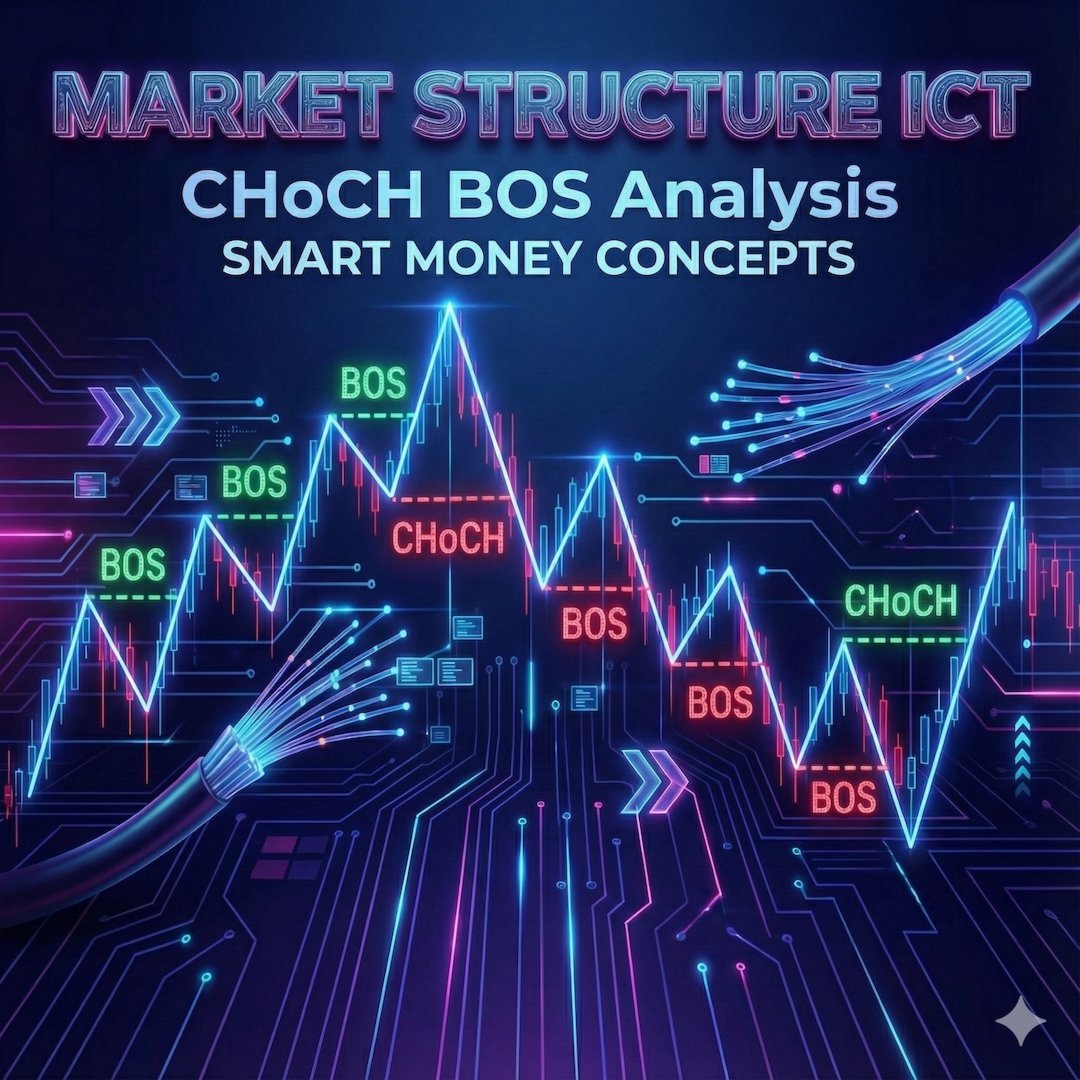
Hassas Trend Tespiti: Trend devamı için BOS (Yapı Kırılımı) ve trend dönüşü için CHoCH (Karakter Değişimi)noktalarını otomatik olarak belirler.
-
Swing Sınıflandırması: Kullanıcı, piyasa yapısı türünü (Kısa, Orta veya Uzun vadeli) seçebilir, bu da hem Scalperlar hem de Swing Traderlar için uygundur.
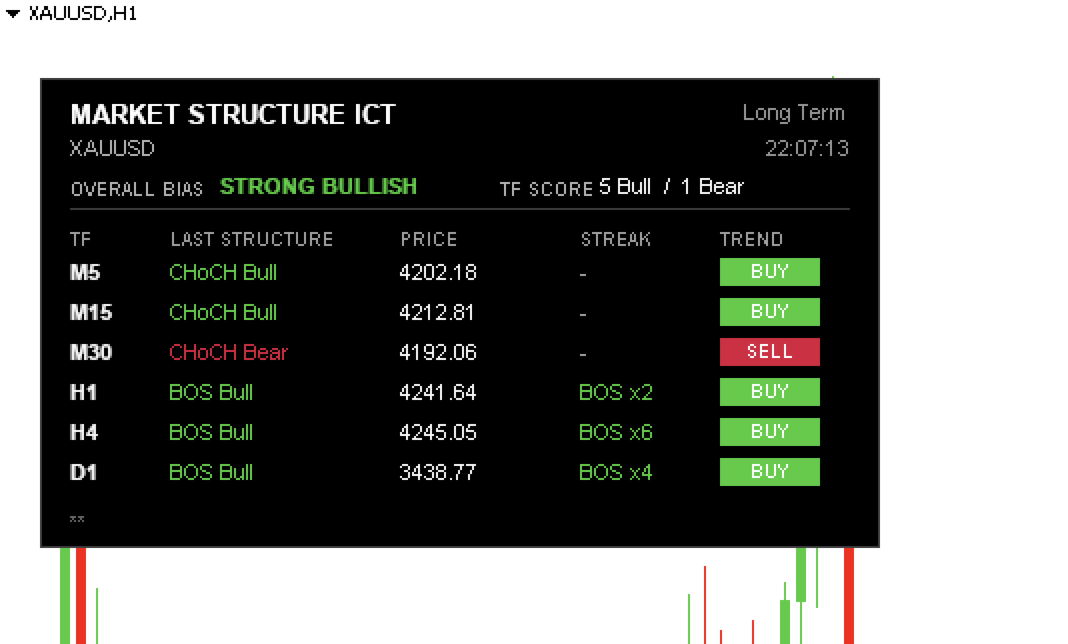
2. Profesyonel Gösterge Paneli (Dashboard) Diğer zaman dilimlerini kontrol etmek için ekran değiştirmeye gerek yoktur.
-
Tek Bakışta Analiz: Panel, tüm zaman dilimlerinin (M1'den W1'e) durumunu tek bir ekranda gösterir.
-
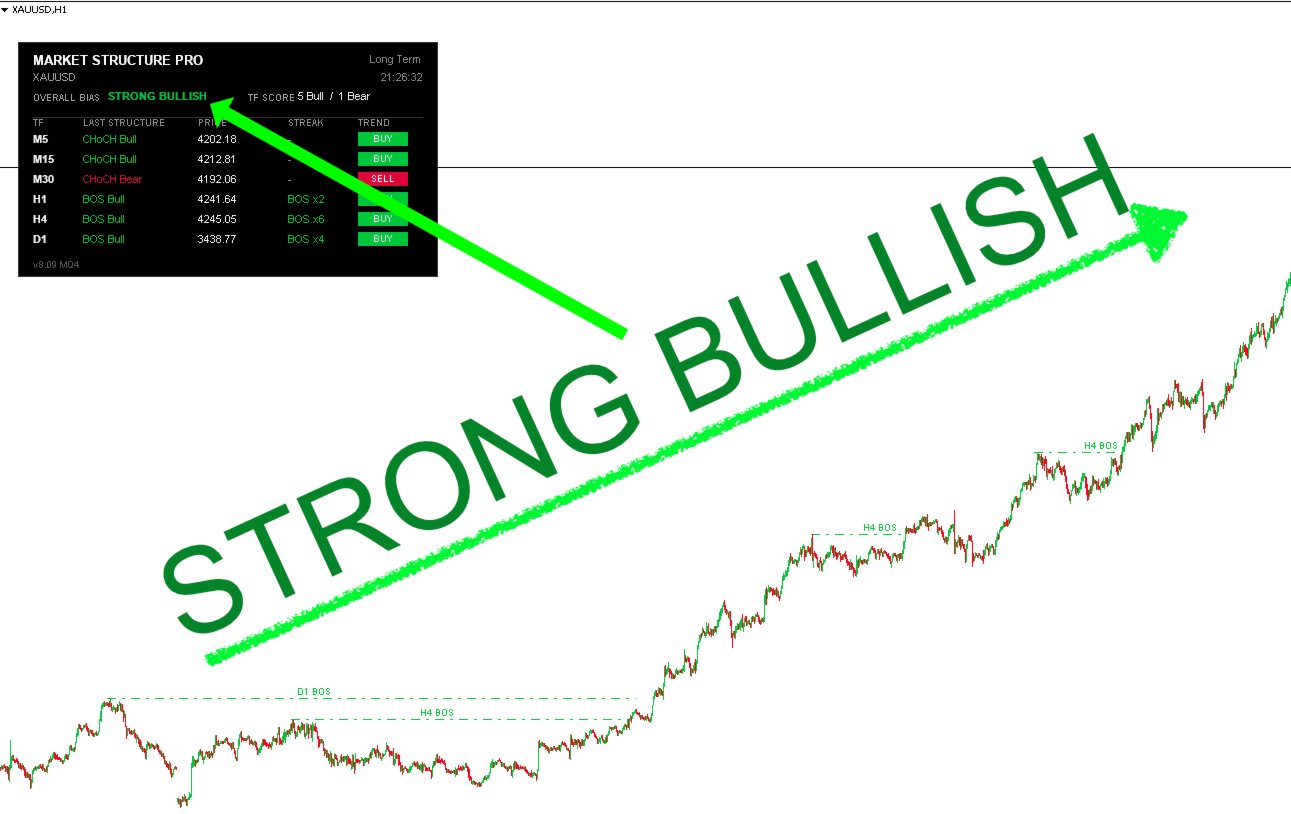
Puanlama Sistemi: Alt zaman dilimlerinden puan toplayarak Genel Eğilimi (Overall Bias) (örneğin "Güçlü Boğa" veya "Karışık") özetler.
-
Trend Tazeliği: Bir kırılımın (BOS) "Yeni Kırılım (Fresh Break)" olup olmadığını bildirir.
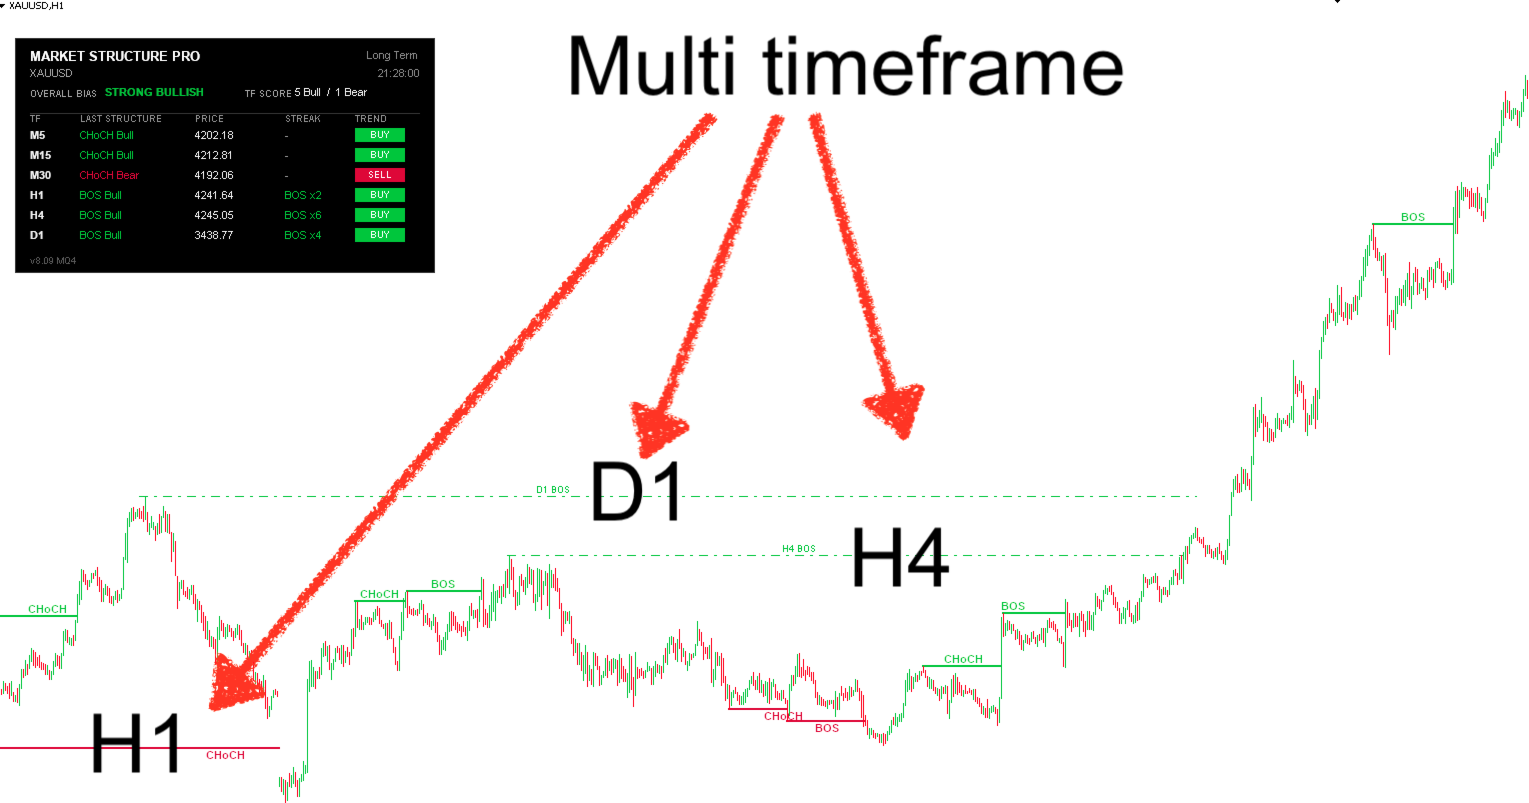
3. Grafik Üzerinde MTF Gösterimi Hassas giriş noktaları bulmak için güçlü bir özelliktir.
-
Küçük Grafikte Büyük Resmi Görün: M5 grafiğini açabilir, ancak indikatörün H1 veya H4 yapılarını doğrudan üzerine çizmesini sağlayabilirsiniz.
-
Fayda: Yönü kaybetmeden düşük zaman dilimlerinde işlem yapmanıza ve büyük destek/dirençleri anında görmenize yardımcı olur.
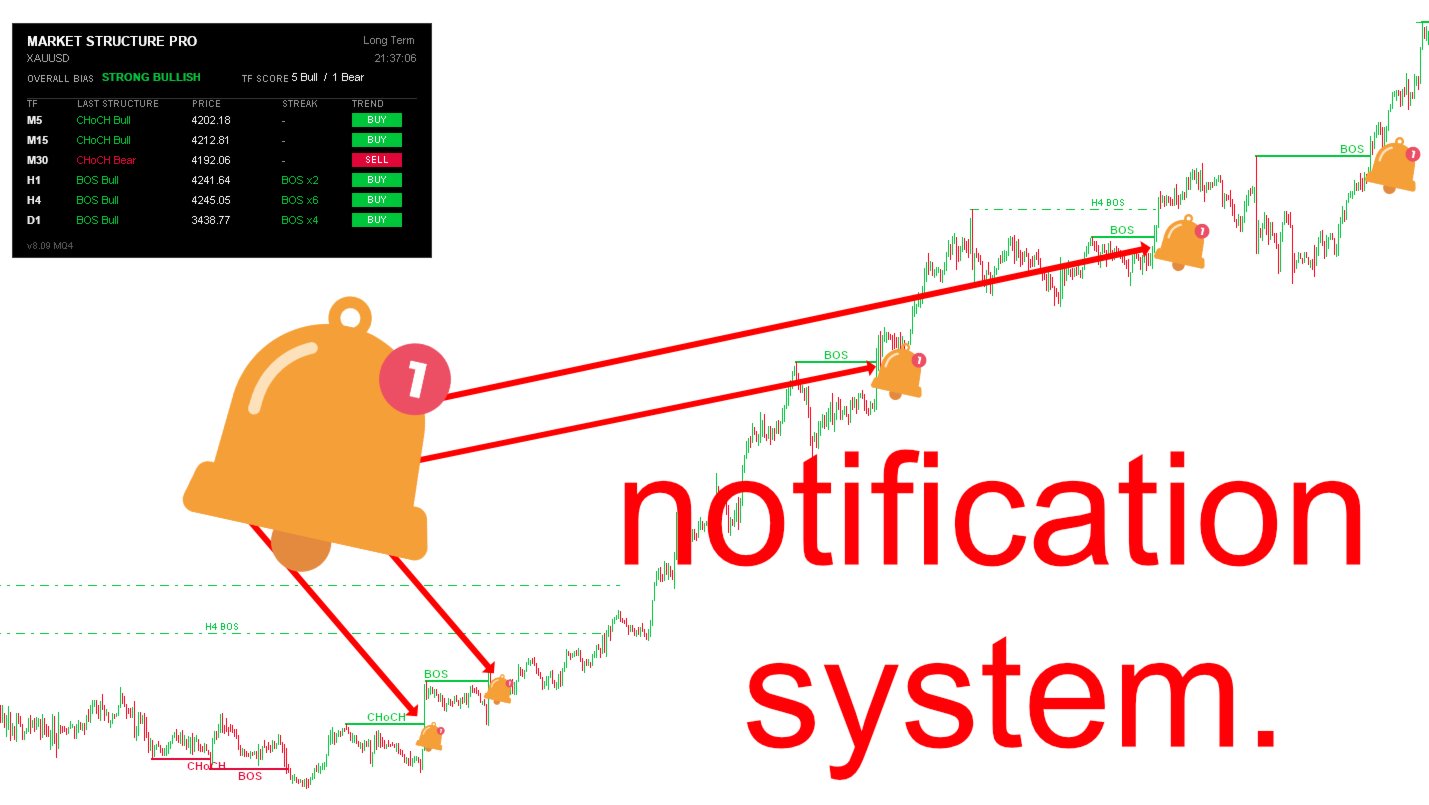
4. Akıllı Uyarı Sistemi
-
Hiçbir Fırsatı Kaçırmayın: Ekran Popup uyarılarını ve mobil Push bildirimlerini destekler.
-
Sinyal Filtreleme: Sadece ilgilendiğiniz zaman dilimlerinde yapı kırılımleri olduğunda uyarı verecek şekilde ayarlanabilir.


Kullanıcı değerlendirmeye herhangi bir yorum bırakmadı