Extended Traders Dynamic Index MT5
- Indicators
-
Sergey Efimenko
 Hello everybody!
If you have any problems with my product just contact me, I will try to help you as soon as possible.
Try the demo for the strategy tester, you will probably find a good assistant to create your own trading strategy.
Best regards, Sergey! - Version: 1.8
- Updated: 6 March 2024
- Activations: 7
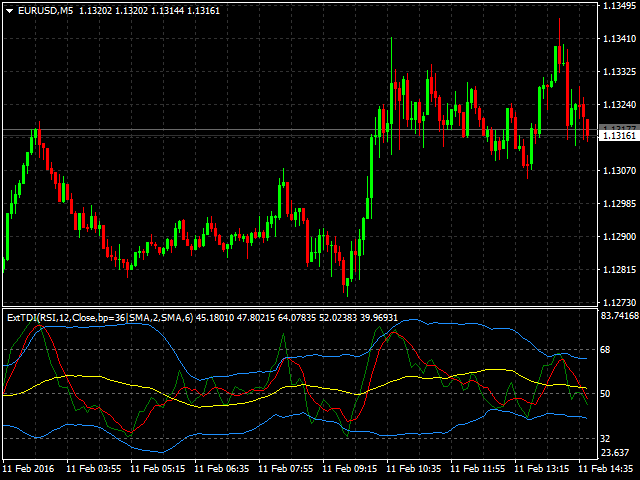
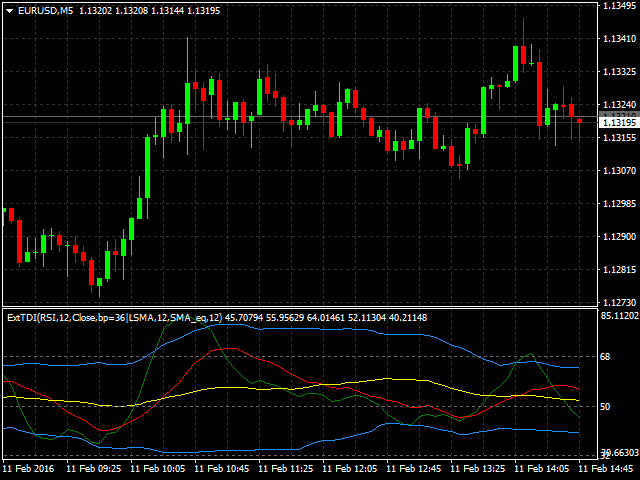
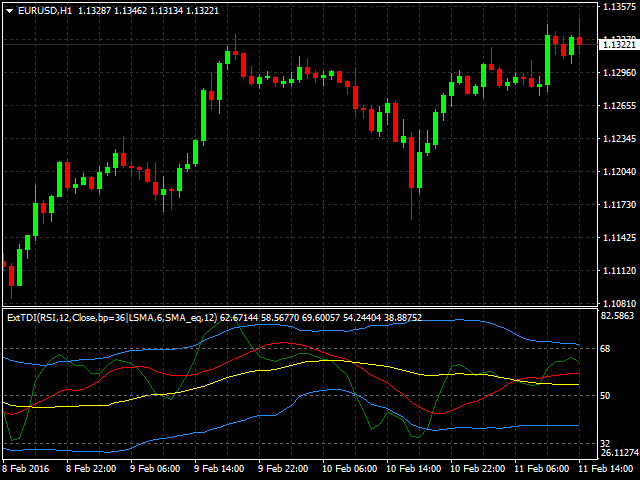
The indicator allows you to determine the current price direction and market volatility. This version of the Traders Dynamic Index (TDI) has the redrawing of the historical data eliminated, the algorithm calculation speed optimized, more external parameters for a more precise adjustments, and its functionalities extended: added the selection of the initial oscillator and the smoothing methods of the averages.
Parameters:
- Mode Osc - estimation oscillator selection;
- Period Osc - the calculation period of the oscillator used;
- Price Osc - applied price for the oscillation calculation;
- Osc volatility bands period - volatility period of the oscillator;
- Osc volatility bands multiplier - volatility multiplier of the oscillator;
- Smoothing Osc price line period - smoothing period of the main line;
- Smoothing Osc price line method - smoothing method of the main line;
- Smoothing Osc signal line period - smoothing period of the signal line;
- Smoothing Osc signal line method - smoothing method of the signal line;
- Use original levels - enables the addition of the initial horizontal levels of the indicator.
A great indicator for MT5. Can't thank Sergey enough. Completely configurable, I have mine set to the old MT4 'Pro' settings. Author answers questions very quickly and went out of his way to make a purely cosmetic alteration. 5 Stars+ Many thanks.