Watch the Market tutorial videos on YouTube
How to buy а trading robot or an indicator
Run your EA on
virtual hosting
virtual hosting
Test аn indicator/trading robot before buying
Want to earn in the Market?
How to present a product for a sell-through
Expert Advisors and Indicators for MetaTrader 4 - 41

Draw and Sync Objects Multiple Charts 1. Draw objects by key press. ( You must: 1. Press Function key => 2. Click where you want to draw => 3. Draw it => 4. Press ESC to complete). (If you don't want to draw after pressing function key, you must press ESC to cancel). 2. Developing : Sync selected objects to multiple charts by button. 3. Developing: Hide objects that do not belong to the current symbol (Objects drawn with this indicator will belong to the symbol they are plotted
FREE

Easily access to a deep knowledge of the market movement with "M.M. Deepness Arrows"!! This indicator will give you advices on buys and sells after having analized the deepness of the market. The entrance "trigger" will be given after studying each candles' max and min avoiding, this way, the misleading data released by the opening and closure prices (given by the brokers). Thanks to the use of these arrows you'll be able to easily understand if i'ts the right time to buy or sell. If you want th

Precision Pulse: High-Conviction Trend-Following Indicator Product Overview Precision Pulse is an advanced, multi-factor trend-following indicator engineered to deliver high-probability trade signals by rigorously aligning the long-term trend, short-term momentum, and overbought/oversold conditions. It minimizes market noise and whipsaws by requiring all foundational components to converge before generating an entry signal. Signal Mechanics: The Core of Precision Precision Pulse ensures trade q
FREE
Powerful Order Block indicator in Tradingview platform. Indicator type: Price Action indicator Introduction: The Order Block Indicator - Elevating Your Price Action Analysis. If you're seeking a comprehensive Order Block indicator on the MQL5 platform, look no further.
Firstly, according to this indicator, an OB is understood as a zone of pending orders from large institutions that haven't been fully executed, revealing themselves in the market through subtle signs. Prices react strongly whe

Levels indicator based on the previous day. Mathematical formula determines entry and exit levels.
Trading recommendations. Levels are traded at the beginning of the European session when volatility appears. In case of insufficient volatility use half of take profit to exit. If the price reversed at half take profit, then on the reversal look for a target also at the level of half take profit. If the price bounced from the entry level, then in the opposite direction the price can reach the se
FREE

This dashboard shows you the 3MA Cross Overs current status for Multi-currency multi-timeframes. Works for Metatrader 4 (MT4) platform. Detailed Post:
https://www.mql5.com/en/blogs/post/759238
How it Works:
MA Cross Signals It will show “S” Green/Red Strong Signals and “M” or “W” Green/Red Medium or Weak signals. We have 3 types of MA: Faster, Medium and Slower MA. A strong signal is when FasterMA and MediumMA are both above/below SlowerMA. A medium signal is when only FasterMA is above/below

A simple expert Advisor based on the signals of the Stochastic indicator in the overbought zone - sell, in the oversold zone - buy. Add friends, send your interesting strategies. Perhaps after discussing all the nuances, I will write an adviser for free .
Parameters:
"_Slippage" - Slippage;
"_Magic " - Order ID;
"_ Lot " - Volume;
"_ StopLoss" - Stop;
"_CloseBalanse" - Closing by balance;
"_CloseBalanseLose " - Loss in the account currency;
"_ClosePercentBalanse" - Closing
FREE

A simple but very powerful EA. It uses two moving averages as a basis for opening orders, which when they cross, orders will be opened. The open order will be closed in two situations: When there is a new crossover opposite the previous one, in this case the price touches the slower moving average, or when it reaches the automatic Take Profit margin. If the price goes in the opposite direction, it will open new orders at the new crossings of the moving averages to calculate the average price and
FREE
An Expert Advisor based on the 3 candlestick pattern.
1-SL, 2-TP, 3-OFF - 1 pulls up StopLoss. 2 pulls up TakeProfit. 3-disabled.
auto SL / TP on hi-low count bars - number of bars for 1-SL, 2-TP expiration on profit - after passing N bars, TP changes
expiration on loss - after N bars have passed SL to open an order + commission pips for loss expiration - the number of points for expiration on profit
The rest of the settings are intuitive.
FREE

AlphaPrice MT4 is a trading Expert Advisor (EA) designed for the Forex market and other financial markets via the MetaTrader 4 platform. It is based on a price momentum trading strategy, allowing it to effectively capture strong price movements while minimizing risks during stagnant periods. The EA uses minimal settings, making it easy to set up quickly, and completely avoids risky methods such as martingale and grid strategies. Key Features: Momentum Trading – The EA analyzes market mom
FREE

YOU CAN NOW DOWNLOAD FREE VERSIONS OF OUR PAID INDICATORS . IT'S OUR WAY OF GIVING BACK TO THE COMMUNITY ! >>> GO HERE TO DOWNLOAD
The popular saying in forex "The Trend is your friend" has always stood the test of time because it is valid statement for every generation of traders and in every market. Most successful traders do not fight against the trend but lend to flow with it.
Sometimes finding the best pair to trade can be a daunting task even when you have a good strategy . Some
FREE

MACD Divergence Scanner is a multi-timeframe and multi-symbol dashboard and alert that checks all timeframes and symbols to find regular and hidden divergences between price chart and MACD indicator. This divergence scanner is integrated with support and resistance zones so you can check the MACD divergences in the most important areas of the chart to find trend reversals in the price chart. Download demo version (works on M 1,M5,M30,W1 timeframes) Full description of scanner parameters ->

The News Filter based EA Controller (NFC) is a very convenient utility to control the live trading status of your Expert Advisors during important news events. The NFC was programmed to prevent all Expert Advisors of live trading during significant news events. The NFC is resource-efficient and uses the Forex Factory Calendar. It is not necessary to set offset hours dependent on your broker, it will be done by the NFC. The NFC was successfully used and tested under MetaTrader 4 on a personal com

Dynamic CMF Calculation: Customize the period for the Chaikin Money Flow (CMF) to fine-tune your analysis and maximize signal precision. Intuitive Color-Coded Alerts: Instantly interpret market conditions with clear visual cues: Green Alert: Indicates the Overbought zone – signaling a potential selling opportunity. Red Alert: Indicates the Oversold zone – suggesting a potential buying opportunity. Gray Alert: Represents the Neutral zone – a signal to wait for a confirmed trend or reversal. Autom
FREE
Unleash the full potential of your trading strategy with the Dynamic Range Breaker indicator! This essential tool is engineered to pinpoint significant market turning points and strong trend continuations, giving you the clarity and confidence to act. The Dynamic Range Breaker focuses on identifying clear "breakouts" from previous high and low points, signaling when the market is ready to make a decisive move. Forget the guesswork; this indicator empowers you with precise, actionable signals dir
FREE
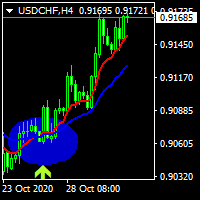
hi dear today i write an indicator of crossing 2 moving averages and show a label for the signals of it . .......................you can select the period of movings and the method of moving............... ......................and also method of apply price and see the movings and signals.................. ................also you can turn off showing movings to see just signal labels.......................... ................................................wish the best for you................
FREE
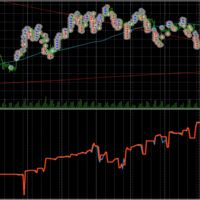
Graph shows your balance and equity in real time similar to the tester graph which is nice to see your real progress vs tester graph. This code was copied from mql5.com, it is free and it works i am just putting it here to make it easier for us https://www.mql5.com/en/code/13242
https://www.mql5.com/en/code/8454 .. original code
Equity Monitor 1. Monitoring balance 2. equity 3. margin 4. profitability 5. drawdown Original idea and code by Xupypr (Igor Korepin) Remake by transcendreame
FREE

The indicator defines the Bullish and Bearish Engulfing Bar. The pattern has greater reliability when the open price of the engulfing candle is well above the close of the first candle, and when the close of the engulfing candle is well below the open of the first candle. For an engulfing bar to be valid it must fully engulf at least one previous bar or candle - includes all the body and the wick. The engulfing bar can engulf more than one bar as long as it completely engulfs the previous bar.
FREE

is a user-friendly MetaTrader 4 indicator that creates a centralized dashboard for traders to oversee several cryptocurrency pairs simultaneously across different timeframes, presenting price movements through simple dots or miniature candlestick charts, complemented by volume indicators to facilitate quick assessments of market trends and fluctuations. It automatically resizes grid cells according to the number of bars shown per timeframe for better use of screen space, features adjustable co
FREE

What is The Commitment of Traders (COT)? The Commitment of Traders (COT) report is a weekly publication of net positions in the future market that is released on Fridays by CFTC commission. It is an outline for the commitment of the classified traders as commercial traders, speculators (non-commercial traders), and non-reportable traders. We use this report to understand the dynamics of the market. The commitment of commercial traders is not important for us because they take a position to he
FREE

The Volume Weighted ATR indicator is a helpful tool for measuring market activity. It is based on the idea of the Volume-Weighted ATR. Combining these two elements helps identify potential turning points or breakout opportunities. The indicator for the classification of the activity of the market uses the moving average and its multiples. Accordingly, where the VWATR bar is located (relative to the moving average), it is labelled as ultra-low, low, average, high, very high or ultra high. Th
FREE

SAR Expert Advisor works automatically 24 hours from monday to friday and use VPS so that the robot works 24 hours from Monday to Friday and to get maximum trading results. This ea uses Scalping , Trend, and Trailing Stop Strategy. This system uses the Parabolic SAR indicator to open positions. Live Account Minimum balance required : $100 use cent account, deposit $500 use cent account, deposit $1000 use micro account SAR Expert Advisor works for this: Currency pairs: GBP/USD Timef

Unlock Your Trading Potential with Our Smart and Advanced EA!
Unleash the power of our high-tech Expert Advisors to refine your trading strategy and supercharge your overall performance. Witness maximum profit potential and minimized risks. Our EAs seamlessly integrate with various account types and trading platforms. Enjoy the flexibility to incorporate our EA into your existing strategy without any hassle.
Tap into the potential of artificial intelligence for market analysis. Our EAs con
FREE

This EA only created for AUDCHF with an Risk Reward 1:2 Download Set Files - CLICK HERE NO GRID, NO MARTINGALE and NO MORE OVERTRADING. Add This to Activate News Filter - https://ec.forexprostools.com/ Features :- Symbol AUDCHF Brokers IC Markets, Tickmill, Pepperstone Account Type Raw Spread, Pro, Razor Leverage Recommended 1:500 Timeframe 15M Settings Download Minimum Deposit $100 Risk Reward 1:2 Strategy Market Movement
Why Should You Use This EA:
Market Movement Strategy. Hard
FREE
Is Zero Lag profitable? Not always, different system is for different pairs. You can play around with this indicator from Mladen, I have modified it with Bollinger Bands over T3.
You can change the period and how it calculate. MT5 version is available too.... Please leave a review , it helps us and we will share more indicators. .... Thank you and happy trading
FREE

Pinbar Detector is a MetaTrader indicator that tries to detect Pinbars (also known as "Pin-bar" or "Pin bar") and marks them by placing a "smiling face" symbol below the bullish Pinbars and above the bearish Pinbars. It is a pure price action indicator, which is not using any standard technical indicators in its code. The configuration of Pinbar detection can be done via the indicator's input parameters. Pinbar Detector can issue platform alerts and email alerts on detection.
As you can see o
FREE

JAPAN AI is a trading robot that operates automatically in the GBPJPY forex market.
You don't need to worry about parameter configuration for this EA. It is ready to start trading on the GBPJPY M30 . The only decision you need to make is regarding the lot size. The backtest in the description is made for the last three years.
This expert advisor includes a system that identifies trends and filters out market noise. It places orders based on the direction of the trend.
Moving Average, Alligat
FREE

The Bullish and Bearish Engulfing Pattern Screener for MetaTrader 4 is a powerful tool designed for traders looking to identify key reversal patterns in the financial markets. This indicator scans price charts for bullish and bearish engulfing patterns, which signal potential trend reversals. Key Features: Real-time Scanning : Continuously analyzes price data to provide instant alerts when engulfing patterns are detected. Customizable Settings : Allows users to adjust parameters to fit their tra
FREE

This is the HFT Flame Ea....This is a complex Expert Advisor that basically pick trades from price movements, it is also a none-martingale mechanism with netting strategy that makes this Ea more interested and profitable throughout your trading journey. The HFT Flame EA can be super consistent on profits depending on the inputs selected for your style of trading. This is a hand free trading robot that can trade your way to success while you are away from the charts, another perfect advantage abo
FREE

This adviser can be used without optimization. To get started, you only need to install the desired risk (or the size of the lot) and regularly withdraw profit. For a start, you can install the trial version of the Expert Advisor Hunter bot PriceLines Lite , which will work on a real account with a minimum lot (and therefore with minimal risk). In this, the main version, all settings are available. EA is designed for fully automated trading. It spelled out the function of protection against most

Th3Eng Bird Scalper is simple scalper, Many expert traders recommend using it with big accounts with a low lot size. It opens positions based on Analyses.
next new version:: Add news filter Add more filters
Requirements::
Account Balance: 5000$ minimum Spread: Not more than 30 points (3.0 pips). Account type: any account (standard, micro and cent). Platform Digits: Pentagonal platform (five digits symbol price and three on yen symbols X.XXXXX on EURUSD NOT X.XXXX).
Best Setups: EURUSD, 15M E
FREE

What is ADR? Quite simply, ADR (Average Daily Range) is the average of price movement over a period of time. It can be used as a gauge of how far price may move on any given trading day. This indicator calculates 5, 10, 20 Average Daily Range Features: - Average: Daily Range, Prev 1/5/10/20 days - Calculator maximum stop loss/profit target by Risk/Reward percent of ADR in Pips. - Candle countdown - ... Contact me if you need: https://t.me/Cuongitl
FREE

How to Create an Automated Trading Robot Have you ever wondered how powerful it would be to automate your trading strategies with just a few clicks of the mouse? Imagine having the freedom to create and test different trading strategies without the need to dive into complicated code. With Rule Plotter, this vision becomes a reality. Here we will explore how you can create your own custom trading robot using Rule Plotter, a trade-system creation tool that simplifies the entire process. What is Ru
FREE

Advanced ideas of the popular MACD indicator: It detects and displays classic and reverse divergences (three methods of detecting divergences). It uses different color to highlight an uptrend and a downtrend. Two methods of determining a trend: а) MACD crosses the 0 level (classic signal); б) MACD crosses its own average (early signal). This is a multi-timeframe indicator: it can display MACD data from other timeframes. Two methods of drawing: classic histogram and line. It generates sound and v

Arrow indicator without redrawing and delay The indicator shows the best trend entry points on the chart. It is better to use it in conjunction with other trend indicators as a filter. The indicator shows good results on lower timeframes. The signal is generated inside the candle and appears as blue and red arrows. Displays signals at the zero bar
Settings
Step : Calculation of bars in history
Bar : Shows bars in history
Delta : Offset of the signal from the candle
FREE

Gold Frenzy FX USES THE TREND WAVE INDICATOR AND IT CAN IDENTIFY THE BEGINNING AND THE END OF A NEW WAVE TREND MOVEMENT.
AS AN OSCILLATOR, THE INDICATOR IDENTIFIES THE OVERBOUGHT AND OVERSOLD ZONES.
IT WORKS GREAT TO CATCH THE SHORT TERM PRICE REVERSALS AND USES A MARTINGALE STRATEGY TO CLOSE ALL TRADES IN PROFIT.
USE DEFAULT SETTINGS ON H1 OR HIGHER TIME FRAME ON ANY PAIR FOR MORE ACCURATE TRADES
WHY THIS EA :
Smart entries calculated by 3 great strategies The EA can be run on even a $2
FREE

Master Candle (MC) Indicator automatically detects "Master Candles", also known as "Mother Candles", i.e. candle that engulf several candles that follow them. See screenshots. You can choose how many candles Master Candle should engulf. By default it is set to 4. Feel free to change colour and thickness of lines as it suites you.
I find this indicator to be very useful to identify congestions and breakouts, especially on 60 minutes charts. Usually if you see candle closing above or below "Maste
FREE
Vertical Lines for Hour - Time-Based Trading Indicator The Vertical Lines for Hour indicator allows you to mark up to 4 vertical lines at specific times on your chart. Simply enter the hour without considering the minutes, and you can also choose the color for each line. This indicator is useful for identifying session ranges or implementing custom trading strategies. It provides a straightforward solution for your trading needs. Key Features: Mark up to 4 vertical lines at specified times. Sele
FREE
The indicator determines overbought/oversold zones on various timeframes. Arrows show market trend in various time sessions: if the market leaves the overbought zone, the arrow will indicate an ascending trend (arrow up), if the market leaves the oversold zone, the arrow will indicate a descending trend (arrow down). Situation on the timeframe, where the indicator is located, is displayed in the lower right window. Information on the market location (overbought or oversold zone), as well as the
FREE

Slave EA (v1.x) – All Key Features Signal Reader
Grabs Master’s trade signals (via GlobalVariable or CSV) in real time. Trade Copier
• Opens new trades to match Master
• Updates SL/TP instantly when Master modifies
• Closes trades the moment Master closes them ️ Smart Filters & Options
• Symbol Filter – Copy only specified pairs or “ALL”
• Direction Filter – BUY only, SELL only, or BOTH
• ️ Lot Control – Multiply Master’s lot or set a fixed lot size
•
FREE

Unlock the secret to consistent growth in your trading account with Constant Grow , the ultimate trading indicator. Powered by a combination of advanced indicators including RVI Signal, Moving Average, Volumes, Stochastic, and Alligator, this revolutionary tool has been meticulously backtested over a two-year period (2021-2023) to ensure its effectiveness. With Constant Grow , you can now protect and expand your account balance while minimizing risks. Our expert advisor takes care of all money
FREE

Forex Trader Bot is a powerful Advanced Expert Advisor for Breakout and Trend Strategies is an intelligent Expert Advisor developed to capitalize on breakout and trend-following opportunities in today’s volatile forex markets. Built with a robust algorithmic structure and smart risk management protocols, this EA is tailored for traders who demand both precision and reliability in automated trading. Unlike conventional EA's, Forex Trader Bot does not rely on outdated tactics such as grid system

Volatrend_EA is a 100% automated trading system designed specifically for the M15 timeframe . Its strategy is based on a confluence of multiple factors—trend, momentum, and volume—to identify high-probability entries in the market. The key differentiator of this EA is its fully adaptive risk management system . Instead of using fixed values, it utilizes the Average True Range (ATR) indicator to dynamically adjust the Stop Loss, Take Profit, and Trailing Stop to the current market volatility. Th
FREE

The VR Grid indicator is designed to create a graphical grid with user-defined settings. Unlike the standard grid , VR Grid is used to build circular levels . Depending on the user's choice, the step between the round levels can be arbitrary. In addition, unlike other indicators and utilities, VR Grid maintains the position of the grid even when the time period changes or the terminal is rebooted. You can find settings, set files, demo versions, instructions, problem solving, at [blog]
You can
FREE

Check my p a id tools they work perfect please r ate Here is an Upgraded version with Bonus Ea in case of purchase it costs 30$ only and you get Ea as Bonus: https://www.mql5.com/en/market/product/96835 This indicator is experimetal, it shows TMA channel arrows with Volatility filter built in to avoid lagging. Try to experiment with it, search for better conditions of use. It is possible to adjust different timeframes for TMA and for Volatility filter Same time on the current chart, so it ma
FREE
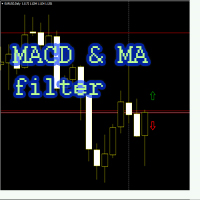
The MACD and MA filter EA trades on the MACD indicator, uses the filter as two moving averages (fast MA is higher than slow MA - buy, sell - contrary), the Martingale is applied at the request of the User (the amount of lot multiplication for a series of losses is limited), breakeven, trailing stop, inverting the signal. In EA version 1.4. added closing an order by a reverse signal, separately by the MACD indicator (parameter Close_By_Reverse_MACD_Signal), separately by moving averages (paramete
FREE

For traders, monitoring price movements is a constant activity, because each price movement determines the action that must be taken next. This simple indicator will helps traders to display prices more clearly in a larger size. Users can set the font size and choose the color that will be displayed on the chart. There are three color options that can be selected to be displayed on the chart.
FREE

Индикатор "INFO Spread Swaзp Info Panel" для MT4, вспомогательный инструмент для торговли.
- Индикатор показывает текущий спред и свопы валютной пары, к которой он прикреплен. Также идикатор показывает: 1. Дату и время сервера 2. Название сервера 3. Название влютной пары. 4. Спред 5. Своп 6. Открытые позиции 7. Отложенные ордера 8. Максимальная просадка после открытия индикатора 9. 30% от депозита. (можно менять) Можно менять положение, размер, цвет шрифта, расстояние между строками.
FREE

Hello. Another free indicator from Sepehr! ;) You can determine the trend with this tool. Using crosses of two Moving averages, you can say that the trend is going to be bullish or bearish; A fast-moving average and a slow one. When the fast-moving crosses up the slow-moving, it's going to be an uptrend and when it crosses down the slow-moving, it means that you are going to have a downtrend. That's easy ;) Hope to enjoy it Sepehr(Faran)
FREE

This is a fully automated scalping Expert Advisor that can be run successfully using EURUSD currency pair at H1 timeframe.
This EA can't run in the same account. If you want an Expert Advisor that trades daily this is not because it requires patience to wait for a few days or weeks on the right opportunity for it to trade. It takes advantage of the volatility of the price movement.
FREE
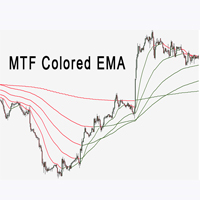
The Multi Time Frame EMA indicator is of great help in determining trend direction. It can be an excellent addition to your existing strategy or a new foundation. We humans can make better decisions when we see better visually. So we designed it to show different colors for uptrends and downtrends. Anyone can customize this in the way that works best for them. We can set the Ema indicator for all timeframes on a chart.
FREE
Find Your Trading Direction with Signal Compass Pro ! Tired of guessing your next move? Signal Compass Pro is your answer. This indicator isn't just a tool; it's your personal compass in the financial markets. By combining three powerful momentum indicators— CCI , WPR , and Force Index —we provide confirmed trading signals that are cleaner, more reliable, and less prone to "noise." Key Features & Advantages Confirmed Signals: No more guesswork. This indicator merges the power of three momentum i
FREE

There may be a problem with the EA.
The account has been restricted without any particular explanation, and I am unable to delete the EA.
As I will be conducting an investigation, please be careful when using it.
We recommend testing on a demo account. I am also restricted from posting comments, so I’m sorry that I cannot reply at the moment. Please wait for a while.
A high-performance EA “FUJIYAMA” developed with cutting-edge correlation coefficient analysis algorithms, which increased $10,
FREE

Are you tired of plotting fibonacci retracements or extensions manually? This indicator displays fibonacci retracements or extensions automatically, calculated from two different price points, without human intervention or manual object anchoring. [ Installation Guide | Update Guide | Troubleshooting | FAQ | All Products ] Easy to use Manual anchoring is not needed Perfect for price confluence studies The indicator evaluates if retracements or extensions are needed Once drawn, you can manually
FREE
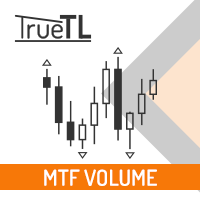
Highly configurable Volume indicator.
Features: Highly customizable alert functions (at levels, crosses, direction changes via email, push, sound, popup) Multi timeframe ability Color customization (at levels, crosses, direction changes) Linear interpolation and histogram mode options Works on strategy tester in multi timeframe mode (at weekend without ticks also) Parameters:
Volume Timeframe: You can set the lower/higher timeframes for Volume. Volume Bar Shift: you can set the offset of the l
FREE

Elevate Your Trading: Discover the Power of CCI Maestro! Are you tired of confusing charts and missed opportunities? Meet CCI Maestro , the sophisticated yet simple-to-use indicator designed to give you clear, high-probability entry and exit signals right on your chart. CCI Maestro isn't just another arrow indicator—it’s a powerful fusion of three top-tier analytical methods: the volatility-based Commodity Channel Index (CCI) , dynamic Simple Moving Average (SMA) Bands for price action confirma
FREE

Gold Heavy is a professional Expert Advisor (EA) specifically engineered for trading XAUUSD (Gold) . The system focuses on capturing medium-term impulse price movements and executes trades only when a clear trend is identified , ensuring precision and consistency. With its proprietary filtering algorithm , Gold Heavy effectively eliminates false signals, providing optimal entry points for potentially higher profits. Usage Tips No dangerous trading strategies – No Martinga

Signals and Alerts for AMA (Adaptive Moving Average) indicator based on these MQL5 posts: Adaptive Moving Average (AMA) and Signals of the Indicator Adaptive Moving Average . Note : this tool is based on the code of AMA indicator developed by MetaQuotes Software Corp.
Features The signals are triggered at closing of last bar/opening of a new bar; Any kind of alerts can be enabled: Dialog Box, Email message, SMS notifications for smartphones and tablets, and Sound alerts; Customizable
FREE

Pattern Explorer is a reliable tool for applying all the power of the most popular Japanese Candlestick Patterns . It uses Machine Learning algorithms to confirm all the patterns. What is the most impressive thing about it? Select Take Profit and Stop Loss and click on “Backtest your strategy” button to backtest your strategy in real time and to see according to your selection: Total signals Testable signals (signals that are reliable to be tested) Profitable signals (%) Loss signals (%) Total p
FREE

Identification of support and resistance areas
A useful indicator for traders
completely free
Can be used in all symbols
Can be used in all time frames
It has three different trends: short term, medium term, long term
Settings:
Clr1,2: You can change the color of the lines
Type Trend: You can determine the trend
Message me for questions, criticism and suggestions
FREE
Seamlessly switch between 13 (9 mt4 default and 4 popular custom) time frame with this tool. Real ease of switching between default and custom time frames. Note indicator does not create custom time frame chart data, it only enables you to switch to and from them. Creating a custom time frame can be done using the default mt4 period converter script attached to a lesser default mt4 time frame. Example attach period converter on M1 and set period multiplier to 10 to have a custom M10 chart.
FREE
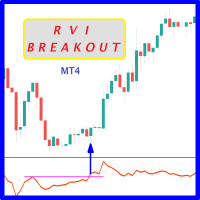
Probability emerges to record higher prices when RVi breaks out oscillator historical resistance level. It's strongly encouraged to confirm price breakout with oscillator breakout since they have comparable effects to price breaking support and resistance levels; surely, short trades will have the same perception. As advantage, a lot of times oscillator breakout precedes price breakout as early alert to upcoming event as illustrated by 6th screenshot. Furthermore; divergence is confirmed in case
FREE

Индикатор "Стрелки" (Arrow Drawing Tool) Краткое описание: Удобный инструмент для рисования стрелок на графике с помощью кнопки и мыши. Позволяет визуально отмечать направления движения цены, уровни поддержки/сопротивления и важные ценовые зоны. Основные возможности: Простое управление - кнопка "Стрелка" для активации режима рисования Автоматическая окраска - зеленые стрелки для движения вверх, красные для движения вниз Настраиваемый дизайн - регулируемая длина и угол наконечника стрелки Г
FREE

Unleash Your Trading Potential with Momentum Strength Signal! Tired of lagging indicators and confusing market noise? Momentum Strength Signal is the cutting-edge tool built to give you a decisive edge by focusing on what truly drives prices: pure market force . This isn't just another average indicator; it's a dynamic system that identifies the exact moment a trend begins and confirms its validity, helping you enter and exit trades with confidence. Why You Need This Powerhouse Indicator: Preci
FREE
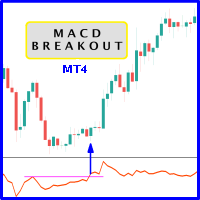
Probability emerges to record higher prices when MACD breaks out oscillator historical resistance level. It's strongly encouraged to confirm price breakout with oscillator breakout since they have comparable effects to price breaking support and resistance levels; surely, short trades will have the same perception. As advantage, many times oscillator breakout precedes price breakout as early alert to upcoming event as illustrated by 2nd & 3rd screenshot. Furthermore, divergence is confirmed
FREE

Introducing HammerMaster EA , your ultimate trading assistant designed for the MQL5 market. Harness the power of technical analysis with our expert advisor that identifies and capitalizes on hammer candlestick patterns. Whether you’re a novice or an experienced trader, HammerMaster EA offers robust features to enhance your trading strategy and maximize your potential profits. Strategy Overview HammerMaster EA is based on the identification of hammer candlestick patterns, specifically the bulli
FREE

The Candle Countdown Timer for MetaTrader 4 (also available for MT5) is a vital indicator designed to help you manage your trading time effectively. It keeps you updated about market open and close times by displaying the remaining time before the current candle closes and a new one forms. This powerful tool enables you to make well-informed trading decisions. Key Features: Asia Range: Comes with an option to extend the range. Broker Time, New York, London Time: Displays the current broker time
FREE
Multi-Indicator Reversal EA v2.04
Overview
An MT4 automated trading system that combines three technical indicators—RSI, Bollinger Bands, and ADX—for a counter-trend strategy. It runs on any timeframe and supports both traditional single-position trading and hedged trading.
Specifications
Platform: MT4
Recommended Pairs: Major FX pairs (e.g., EUR/USD, GBP/USD, USD/JPY)
Timeframes: All timeframes supported (M1–MN1)
Strategy Type: Counter-trend
Position Management: Selectable Single Posit
FREE
This EA has no stop loss. All risks are at your discretion.
This is Free EA, It can make you profitable if you use it carefully. Please don't ask for the MQ4 file, I'm using it to develop other robots.
Gegenpressing EA is a fully automatic Expert Advisor for Scalping Trading on XAUUSD timeframe M1 but also in others. The basic strategy starts with Market order in Trend Following, so this EA Follow the Trend . M1 Trend…. very very fast.
If you like this EA and want to help me develop
FREE

Product Title Smart Parabolic SAR (MT4) – part of the SmartView series Short Description A Parabolic SAR indicator with a unique user experience on MetaTrader platform. Features advanced capabilities not previously available, such as opening settings with double-click, hiding and showing indicators without deleting them, and displaying indicator windows at full chart size. Designed to work seamlessly with the rest of the SmartView Indicators series. Overview The SmartView series offers a unique
FREE
The MetaTrader Market offers a convenient and secure venue to buy applications for the MetaTrader platform. Download free demo versions of Expert Advisors and indicators right from your terminal for testing in the Strategy Tester.
Test applications in different modes to monitor the performance and make a payment for the product you want using the MQL5.community Payment System.
You are missing trading opportunities:
- Free trading apps
- Over 8,000 signals for copying
- Economic news for exploring financial markets
Registration
Log in
If you do not have an account, please register
Allow the use of cookies to log in to the MQL5.com website.
Please enable the necessary setting in your browser, otherwise you will not be able to log in.