Watch the Market tutorial videos on YouTube
How to buy а trading robot or an indicator
Run your EA on
virtual hosting
virtual hosting
Test аn indicator/trading robot before buying
Want to earn in the Market?
How to present a product for a sell-through
Expert Advisors and Indicators for MetaTrader 4 - 39

The Quality trend indicator expresses the ratio of the strength of a trend or the speed of its growth (fall) to the degree of its noisiness or a certain norm of amplitudes of chaotic fluctuations of a growing (falling) price. The position of the indicator line above zero shows an increasing trend, below zero - a falling trend, the fluctuation of the indicator line near zero shows a flat. If the indicator line begins to fluctuate rapidly around zero and approach it, then this indica

Master Candle (MC) Indicator automatically detects "Master Candles", also known as "Mother Candles", i.e. candle that engulf several candles that follow them. See screenshots. You can choose how many candles Master Candle should engulf. By default it is set to 4. Feel free to change colour and thickness of lines as it suites you.
I find this indicator to be very useful to identify congestions and breakouts, especially on 60 minutes charts. Usually if you see candle closing above or below "Maste
FREE
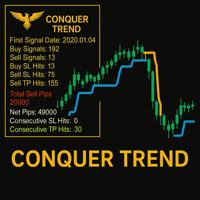
Conquer Trend – Master the Trend Like Never Before! Conquer Trend is your ultimate solution for dominating the markets with precision and simplicity. Built for traders who want to ride the strongest trends across any pair and any time frame, this powerful indicator brings together trend detection, retest confirmation, and performance tracking — all in one streamlined tool.
Multi-Timeframe Trend Analysis Get a clear view of the trend across multiple timeframes. Whether you're scalping, day tra
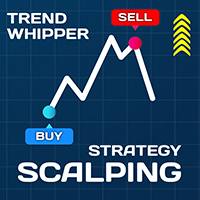
Scalping Strategy Trend detection is one of the basic challenges of every trader. Finding a way to tell when to enter a trade is very important, timing is a game changer, not too early and not too late. Sometimes, due to not knowing the market conditions, the trader closes his positions with a small profit or allows the losses to grow, these are the mistakes that novice traders make. Indicator Trend Whipper is a complete trading strategy and can improve the trader's trading process. The trend de
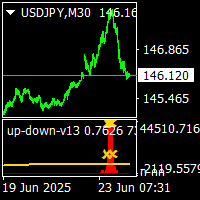
up-down v13 indicator is no repaint and works all pairs and all time frames charts. it consumes too much time need at least i5 cpu.pc v.2.2 use les cpu.but it sometimes cahange back signals.any one request it i will give bonus it. it is suitable also 1 m charts for all pairs. and hold long way to signal. dont gives too many signals. when red histogram cross trigger line that is up signal.and price probably will down when blue histogram cross trigger line that is down signal.and price probably
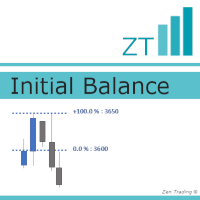
Initial Balance is a concept for the first hour of a trading session, lowest(starting) to highest point, that often determines important support / resistance for the next hours. It is based on Fibonacci levels and offers very relevant levels of reaction. Nowadays, it's mainly used for the first hour BEFORE the open. --------------- The advantage of this indicator lies here : - you could define by yourself the period for YOUR Initial Balance (first hour of a trading session, one hour before the o

This EA is configured to trade after London market open and all defined time ranges. This is one of the most popular strategies that every serious trader should know well. The "London Breakout Trader" EA is a trully flexible system that will allow you nearly everything to get configured from hard SL TP Trailing SL with Trailing Step, Range size fileter, Auto Parameters based on range size and all you need to set it to work for you. This EA is even more you can configure trading days hours and ra
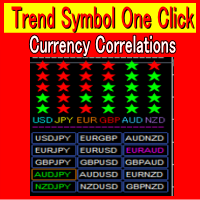
Currency Strength Meter 1:Correctly identifying trends in foreign exchange investments is critical. 2:TrendSymbolOneClick quickly detects and displays trends that have just begun and those that have already been in place for an extended period of time. 3:There is also a USD JPY EUR GBP AUD NZD strength function. 4:Volatility allows you to know exactly when there is a major market move. 5:You can save time in your market analysis by using Trend Symbol One Click. 6:Analysis available from 1 minut

Based on TheStrat by Rob Smith (@robintheblack) #thestrat , which is a trading method that Rob has developed over a 30 year career in the market. This is TheStrat Timeframe Continuity scanner that allows you to constantly scan either the Stocks, Currency pairs, indices or commodities that you want to watch. The time frames that you can watch can be (Year, Quarter, Month, Week, Day, H4, H1, 15M and smaller if you feel like it). It tells what the current candle is doing. It is either inside b

Hello You can copy orders between terminals for any computer via Internet (MT4 to MT4) or (MT4 to MT5) or (MT5 to MT4) or (MT5 to MT5)
it's fast Open orders Modification Stop Loss and Take Profit Close Orders This is EA (slave) put it in Experts folder you must buy (Copy orders for any computer via Internet Master) EA too from this link if you want to copy from MT4
https://www.mql5.com/en/market/product/55096 if you want to copy from MT5
https://www.mql5.com/en/market/product/56397
Please w

Power Renko is an indicator which plots Renko bricks underneath the chart using a histogram. You can select the brick size and the timeframe of the Renko bricks as well as whether or not to use the close price or the high/low price of the candles. Renko bricks are based on price alone, not time, therefor the Renko bricks will not be aligned with the chart's time. They are extremely useful for trend trading and many different strategies can be formed from them. Buffers are provided allowing you t
The advantage of using this EA This EA directly updates takeprofit and stop losses that are still empty in a manual order
Parameters Multiplier: Multiplier value of the previous transaction Distance: Distance hedging from the previous order Takeprofit: take profit taken from the last price + the value of this column
We recommend that you do not add more than one manual transaction in the same pair martingale hedging | manual hedging | hedging manual | hedging lot | best robot | best ea

Circle Scalper is a high-performance Expert Advisor (EA) meticulously designed for news trading, particularly during periods of high market volatility. Utilizing a sophisticated algorithm, it positions limit orders to take advantage of rapid price movements that often follow major economic announcements. By targeting short, intense price swings on the 1-minute time frame, Circle Scalper capitalizes on brief but impactful trading windows to secure gains efficiently.
This EA has been optimized

In the ever-evolving world of Forex trading, understanding the different trading sessions is paramount to making informed trading decisions. Each trading session brings its own unique characteristics, opportunities, and challenges, and recognizing these can greatly enhance your trading strategies. Whether you're a novice or a seasoned trader, the Forex market's three main trading sessions – Asian, London, and New York – are crucial milestones that dictate market behavior and potential trade set

Tick Speed Pro povides a charted record of tick speed to allow you to see the ebb and flow of market activity. Observing patterns in tick speed may allow you to better time entries to reduce slippage and re-quotes.
The tick speed plot updates it's entire position to show you only the last N seconds you choose, ideal for scalping and HFT approaches. An alert is provided to signal when the instrument is getting ticks at a higher rate than the alert limit. Multiple loadings are supported to compare

Overview RetraceX Scalper is an advanced pullback scalping bot that utilizes Support & Resistance levels to identify high-probability retracement entries. It ensures precise trade execution with minimal risk and maximum reward, making it an ideal tool for traders who focus on quick pullback opportunities.
Key Features Support & Resistance Detection: Identifies strong market zones for accurate trade setups. Pullback Entry Optimization: Scans for high-probability retracement entries to maximize

Offer 249 down from 350 for the next 3 copies. then back to 350 $
Are you tired of using outdated indicators that leave you guessing where to set your profit targets? Look no further than the AK CAP Opening Range Breakout Indicator. This powerful tool is backed by a US patent and has already helped countless traders pass funded challenges like FTMO. We use it daily on our prop traders and internal funds, and now it's available to you as well. The calculation behind the indicator is incredibly a

MACD is probably one of the most popular technical indicators out there. When the market is trending, it actually does a pretty good job, but when the market starts consolidating and moving sideways, the MACD performs not so well. SX Impulse MACD for MT5 is available here . Impulse MACD is a modified version of MACD that works very well for trading Forex, stocks, and cryptocurrencies. It has its own unique feature which perfectly filters out the values in a moving average range and enables it t

Why the RSI Alert Indicator is Essential for Your Trading Toolkit
In the fast-paced world of trading, timely and accurate information is crucial. The RSI Alert Indicator is a powerful tool designed to help you stay ahead of the market by providing real-time alerts when the Relative Strength Index (RSI) reaches critical levels. Whether you're a novice trader or a seasoned professional, this indicator can significantly enhance your trading strategy by pinpointing potential market reversals with

Mathematical Hedging - Trade like a Bank !
The strategy rule is to create a pending order instead of the Stop Loss with a bigger lot size then the first trade on the level where the Stop Loss might occur.
Below a strictly theoretical example (without taking into consideration the real settings of the EA) The position is placed according to the trend on D1 chart of an instrument.
If we consider that we have LONG position on GOLD from the price 1488.00 with Take Profit 1500 and Stop

Gioteen Volatility Index (GVI) - your ultimate solution to overcoming market unpredictability and maximizing trading opportunities. This revolutionary indicator helps you in lowering your losing trades due to choppy market movements. The GVI is designed to measure market volatility, providing you with valuable insights to identify the most favorable trading prospects. Its intuitive interface consists of a dynamic red line representing the volatility index, accompanied by blue line that indicat
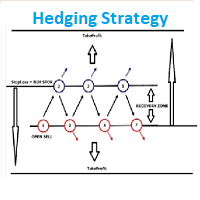
EA Hedging Strategy Is a high class automated expert advisor which is fully optimized for the future market in EURUSD etc. M5. No Loss forex Hedging Strategy and work with the open orders and open position orders to get opportunities to enter and exit trading.
ADVANTAGES: Advanced market entry filter. Automatic Money manager. High spread protection. Slip Protection. Does not use indicator.
Trailing stop and Take Profit.
No need for optimization.
RECOMMENDATIONS: leverage: 1:500!, working
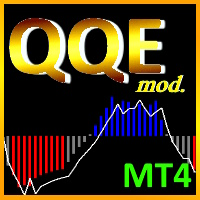
The Quantitative Qualitative Estimation (QQE) indicator is derived from Wilder’s famous Relative Strength Index (RSI). In essence, the QQE is a heavily smoothed RSI.
Modification of this version: ( converted from tradingview script by Mihkell00, original from Glaz, 100% identical output)
So there are Two QQEs. One that is shown on the chart as columns, and the other "hidden" in the background which also has a 50 MA bollinger band acting as a zero line.
When both of them agree - y
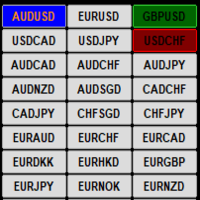
This indicator display current profit/loss status for each pair visually on a single chart. If the current open chart pair is selected and a trade/s are opened for that pair only the Symbol name is highlighted and the button color reflects the current trade/s status if the selected chart pair does not have any open trades then the button color is Blue. The input options are :
1/ Select Pairs automatically from the Market Watch
2/ Manually select your own Pairs
3/ Select all MT4 Timeframes aut

Indicator finds most prominent extremums (highs and lows) in history and displays their price levels for currently visible range of prices. 8 levels are shown at most. This is a tool for those who used to lookup the history for important levels formed by reversal points outliers. If price scale is changed manually or adjusted automatically for changes in time scale, indicator visualize all found levels (if any) inside visible area. The width (importance) of a level depends from a number of times

You can now use the conventional price charts to display Renko bars. This indicator can send dialog boxes with alerts, push notifications to mobile devices and emails. You can easily use this indicator to create Expert Advisors, because the indicator uses buffers.
Indicator parameters Renko size, points - size of Renko bars Arrows gap, points - distance to the signal arrows Alerts - true/false - use pop-up alerts when signals appear Push notifications - send Push notifications to the mobile ter

The indicator compares Fractal and Zigzag indicators to define hard Support and Resistance. The arrow signal appears when a new support or resistance emerges or when the price breaks through Support and Resistance zone. This indicator is efficient in conjunction with a rebound and breakout strategy. It works well on H4 and D1 for all pairs.
Settings BarCounts = 200; FastPeriod = 7 - fast period SlowPeriod = 14 - slow period Show_SR = true - show support/resistance Show_Arrows = true - show up/d

Instant Pitchfork is built for traders who rely on quick and precise pitchfork trend structures to plan entries, stops, and targets. Click an anchor on the chart and Instant Pitchfork automatically draws the best-fit Andrews’ Pitchfork for the current market structure.
Click the anchor again to instantly switch between Andrews’, Schiff, and Modified Schiff pitchfork modes to find the best structural fit in seconds. Works on any symbol and any timeframe.
Instant Pitchfork — Quick Manual 1. Atta
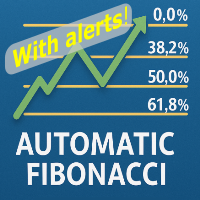
Automatic fibonacci with alerts is an indicator that automatically plots a fibonacci retracement based on the number of bars you select on the BarsToScan setting in the indicator. The fibonacci is automatically updated in real time as new highest and lowest values appear amongst the selected bars. You can select which level values to be displayed in the indicator settings. You can also select the color of the levels thus enabling the trader to be able to attach the indicator several times with d

The indicator visualizes the result of the CalculateScientificTradePeriod script (which, of course, also needs to be downloaded), which, firstly , estimates how many Mx bars of the active chart the future trend will most likely continue and what is its quality, and, secondly , calculates the optimal the averaging period (which is also equal to Mx) of the ScientificTrade indicator, which gives the maximum profit according to the extremely effective ScientificTrade strategy. For the FindS
Introduction
The Convergence Divergence Suite contains 17 indicators , built-in MT4 technical indicators and custom ones . The list will be increased in subsequent versions as per users' requests. Any selected indicator is loaded on your chart then automatic Convergence and Divergence trend lines are drawn on the chart and indicator. This tool is important if you use any of the listed indicators or convergence/divergence in your strategy. Advantages With the Convergence Divergence Suite you d

Welcome to the world of SMC (Smart Money Concepts) Trading, where we empower traders with the tools and knowledge to make smarter trading decisions. Our latest addition to our suite of trading tools is the SMC Trading Pro indicator, version 1.0. Key Features: Major Market Structure Identification with BODY break. Order Block must be in Major Swing ( not Small Swing ). Order Block with Fair Value Gap Detection. Order Block in Discount | Premium zone. Filter for only Bullish, Bearish or All Order

Fully featured Pivots and Levels indicator Pivots: Floor (normal), Woody, Camarilla, Fibonacci Levels: ATR, Historical Volatility with standard deviations, Close Price Volatility with standard deviations
Features: 4 +/- levels MTF, pivots/levels based on Daily, Weekly, 4hr or even 15min Hour and minute time offset
Texts with prices and pip distances to central pivot/level Inputs for Camarilla/Fibonacci/ATR/Volatility levels
Alerts, popup, push, email, sound, live or completed candles on level c
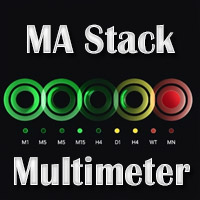
Basic MA Stack Indicator: This is a single timeframe & single currency indicator. It looks at MAs and show 3 possible states on chart: When all MA Align Upwards: Stack Up When all MA Align Downwards: Stack Down If MAs not aligned: Stack None Available for free here: https://www.mql5.com/en/market/product/69539
You can position the small block on your chart. And get current status of the Stack. It is simplistic and very eash to use and can guide you to find good trends in your strategies. Buy St

Reverse Martingale, also known as the "Paroli" betting system, is a gambling strategy used primarily in games of chance such as roulette, blackjack, or even sports betting. Unlike the traditional Martingale system, where a player doubles their bet after a loss, the Reverse Martingale involves increasing the bet after a win and reducing it after a loss. This strategy is often employed by individuals hoping to take advantage of winning streaks and capitalize on short-term gains. Here's how the Rev
This indicator marks Inside Bars (bars with a lower high and a higher low than the previous bar) on your chart. It will also send alerts when one forms, including via e-mail or push notification to your phone . It's ideal for when you want to be notified of an inside bar set-up but don't want to have to sit in front of your chart all day. You can configure all the settings including: What symbol (if any) is plotted to highlight an inside bar Whether the symbol is plotted above the bar or below t
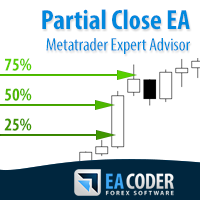
The most simple and easy to use Partial Close EA (by Rimantas Petrauskas ) The main idea of this EA is to apply partial close to your positions. EA will automatically find your open market positions and apply partial close according to your settings. For those who do not know what Partial Close is: it is simply an action to close only a part of your position. For example, if your trade lot size is 1.2 and you close 25% of it (which is 0.3) you will still have 0.9 lot size trade running and exist

EA Black Wolf initiate a cycle of buy or sell depending of the trend of a built-in indicator, thus the EA works according to the "Trend Follow" strategy, which means following the trend. Recommend pairs EURUSD,GBP USD, EURAUD,AUDJPY,GBPAUD,CADJPY
Time Frame M15
Recommend deposit 1000 usd or 1000 cents Recommend settings Default SETTINGS Lot type - lot type calculation (can be Constant, based on risk or Constant size per 1000) Lot size - lot size Trade Buy - allow the adviser to buy Trade
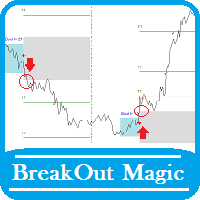
<< See how it works on YouTube >> You can also download the script of this indicator for free here: BreakOutMagic_EA.ex4 Then copy it to the following address: ...\MetaTrader 4\MQL4\Experts Note that in order for the script to work, it must have already downloaded and activated the Break Out Magic indicator from the market. Possibilities:
Arrow signal to buy, sell and hit the targets Alert signal send mail Execute custom audio file The Break Out Magic indicator monitors price fluctuations over

The GGP Wave Trend Oscillator MT4 Indicator is a volatility and momentum tool designed to help traders optimize their trading performance and providing traders find the most accurate market reversals. This indicator is MT4 conversion of the Indicator: WaveTrend Oscillator [WT] by “ LazyBear “ in Trading View website and some alert methods are added to provide real-time alerts when a trading signal is generated, in order to allow traders to act quickly and efficiently. When the oscillator is ab
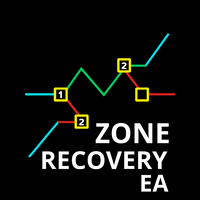
The Zone Recovery Hedge strategy works by creating a price zone between two levels (above and below the current entry price). Instead of closing a losing position at a stop loss, the system opens an opposite (hedging) position when price moves against the trade. This creates a "zone" in which future movements can help recover the loss. Initial Trade : A buy or sell order is placed. Zone Definition : A fixed distance (in pips) from the entry is set to trigger a hedge order in the opposite directi

This indicator shows main trend, entry zone and exit zone. This is a muti-timeframe indicator, so it is always repainting in the current period of the higher timeframe.
Features Colorful Histogram: it indicates the main trend, the tomato means the market is bearish,and the sky blue means the market is bullish. Inner Blue Bands: it is entry zone for entry market, the market is relatively safe for entry. Outer Yellow Bands: it is exit zone for exit market, the market is oversold or overbought.

The UT Bot Alert MT5 Indicator is an advanced technical analysis tool designed to help traders optimize their trading performance. This indicator is MT5 conversion of the UT Bot alerts indicator by “QuantNomad “ in Trading View website and some alert methods are added to provide real-time alerts when a trading signal is generated, in order to allow traders to act quickly and efficiently. Key Features: Alert Types: in addition to the terminal pop-up alerts, the mobile notification sends the alert
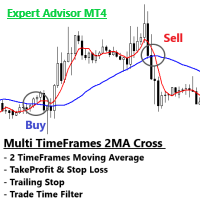
Multi Timeframes of 2 Moving Averages Cross Timeframes 1 = Executor Position (MA1 Cross MA2 from bottom = buy, MA1 Cross MA2 from Upper = sell) Timeframes 2 = Trend Detector (MA1 > MA2 = Uptrend, MA1 < MA2 = Downtrend)
How it works If MA1 > MA2 in Timeframes 2, then MA1 Cross MA2 from bottom in Timeframes 1, output = Buy If MA1 < MA2 in Timeframes 2, then MA1 Cross MA2 from Upper in Timeframes 1, output = Sell
Expert Advisor Features - Fixed Lot - Stop Loss and TakeProfit - Trailing Stop - Mu

Fx Market Dashboard is a very innovative tool that features very professional graphics. Simplifying the reading of the market has always been our prerogative and we believe that with this tool everyone can better understand the market. This tool is mainly concerned with giving us a clear view of what are the strongest and weakest currencies, through this information we can begin to better understand where the market puts money or takes away money. The reading of the percentage logic serves to h

Super oscillator indicator is an oscillator designed to calculate trend reversal points. A set of bar calculations and a set of algorithms to calculate trend reversals. Level probing system with high probability trends. All of these features combine to make it easier for investors to find trends.
Suggestions and Features There are two levels on the super oscillator indicator. They are at levels of 0.5 and -0.5. The oscillator bar should be below -0.5 to find the upward trend. And a blue color t

This Expert advisor does not do any trade, but it scans the whole symbols in your market watch and scan each shares one by one in different timeframes and at the end it shows you which symbol in which timeframe has a powerful engulfing candle. Furthermore, you can define a MA period and a high and low RSI limit, and it shows you which symbols in which timeframe is going to cross the adjusted moving average, and which symbol in which timeframe is going to cross high or low limit of the RSI. The
FREE

FoxTrotTWO EA is a scalper Expert Advisor intended for EURUSD. It is also available for other major pairs and cross currency pairs. Recommended timeframe is M15. FT2 trades a narrow range at night. At the top and bottom of the range, FT2 will try to generate trades in the opposite direction. To open suitable trades, the Expert Advisor uses several indicators and analyzes several timeframes. But the trades are generated by price actions and are not opened by the indicator. FT2 requires a modera

This is MT4 version ,MT5 version: https://www.mql5.com/zh/market/product/1 35425 Warning: This is Martingale EA, with extremely high risk!!! Expert Advisor (EA) is not omnipotent, using this EA means agreeing to bear the risk of all losses incurred by the EA Trading financial products such as foreign exchange and gold are high-risk products that may result in zero principal. Please be aware of the risks before trading
This is Laodengxi 429 EA FREE! This is a Martingale EA
FREE
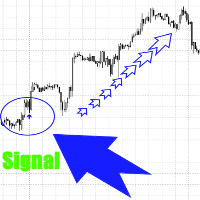
Данный индикатор не перерисовывает сигналы и это значит , что там, где он нарисует стрелку там она и останется. Сигналы рисуются здесь и сейчас, а не спустя время , когда цена прошла уже далеко.
Индикатор отлично подойдёт для трендового рынка.
Индикатор является помощником в торговле, он даёт сигнал на покупку или продажу, а вы принимаете решение использовать рекомендации индикатора или нет.
Цена на индикатор минимальна и может вырасти в любое время.
Работает на любых инструментах,таймфрейм

The Investment castle II ea trading robot has a variety of features, including: The ability to remember open positions, their take profit and stop loss levels if the VPS or terminal is restarted. The ability to remember trade buttons and their setup if the VPS or terminal is restarted. The ability to plot profit/loss on a chart, but only when the user runs the visualizer and on live charts. It automatically disables this feature when backtesting or optimizing settings for improved speed and perf

"The trend is your friend" is one of the oldest and best-known sayings in financial markets. However, this message only represents half of the picture. The correct saying should be, "The trend is your friend only until it ends." KT Trend Filter solves this problem by clearly indicating the start of an Uptrend and Downtrend using an averaging equation on the price series. If the trend direction is not clear, it shows the trend as sideways showing the uncertainty in the market.
Features
Get a big

Smooth Heikin Ashi provides a more smoothed signal of bull or bearish trends than regular Japanese candlesticks, or even the standard Heikin Ashi candles. Heikin Ashi as an alternative candlestick pattern that has been in use since its invention in Japan back in the 1700s. On normal Japanese candlesticks, there is a lot noise with mixed bearish and bullish candles side by side, even during trends. Heikin Ashi reduces this noise leaving an easier visual representation of trends. This indicator is

KT Trend Magic shows the trend depiction on chart using the combination of market momentum and volatility. A smoothing coefficient is used to smooth out the noise from the signal.It can be used to find out the new entries or confirm the trades produced by other EA/Indicators.
Usage
Drag n drop MTF scanner which scans for the new signals across multiple time-frames. Find new entries in the trend direction. Improve the accuracy of other indicators when used in conjunction. Can be used as a dynami

Contact me after payment to send you the User-Manual PDF File.
Double Top/Bottom Pattern
Double top and bottom patterns are chart patterns that occur when the underlying investment moves in a similar pattern to the letter "W" (double bottom) or "M" (double top). Double top and bottom analysis are used in technical analysis to explain movements in a security or other investment, and can be used as part of a trading strategy to exploit recurring patterns. Searching for this pattern among the cha

50% off. Original price: $375
Reward Multiplier is a semi-automatic trade manager based on pyramid trading that opens additional orders with the running profit of your trades to maximize return exponentially without increasing the risk. Unlike other similar EAs, this tool shows potential profit/loss and reward to risk ratio before even entering the first trade!
Download Demo here (starting lot is fixed at 0.01) Guide + tips here MT5 version here
You only open the first order. When your tr

JHON WICK , un avanzado Asesor Experto diseñado para la plataforma MT4. Inspirado en la maestría de llenado de mechas de las velas, JHON WICK utiliza estrategias innovadoras para aprovechar al máximo los patrones de mechas en los gráficos de velas. Características Principales: Mastering Candlestick Wick Fill: JHON WICK se especializa en identificar y capitalizar las oportunidades presentes en las mechas de las velas. Su algoritmo avanzado analiza los patrones de mechas con precisión, permitiéndo
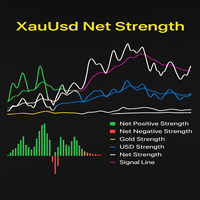
The XauUsd Net Strength indicator is a professional-grade market strength tool designed to track and compare the relative performance of Gold (XAU) against the U.S. Dollar (USD) across a diversified basket of currency pairs. Instead of relying on a single chart, it aggregates information from multiple gold- and dollar-based pairs, applies weighting factors, and translates the results into an easy-to-read strength comparison. The indicator plots six components in a separate window: Green & Red Hi

RSI Signals is a simple dashboard type indicator that displays the values of the RSI (Relative Strength Index) oscillator on various instruments and time frames chosen by the user. In addition, it can be configured by the trader to show signals when the RSI is in an overbought/oversold condition, when it crosses these levels or when it crosses the 50 level, which is important in some strategies. It is simple and easy to set up. By itself, it should not be used as a trading system since RSI signa
Signal King EA: Master the Market with Precision Tired of complex trading strategies and inconsistent results? The Signal King EA (Expert Advisor) is your new command center for automated trading, meticulously engineered for high-performance execution on the volatile Gold market (XAUUSD). This is not just another trading bot. It's a calculated, self-adjusting system that spots high-probability entry points using a refined Signal King indicator , fortified by crucial momentum, volatility, and vo

Dear users, January will be the last month that I will keep LL Gold Miner EA for sale at the price of $45 . From next month I will update the prices bringing the lifetime license to $250 , in order to guarantee the exclusivity of the strategy . However I will unlock the ability to rent the EA for 1/3/12 months while keeping the prices reasonably lower. So this really is your last chance to secure your lifetime copy of this fantastic strategy at this price . Don't mis

Unleash Precision Trading with Ultimate Trend Sniper EA Tired of manual trading mistakes and missing the big market moves? The Ultimate Trend Sniper EA is your ticket to effortless, high-precision trend following. This Expert Advisor (EA) is engineered to spot and capitalize on the strongest trends using a sophisticated, volatility-aware system, giving you a powerful edge in the Forex market. Gold Ready & Optimized! This version comes pre-configured and fully optimized for trading Gold (XAUUSD)

Результаты торговли в Telegram
https://t.me/BtcScalperTm
https://studio.youtube.com/video/ET1NM1AdbYo/livestreaming
Recommended timeframe M5 Протестировать советник невозможно, потому что:
Сложная логика тренда основана на: Анализ изменения цен за последние 9 секунд Сравнение с пороговыми значениями (60-70 баллов) Использование этих данных для принятия решений о входах, выходах и управлении позициями Сочетание с техническими индикаторами (SAR, полосы Боллинджера) Это позволяет советнику ад
The Ichimoku indicator is an entire system by itself with an amazing win rate many traders feel that the chart looks like a mess when we add the indicator to the chart this is because there are too many elements present in the indicator we have a solution for that now "TT Ichimoku on off button indicator" ABOUT THIS INDICATOR This is an Ichimoku indicator that has the toggle feature separately for every element ie. Kumo cloud button, kijun button, etc... you can also hide/show the indicator

Display your Local Time on your charts
Display your local time instead of (or along with) MT4 server time.
Display crosshair which highlights current candle time.
Automatically adjusts based on chart zoom (zooming in or out).
Displays on every timeframe (M1 – Month), and auto-adjusts as chart timeframe is changed.
Handles special ½ hour time zones , such as India.
Renders fast (no lag) as you scroll charts.
Customize the font family, font size, background color, and crosshair col

RSI strategies EA supports multiple RSI based strategies. Purchasing this EA can save you the time taken to automate your existing RSI strategy, through coding a custom EA and it also helps you discover profitable RSI strategies as its fully compatible with the strategy tester and all settings are editable. The EA supports both scalping, short term and long term strategies. The various supported settings are explained below: NOTE: The default settings in the EA are simply place holders. Before

Vizzion is a fully automated scalping Expert Advisor that can be run successfully using GBPJPY currency pair at H1 timeframe. Very Important
This Expert Advisor can not run with any EAs in the same account. As part of the money management plan, it calculates and monitors the Margin Level % and assumes that all open trades are created by it. If you want an Expert Advisor that trades in a daily basis, this EA is not for you because using this requires a patience to wait for a few days or weeks on
Pointer synchronization is an indicator with which the pointer can be synchronized in all the visible charts of the terminal. It shows a crossed cursor in all the visible charts of the terminal, in position relative to the cursor of the active chart. To activate the indicator, simply press the button that appears in one of the corners of the chart once the indicator is added to the chart. To deactivate the indicator, simply press the button again. Once the indicator has been deactivated, the cr

Introduction to GARCH Indicator GARCH is the short initial for Generalized Autoregressive Conditional Heteroskedasticity and it is the volatility prediction model commonly used in financial industry. GARCH model was first appeared in the work by Danish Economist, Tim Peter Bollerslev in 1986. The 2003 Nobel Prize winner, Robert F Engle also added much contribution for the refinement of GARCH model with Tim’s work. Our GARCH INM predictor took the original method of Nelder Mead for GARCH model bu
FREE
EA BBMA OA Technical Analyzer PRO EA BBMA OA Technical Analyzer PRO is an Expert Advisor based on the BBMA Oma Ally trading methodology, enhanced with an aggressive technical approach.
It is designed to accurately detect BBMA structures and execute automated entries with high responsiveness. The EA is equipped with Martingale , Hedging , and Pairing Close systems to enhance flexibility in position management and boost profitability under modern market conditions. Support & Community
For q
The MetaTrader Market is the best place to sell trading robots and technical indicators.
You only need to develop an application for the MetaTrader platform with an attractive design and a good description. We will explain you how to publish your product on the Market to offer it to millions of MetaTrader users.
You are missing trading opportunities:
- Free trading apps
- Over 8,000 signals for copying
- Economic news for exploring financial markets
Registration
Log in
If you do not have an account, please register
Allow the use of cookies to log in to the MQL5.com website.
Please enable the necessary setting in your browser, otherwise you will not be able to log in.