适用于MetaTrader 4的EA交易和指标 - 41

Telegram Forwarder can forward all activities related to trades and position taking as a signal to Telegram messenger. It can also forward indicators' alert to Telegram if you modify indicator code (I can do it for you too) to hand over alerts to Telegram Forwarder. This EA is intended for business and professional usage. You can introduce your own Telegram bot and customize water mark in screenshots.
Telegram forwarder is able to forward signals for "new order", "modification of order", "Pendin

这是一个半自动EA,不使用任何类型的指标,参数也很简单。
包括一个主订单(你在图表上上传的第一个订单为买入或卖出),你可以使用两个反向订单进行对冲。
主订单。被称为初始订单(当击中SL时,EA停止交易,直到你在图表上重新启动它)。
第一个反向订单。它与主订单在所需的点位距离上相对开。
第二反向订单:它与第一反向订单在所需的点位距离上反向开仓。
参数 :
主交易方向 - (初始订单的方向,长或短)。
手数 - (你可以在三个订单中的每一个使用不同的手数,这个EA可以控制)。
对抗主交易的移动,启动反转交易的点数 - (第一个反转订单打开的点数距离)。
与反转交易相反,启动第二个反转交易 - ( 第二个反转订单将与第一个反转订单打开的点数距离 )
在TP之后重新打开订单 - ( 如果 "true",EA将在同一方向重新打开订单,这包括所有的初始订单和反转订单)
SL后重开订单 - (如果 "真",EA将在反转交易触及止损后重开订单)请注意,反转订单只有在达到您在输入设置中调整的理想点位距离时才会重开交易。
因此,例如。如
FREE
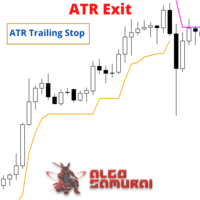
The ATR Exit indicator uses the candle close + ATR value to draw trailing stop lines (orange under buys, magenta over sells) that advance with the trend until the trend changes direction. It uses a multiple of the Average True Range (ATR), subtracting it’s value from the close on buy, adding its value to the close on sell. Moreover, the trailing stop lines are generated to support the order’s trend direction (long or short): In an upward trend, the long trailing stop line (orange line under bu
FREE

** I am currently providing this great EA for free in a limit time. Please download while it is still free **
Tired of emotional trading decisions?
Live monitor: TBD
Introducing our mql4 Expert Advisor , engineered for stable profit with acceptable risk using a genuinely intelligent Dollar-Cost Averaging (DCA) method. This isn't just another EA; it's a long-time tested solution designed to navigate the forex markets with precision.
Whether you trade with a standard USD account or a Cent ac
FREE

!!! New faeture sending Signals as VIP EMAILS
MT4 Telegram Signal is tool, which sends selected trades via magic number to telegram channel, sms and email to user. Tool sends trades when open and close with chart to telegram chanel. It also sends every modification from trades to telegram. Tool can send multiple charts and magic numbers and pairs from a single chart. For this you have to fill in on the chart corresponding magic number to be sent by the chart. Send information of all type of ord
FREE

Gina Dual TPO — Brief MQL4 indicator TPO + Volume profile overlaid on chart — fast, scalable, and beginner-friendly. Built for traders who read market structure by POC and Value Area. What it is An MQL4 indicator that overlays dual market profiles—Time-at-Price (TPO) and Volume-at-Price (VPO)—directly on your chart. It’s fast (pixel-based drawing), scalable, and beginner-friendly. Who it’s for Intraday and swing traders who read market structure via POC (Point of Control) and Value Area to spot
FREE

SAR Expert Advisor works automatically 24 hours from monday to friday and use VPS so that the robot works 24 hours from Monday to Friday and to get maximum trading results. This ea uses Scalping , Trend, and Trailing Stop Strategy. This system uses the Parabolic SAR indicator to open positions. Live Account Minimum balance required : $100 use cent account, deposit $500 use cent account, deposit $1000 use micro account SAR Expert Advisor works for this: Currency pairs: GBP/USD Timef

Didi Index indicator with visual buy and sell alert, with confirmation alert.
Buy or sell alerts, on screen and for mobile phones, with a visual description in colors of the direction on the screen!
A warning in the color of the current direction of the graph on the screen quickly informs you if the pair is bought or sold by Didi Index.
With configurable text position and size, making it easier to follow the trend of the pair.
FREE
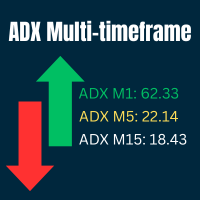
Ultimate ADX Multi-timeframe Indicator This indicator provides real-time ADX values for multiple timeframes in one unobtrusive label panel. It i s especially useful for gauging trend strength across timeframes without constantly switching charts. Choose which periods to display, anchor the panel to any chart corner, and color-code ADX strength levels to your taste. Key Features & Personalization Multi-Timeframe ADX - Toggle visibility for 9 built-in periods (M1, M5, M15, M30, H1, H4, D1, W1, MN1
FREE

Super Signal Series – V5 PRO Major FX Signal Panel (AI Trade Planner's) - Professional Intraday Signal Dashboard
Exclusive Bonus When you purchase this indicator, you receive 2 professional Gold EAs: MT4 Gold EA
XAU Trend Matrix EA – Worth $150 : See the EA https://www.mql5.com/en/market/product/162870 MT5 Gold EA
XAU Steady Gain Pro – Worth $150 : See the EA https://www.mql5.com/en/market/product/162861 Total Bonus Value: $300 Unlock Your Intraday Trading Potential with a Powerfu

Advanced ideas of the popular MACD indicator: It detects and displays classic and reverse divergences (three methods of detecting divergences). It uses different color to highlight an uptrend and a downtrend. Two methods of determining a trend: а) MACD crosses the 0 level (classic signal); б) MACD crosses its own average (early signal). This is a multi-timeframe indicator: it can display MACD data from other timeframes. Two methods of drawing: classic histogram and line. It generates sound and v

A multi-currency Expert Advisor with its own indicator. The main principle of operation is averaging using martingale, the EA has a built-in function for opening deals with a spread limit. For safe trading, the account must have at least $ 100 on a cent account, or $ 10,000 on a classic one . Recommended broker for a classic account www.icmarkets.com or alpari.forex/ru for a cent account. Recommended pairs : EURUSD , AUDUSD , EURGBP, EURCHF, USDCHF, USDCAD on a 1-minute chart( M1 ), spread up to
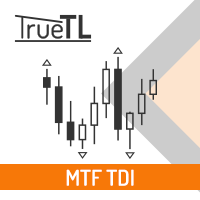
Highly configurable Trader Dynamic Index (TDI) indicator.
Features: Highly customizable alert functions (at levels, crosses, direction changes via email, push, sound, popup) Multi timeframe ability (higher and lower timeframes also) Color customization (at levels, crosses, direction changes) Linear interpolation and histogram mode options Works on strategy tester in multi timeframe mode (at weekend without ticks also) Adjustable Levels Parameters:
TDI Timeframe: You can set the lower/higher ti
FREE

The utility places a grid of pending orders. You can select the number of orders in the grid, the step between orders, multiplier for the order size, SL and TP levels and the magic number. If you use a profit bucket , please note that it applies to all orders on the current currency pair with the current magic. If you want to use several grids with independent profit buckets at the same time, run several copies of the utility and specify different magics in the settings.
MT5 version of the ut
FREE

The indicator displays crossing zero level by Moving Average of Oscillator (OsMA) in the form of arrows. The this is a multi-timeframe indicator, and it displays signals from other timeframes. The indicator notifies about a signal by means of a pop-up Alert window, or sending notification to e-mail.
Parameters Time-frame - select timeframe to show indicator signals. Fast EMA Period - fast EMA. This is an exponential moving average from a price with a short period. Slow EMA Period - slow EMA. Th
FREE

4 trendlines are given by 2 timeframes, defined by the zigzag indicator. It leverages the Zig Zag indicator to identify significant highs and lows across two configurable timeframes (default: M15 for short-term and H1 for medium-term), automatically plotting upward and downward trendlines for each. This helps visualize trend structures, reversals, and alignments between timeframes without switching charts, while adhering to trendline rules that contain the high and low points of the previous two
FREE

Symmetrical Triangle Pattern Indicator - Mastering Trend Recognition in MetaTrader Unlock the power of trend recognition with the "Symmetrical Triangle Pattern" indicator for MetaTrader. This innovative tool simplifies the identification of symmetrical triangle patterns, providing traders with clear signals for potential trend continuation or reversal. Elevate your trading strategies with this MQL offering. Key Features : Accurate Pattern Recognition : The Symmetrical Triangle Pattern Indicator
FREE
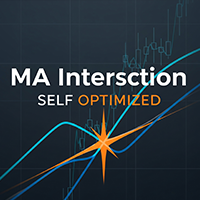
MA交叉指标 (自动优化MA)
该指标会在指定的K线/柱数范围内,自动选择最优的移动平均线(MA)周期。
它会寻找能带来最大收益,或能提供最佳盈亏比的组合。 工作原理: 买入信号: 快速MA自下而上突破慢速MA。
卖出信号: 快速MA自上而下跌破慢速MA。 指标会测试不同的MA周期,选择最优组合并显示在图表上。
在交叉点会显示对应的收益信息。 主要功能: 自动优化MA (按收益或按盈亏比)。
在图表上直接显示所选的移动平均线。
可选记录所有测试过的组合。
在交叉点显示收益文字标记。 参数设置: Period (100–2000根K线): 用于寻找最佳交叉的范围。
Refresh period TF: 重新计算组合的时间间隔。
MA method: 移动平均线的计算方法。
Find better MA method (较慢!): 遍历不同的计算方法以寻找最佳 (运算量×4,可能降低速度)。
MA price: 用于计算MA的价格类型。
The best ratio of wins/losses (true/false): 若为true — 按胜/负比率寻找;若为false — 仅按最大
FREE

Unleashed False Breakout EA strategy trade idea is Support & Resistance key level of price action. Price breakout Support & Resistance than reverse in the zone. Before execute order horizontal line will appear on the key level of Support & Resistance .When there's open order and losses, it will automatically recover the amount of losses on the next execute order as profit. Blue (support) Pink (resistance) Timeframe: M30 H1 Currency:
USDCAD EURUSD XAUUSD *Note on the input take profit in (
FREE

Smart Trade Copier is a high-performance trade copying solution designed for fast, accurate, and reliable synchronization between multiple MT4/5 platforms. It supports both local terminal copying and VPS/cloud-based trade replication, making it suitable for professional traders, prop firms, money managers, and signal providers. The system delivers near-instant execution with advanced filtering, risk control, and flexible lot management, while maintaining stability across different environments.
Multi-Timeframe ATR 指标是 MetaTrader 4 标准 ATR 指标的增强版,它允许交易者在当前图表上查看 任意时间框架 的波动性。与只显示当前图表时间框架 ATR 的普通版本不同,本指标可让您选择其他时间框架,例如在 M15 或 H1 图表上直接展示 日线 ATR 。 运行原理:
本指标从您选定的时间框架(如 H1、H4 或 D1)提取 ATR 值,并以与标准 ATR 相同的方式在独立窗口中绘制。它会自动将较高时间框架的条形对齐当前图表,使您在分析短周期走势时,了解更高周期的波动情况。同时,图表上还会显示一个 以点(pips)为单位 的当前 ATR 值标签,该值根据您的经纪商报价精度(2–6位小数)自动转换并四舍五入。 交易者实用用途: 跨时间框架波动性背景 — 在操作低周期图表时,监控高周期如日线或周线的 ATR,以判断市场何时处于扩张或收缩状态。 仓位规模制定 — 使用以 pips 表示的当前 ATR 值来设置止损或计算仓位规模,使其与市场波动性成比例。 交易时机把握 — ATR 上升时可确认突破或趋势阶段;ATR 下降时可警示合并阶段。 策略过滤器 —
FREE

BreakEven PRO line – Instantly visualize your breakeven point Have you ever wondered exactly where your open trades would reach breakeven — no profit, no loss?
BreakEven PRO line is a visual indicator created for traders managing multiple positions. It automatically displays a horizontal line at the average breakeven price for your open BUY and SELL orders, clearly labeled with the live value on your chart. Perfect for hedging strategies , risk management , or simply maintaining precise control
FREE

此脚本允许您将任何类型的绘图对象(如趋势线、斐波那契回撤等)复制到一个或多个其他图表。
默认情况下,脚本会将当前图表(即应用脚本的图表)上的所有对象复制到当前加载的相同交易品种的任何其他图表。
设置
目的地时间表 当设置为除 PERIOD_CURRENT 以外的任何值时,它会将对象复制到与应用脚本的图表具有相同交易品种的任何打开图表。 如果您将值设置为特定的时间范围,例如 PERIOD_D1,则只会更新具有相同交易品种和周期的图表。 复制对象类型 您可以将其设置为您希望复制的特定类型的对象,然后只有该类型的对象将被复制到其他图表。 复制指标窗口对象 当设置为 True 时,指示器窗口上的对象也将被复制。这依赖于第二张图表具有与源图表相同的指标,并且顺序相同。
在图表之间复制对象让您满意!
FREE

The currency strength momentum has a lot of similarities with currency strength meter presented in the previous page, but the difference are much more pronounced. You can try putting both in the same chart and see the difference in results. Currency strength momentum measures strength of a currency based on (you guess it) it's momentum relative to other currencies, while currency strength meter measures the strength of a currency based on pips it has moved in a certain direction.
FREE

What is Macro Kill Boxer? Macro Kill Boxer is a technical analysis indicator developed for the MetaTrader platform. It visualizes market movements during specific time intervals (e.g., Asia, London Open/Close, New York AM/PM) by drawing colored boxes on the chart. Each box represents the high and low price levels within the defined time period, often associated with macroeconomic events or high-volatility sessions. What Does It Do? Time-Based Analysis : Displays price movements as boxes for 58 c
FREE

MetaTrader 的 Slope Channel 指标
在寻找适合任何交易风格的市场趋势分析工具吗? Slope Channel – 是您识别价格方向运动和关键市场水平的可靠助手! 什么是 Slope Channel? Slope Channel 是一款创新指标,可在图表上构建倾斜通道,基于局部极值自动计算其参数。此工具突出显示最佳通道选项,让您能够快速适应不断变化的市场条件。 独特特点 自动通道角度计算: 指标显示通道的倾斜角度,指示其类型: 收敛(正角度): 表示通道收窄,价格压力增加。 发散(负角度): 表明范围扩大,可能出现不稳定。 数据更新: 每根新K线重新计算通道,确保使用最新数据。 广泛应用 该指标适用于: 剥头皮交易 – 分析短期波动。 日内交易 – 优化日内策略。 中长期交易 – 识别全球趋势。 输入参数说明 Rates: 用于通道计算的K线数量。默认值为 250 ,确保分析精度。 AngleThreshold: 通道倾斜角的阈值,超过该值时通道被视为不稳定。此时通道背景将自动关闭,以避免误信号。 Ch
FREE

Euro Gift (EURUSD M15) I am celebrating my birthday, so i will publish some EAs for FREE. This EA has been developed for EURUSD M15. Strategy is based on ICHIMOKU indicator and has very little parameters - so its VERY ROBUST. It uses Stop pending orders with ATR Stop Loss . At 9:00 pm we are closing trading every Friday to prevent from weekly gaps. !!!Adjust these times to your broker time. Preset values are for UTC+2 only!!! For every candle the pending orders are modified to adapt the mar
FREE
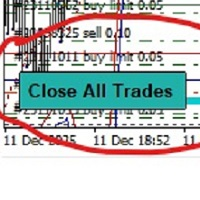
-Product Description- This close_all_entry button can use to close all your active entry with profit or lose . Button can't use to delete all your pending order . Just one click can close all active entry , no need anymore to close one by one . Maybe get some delay to close all your active entry . Just trade with amount you dare to lose . o.o.o.o.o.o.o.o.o.o.o.o.o.o.o
FREE

In the indicator there are EUR, USD, CAD, AUD, NZD,JPY, GBP ,CHF.
The Currency Index Project is Forex study. Many people do not know the theoretical basis that drives currency exchange rates to move on the market. With this set of tools you will be able to have a more complete view of the entire market by analyzing not only the single currency of an exchange, but all the exchange rates that make up that currency by looking at a single window! The study assumes that all forex currencies are lin
FREE
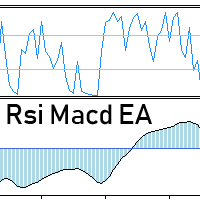
Rsi Macd Expert Advisor uses combined signal from 2 indicators (Rsi / Macd). Minimum trading account 500. best pairs: GBPCAD / EURUSD / CADJPY / USDCHF / GBPUSD / GBPJPY / USDJPY best timeframe: 1H Setting can be define by the user: rsi levels / rsi period / macd period / risk /
there are no stop loss or take profit and the expert closes orders by the indicator signal.
developed, tested and optimized on " VantageMarkets " platform. Recommended broker > Vantage
FREE

此工具将具有指定或自动计算的时间差的原始时间刻度添加到图表底部。
通过使用这个方便的工具,您可以提高图表的可读性,并通过以您或您所在国家/地区熟悉的时间格式显示图表来减轻精神压力。
即使您不需要计算时差,只需将默认时间刻度替换为 Local_Time 即可提高图表的可读性。
Local_Time支持多种时间格式,如“DD.MM hh:mm”、“DD MMM hh:mm”、“MM-DD hh:mm”、“MM/DD hh:mm”、“DD hh:mm”、“ hh:mm”,专为不同国家的人使用而设计。
通过灵活的参数设置,您可以根据需要自定义 Local_Time,从删除默认时间刻度、自动或手动计算时差、调整夏令时、调整刻度之间的间隔。
如果在 Local_Time 下面创建了一个子窗口,会出现一个红色的条,点击它可以将其移动到底部。
产品图片请参考截图。
how to use
https://www.mql5.com/en/blogs/post/752455
FREE

ITS FREE I Recommend www.CoinexxBroker.com as a great broker and the one I personally use Asia session 1:00 to 9:00 (6pm est to 2 am est) Eur means London Session 10:00 to 18:00 (3 am est to 11 am est) USA means New York Session 15:00 to 23:00 (8 am est to 4 pm est) Session indicator highlights the start of each trading session. You can show all sessions or edit the settings to only show the hours you want highlighted (Asia) means Asian Session ,(Eur) means London Session , (USA) means New
FREE

This Expert Advisor analyzes the last candles and determines whether there will be a reversal or a large correction. Also, the readings of some indicators are analyzed (their parameters can be adjusted). Is a free version of Proftrader . Unlike the full version, in the free version of the adviser the initial lot cannot be higher than 0.1, trading pair only EURUSD and also it has fewer configurable parameters. Input parameters
Lots - lot size (at 0, the lot will be calculated from the percentage
FREE

MetaTrader 4 的通用指标顾问,具有广泛的功能,可处理标准指标。 1 个智能交易系统中的策略构建器。 来自标准 MetaTrader 集的大量交易指标。 可以选择 20 个信号中的 1 个和 20 个滤波器中的 5 个。 一百多个参数进行个性化定制以满足您的要求。 对于每个信号,您可以自定义指标参数、选择时间范围并指定信号条。 链接:
MetaTrader 5 终端的 X (MT5 的 X) 注意力 !新的通用交易顾问 Exp The xCustomEA 为了 元交易者 4 , 处理自定义指标 如果您想购买自我优化的自动交易顾问,请参阅我们的 滴答狙击手 !
可以在我们的博客中找到 EA 设置 + 演示 + PDF 的完整手册和说明 设置和输入的描述 即使 在博客中,也有关于如何优化和测试我们的顾问 The X 的信息 一个简短的功能列表:
逆势平均, 对趋势的额外发现, 追踪止损,盈亏平衡点, 关闭总损益, 虚拟止损、止盈和追踪止损, 处理头寸或挂单/限价单的能力, 鞅, 抛物线追踪止损

This indicator is stand alone version from MP Pivot Levels (All in one) containing Woodie Pivots. Woodie’s pivot points are made up of multiple key levels, calculated from past price points, in order to frame trades in a simplistic manner. The key levels include the ‘pivot’ itself, and multiple support and resistance levels (usually up to three each). Traders use these levels as a guide for future price movements when setting up trades.
The pivot : (Previous high + previous low + 2 x previous
FREE

Overview
MAM White MT4 targets major indices and uses trend confirmation (EMA alignment), volatility filters, and adaptive trailing. It avoids martingale and uncontrolled averaging. What it does Trades when EMA alignment and volatility filters agree Disciplined one-sided entries; ATR-aware trailing and optional partial exits Checks broker constraints (stop/freeze levels, margin, volume) before sending/modifying orders Recommended use Timeframe: M15–H1 Symbols: broker’s index symbols/CFDs Setup
FREE

PatternVol EA是根据其对市场的观察创建的,包括样式,烛台分析,烛台数量分析,并且该EA不包含指标。目前,顾问程序是我的非指标策略的小型构造函数,您可以分别禁用和启用每个策略,也可以从多个策略中进行组装。顾问的工作一直持续到今天,添加了新策略,改进了算法。将来,它将成为非指标策略的大型聚合器(构造函数),每个人都可以在其中组装自己的交易策略。
*建议将EA交易用于ECN帐户(5位数字)和带有H1时间范围的EURUSD对。
EA交易使用严格的SL和TP设置。
Test DEMO: https://www.mql5.com/ru/signals/978514
EA交易参数
Slippage - 最大滑点级别
OnOff ... - 启用/禁用策略(1 =启用\ 0 =禁用)
Lot... - 未平仓头寸的数量
TakeProfit ... - 固定利润
StopLoss1 ... - 损失固定
Volume... - 入口蜡烛的体积。
FREE

This scanner is monitoring the entire market for trade opportunities for all symbols and for all time frames. You don't have to look to all the charts, for all symbols and for all time frames. This scanner will alert you on your computer, or on your mobile, when a trade opportunity has been found. You never have to miss a trade opportunity! This indicator is designed to scan all pairs and symbols, for all time frames, to find a cross of the MACD main and signal line. MACD Definition
The

在您的平台上提供新版 MT4 标准指标的目的,是在子窗口里显示多时间帧的相同指标。参看下面例中的图片。 但是它的显示不像简单的多时间帧指标。它是指标在其时间帧的实际显示。 在 FFx 指标里提供了一些选项: 选择显示的时间帧 (M1 至 每月) 定义每个时间帧箱体的宽度 (柱线数量) 提示弹出/声音/邮件/推送 (价格穿越 MA 并/或 两条 MA 交叉) 直接在图表上激活/停用提示 修改所有颜色 ... 当然还有所有标准指标的常用设置 如何设置提示: 在弹出的参数设置 : 选择您希望的提示和模式 (弹出、声音、邮件或推送通知) Then On Chart : 选择铃铛图标 (双击) 然后将其拖拽到任意位置。在下一个报价来临,它将恢复它的原始位置,但用不同颜色信号改变它的状态。红到绿意为它现在已激活 … 绿到红意为它现在未激活。
FREE
Индикатор предназначен для разметки ,фибо уровней и фибо зон.Также есть возможность удаления и редактирования уровней на текущем графике. При установке нескольких индикаторов (FIBO-ZONES)на график,не забывайте менять имя в поле (NAME).В утилите также есть возможность менять цвет зон, толщину линий и стиль линий уровней фибо. При установке индикатора ,зоны выстраиваются автоматически.
FREE
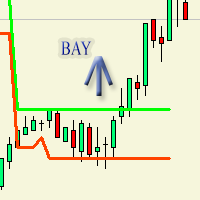
Индикатор изначально предназначался для торгового робота который в дальнейшем опубликуется. Рисует на графике флет. То-есть покой тренда. Очень отчетливо выражает флет по параметрам по умолчанию. flateWigth - допустимая ширина или разница между барами по которому индикатор будет засчитывать флет. Индикатор работает в реальном времени. Для наглядного просмотра работы можно запустить в тестере.
FREE

Expert Advisor Description EA TugOfWar will open both buy and sell positions at different times according to the triggered signal, the most positions and in accordance with the market direction that will win and profit. Profit target per war is 1% to 5%. Warmode normal = Longterm strategy Warmode extreme = Shortterm strategy
Parameter Description StartTrade = Time to start trading / open position EndTrade = Time to end trading / open position WarMode = 1 -> Normal, 2 -> Extreme (lots of tr
FREE

量子擺動 1.什麼是量子擺動? 該指標基於量子數學,以高概率和方向精度顯示未來價格水平。級別顯示為進行交易決策的區域;它們明確定義了具有最小和最大利潤的訂單的窄範圍。該指標顯示不同時期的未來交易區H1,H4,D,W。它還顯示量子振盪而不參考時間。適用於所有交易工具。外匯市場,股票市場,期貨市場和商品市場將改變為MT4交易平台上使用的所有工具。 2.量子擺動的優點和不同之處: 在線汽車打造優質交易平台。 交易決策區域的構建和顯示的準確性。 以未來時態展示貿易區,帶領您領先一步。 易於使用和應用。 聊天電報中頻道的在線支持 https://t.me/nest8 每日評論和直播YouTube頻道 https://www.youtube.com/watch?v=kzapOX0cGfc&feature=youtu.be 2.交易策略。 指標描述,交易策略,調整和交易計劃將在YouTube頻道上詳細顯示,並在聊天電報中進行討論。
FREE
** All Symbols x All Timeframes scan just by pressing scanner button ** *** Contact me to send you instruction and add you in "RSI scanner group" for sharing or seeing experiences with other users.
Introduction RSI divergence is a main technique used to determine trend reversing when it’s time to sell or buy because prices are likely to drop or pick in the charts. The RSI Divergence indicator can help you locate the top and bottom of the market. This indicator finds Regular divergence for pul

KALIFX Position Size Calculator – Risk Management Utility Overview The KALIFX Position Size Calculator is a MetaTrader utility designed to assist traders in managing risk by calculating precise lot sizes based on account balance, selected risk percentage, and stop loss distance.
It operates directly from the chart, allowing users to define entry, stop loss, and take profit levels and instantly view the corresponding lot size and risk amount before placing a trade. Features Interactive chart but
FREE

The indicator finds candlestick patterns based on Gregory L.' Morris "Candlestick Charting Explained: Timeless Techniques for Trading Stocks and Futures". If a pattern is detected, the indicator displays a message at a bar closure. If you trade using the MetaTrader 5 terminal, then you can download the full analogue of the " Candle Pattern Finder for MT5 " indicator It recognizes the following patterns: Bullish/Bearish (possible settings in brackets) : Hammer / Shooting Star (with or without con

Простой советник основанный на сигналах индикатора Relative Strength Index (RSI) в зоне перекупленности - продаем, в перепроданности - покупаем. Моя версия всем известного "Dynamic". Я рекомендую использовать этот советник в полуавтомате.
Добавляйтесь в друзья, присылайте свои интересные стратегии. Возможно после обсуждения всех нюансов напишу советника бесплатно . Параметры: "_Slippage" - Проскальзывание; "_ Ma
FREE

EURUSD H1 Simple Martingale that works on daily swing levels, low DD, TP and SL defined on the basis of certain pre-set calculations in the algorithm, executes one trade at a time, weekly trading no overnight on weekends, possibility to establish customized exit times, possibility of customize money management. average return of 7.92% per year with the factory settings of the V1, it is always constantly updated, it is recommended to use it with a GMT +2 server TESTED SINCE 2003
Happy trading
FREE

"Introducing our revolutionary Trading Expert Advisor Robot, your indispensable ally in the fast-paced world of financial markets. Seamlessly combining cutting-edge technology with unparalleled expertise, our expert advisor robot is designed to revolutionize your trading experience and maximize your profitability.
Harnessing the power of artificial intelligence and machine learning, our expert advisor robot analyzes vast amounts of market data in real-time, identifying profitable opportunities
FREE
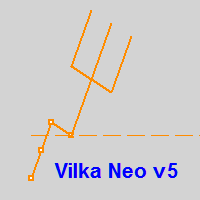
Вилка Нео v5, разрабатывалась для торговой системы "Оракул", но постепенно дополнялась, например - углами Ганна и другими опциями...
Можно создавать графические объекты с заданным цветом, стилем и толщиной, такие как: прямоугольники с заливкой и без, отрезки трендлиний и нестандартный инструмент - "вилка Нео" в виде трезубца, так же есть возможность интерактивно настраивать цветовую палитру прямо с графика, настраивать видимость объектов для разных ТФ, толщину и стили... Панель переключается кла
FREE

Indicator ini berdasarkan Gain ADX - Follow Trend - Disertai Pivot, Support & Resistant Daily
Dengan indicator ini semoga menjadikan indicator yang porofit able, selama mengikuti signal yang tampil, apabila berwarna Hijau siap2 untuk Buy, dan berwarna Merah siap2 untuk Sell.
Akan tampil signal Sell/Buy di saat gain mencukupi, baik TF Kecil maupun TF Besar TF Besar / High TF adalah Trend Kuat TF Kecil / Low TF adalah Trend Lemah
Open Posisi pada High TF, signal akan menunjukkan Sell/Buy.
FREE

The indicator displays crossing zero level by Moving Average of Oscillator (OsMA) in the form of arrows. The indicator notifies about a signal by means of a pop-up Alert window, or sending notification to e-mail.
Parameters Fast EMA Period - fast EMA. This is an exponential moving average from a price with a short period. Slow EMA Period - slow EMA. This is also an exponential moving average of a market price but with a longer period. Signal SMA Period - MACD SMA. This is a signal line which is
FREE

发现更智能、更 versatile 的交易体验:Tabow 3.7 Tabow 3.7 是我们精密构建的智能交易系统 (EA) 的最新演进版本,旨在利用 Awesome 振荡器 (AO) 帮助交易者识别潜在的顶部和底部。此更新版本通过在代码中直接嵌入五种不同的交易策略,显著扩展了您的策略工具包。 Tabow 3.7 不仅仅执行交易;它集成了先进的内部条件和动态交易管理工具,以提供基于规则的、结构化的执行。这些策略分为两类,以实现更细致的方法: SAO_Dev 和 SAO_Norm: 这些策略将 AO 阈值条件与价格行动相结合,并利用 Cval——一个适应四种不同市场条件的多状态变量。 SAO_Valley、SAO_Mount 和 SAO_Perky: 这些策略依赖于 AO 阈值条件与价格行动的结合,提供了一种更直接的方式来捕捉市场走势。 该 EA 旨在提供更大的灵活性,现在支持在受控条件下以单向进行多个同时交易。当出现新的设置时,系统会验证自首次入场以来是否至少过去了五根K线,然后才允许执行另一笔交易。它包含了精心调整的止盈 (TP) 和止损 (SL) 机制,滑点以4位报价经纪
FREE
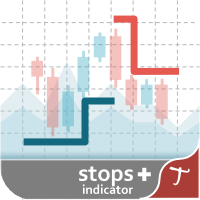
Tipu Stops is a simple indicator that plots buy/sell stop loss channels and pips value using commonly used indicators. Tipu Stops also works complementary to the Tipu Trader Panel. You can use the stop loss values from Tipu Stops in Tipu Trader before using the panel for trading.
How to Use Add the indicator to the chart and select your preferred method of stop loss plot. You may choose from the following methods: Average True Range on PRICE_CLOSE. Average True Range bands on Hull Moving Averag
FREE
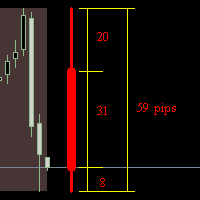
The indicator 'draws' a daily, weekly or monthly candlestick on the current chart. Shows in points the sizes of the upper and lower shadows, the body and the entire candlestick. Real time work. Works in the strategy tester. Indicator parameters: How_much_to_show - how many blocks to show. Block_period - block period (day / week / month) Shift - shift from the edge of the chart in bars. language - language selection.
FREE

Общие сведения Для начала торговли достаточно небольшого депозита. Идеален для быстрого разгона депозита!!! Подходит для мультивалютной торговли. Невосприимчивость к большой задержке и величине спреда.
Принцип работы После запуска советника на графике советник запоминает уровень открытия первого ордера. Выше уровня открытия первого ордера советник выставляет сеть ордеров на Sell . Ниже уровня открытия первого ордера советник выставляет сеть ордеров на Buy . Если общая прибыль ордеров на покуп
FREE
具有多时间框架支持、可自定义视觉信号和可配置警报系统的相对强弱指标(RSI)。
什么是RSI? 相对强弱指标(RSI)是一个动量振荡器,用于测量价格变化的速度和幅度。该指标在0到100之间振荡,比较指定时间段内近期收益与近期损失的幅度。 RSI主要用于识别超买和超卖状况。高读数表示超买状况,而低读数表示超卖状况。交易者还会关注RSI与价格走势之间的背离,这可能预示潜在的趋势反转。 功能: 带箭头和垂直线的视觉信号标记 三个独立的信号缓冲区,具有可配置触发器(方向变化、水平交叉、峰值/谷值、极端区域) 可配置的警报功能(电子邮件、推送、声音、弹出窗口),带时间范围过滤 具有插值方法的多时间框架(MTF)功能 多种绘图和颜色模式(柱状图/线条,简单/基于方向/基于水平的着色) 可调节的超买/超卖水平,带可选中间水平 用于专家顾问(EA)集成的自定义指标调用(iCustom)缓冲区访问 输入参数: 基本设置: RSI参数: 周期(默认:14),应用价格,柱偏移量。 多时间框架: RSI时间框架选择和MTF插值模式。 水平设置: 水平配置: 切换可见性,设置高/低边界,可选中间水平显示。
FREE

This scanner is monitoring the entire market for Ichimoku trade opportunities for all symbols and for all time frames. You don't have to look to all the charts, for all symbols and for all time frames. This scanner will alert you on your computer, or on your mobile, when a trade opportunity has been found. You never have to miss a trade opportunity! This indicator is designed to scan all pairs and symbols, for all selected time frames, to find a Tenkan and Kijun Cross or a breakout of the Ich

All traders should know the trend before making their decision when placing the buy or sell orders. The first step always starts with supply and demand , rising and falling channels , trend lines, engulfing candles etc. All the above contribute to what is called “Price Action” and that is the best and most reliable way in trading and catching the trend and making profits, without stress. The Investment Castle Trend Line Indicator will automatically draw the trend lines on the MT4 for you. An
FREE

Introducing "Forex Mastery Escort EA," a game-changing Expert Advisor (EA) specifically designed for the MQL5 market. This innovative EA combines the power of multiple indicators, including IMA (Intrabar Moving Average), CCI (Commodity Channel Index), and MACD (Moving Average Convergence Divergence), to provide you with unparalleled trading accuracy. Forex Mastery Escort EA leverages a sophisticated algorithm that meticulously analyzes market conditions, taking into account the insights derived
FREE

Simple indicator that shows external ( outside ) bars. In certain cases, external bars can be seen as strong trend bars instead of range bars. This can be observed when a with-trend external bar occurs at a reversal from a strong trend. It will help you notice more easily different patterns like - Inside-outside-inside, Inside- Inside -inside, outside - Inside -outside, etc. Works perfectly with my other free indicators Internal bar and Shadows
Inputs: How many history bars to calculate on loa
FREE
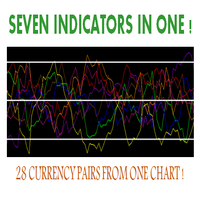
Hello, This indicator is a unique high reliability 7-in-1 multicurrency indicator comprising these sub-indicator’s: A Trend Power Crossover Indicator. A Percent Change Crossover Indicator. A Currency Overbought/Oversold Indicator. A Currency Deviation Indicator. A Currency Impulse Signal Indicator. A Trend Power Indicator. A Currency Volatility Indicator. The main advantage of this indicator is that it's reasoning by currency and not by currency pair. The values of each sub-indicator are calcul
FREE

Before enabling the automatic functions, please note that your EAs must include a small MQL code addition to communicate with the scheduler. I will guide you through the exact steps. If you are using EAs from other developers and you do not have access to their source code, you cannot add this integration. In that case, the scheduler can only be used in manual mode.
Overview
Alpha Trading Scheduler is an MT4 tool that helps control when automated trading is allowed inside one terminal.
It does

DayTradeMaster: A Professional Tool for Daily Trading DayTradeMaster is a powerful Expert Advisor (EA) based on proven trading strategies and indicators to deliver precise buy and sell signals. This EA is the perfect tool for a day trading approach, enabling efficient utilization of market movements and maximizing profits. Key Features: Indicator Synergy: Combines RSI and MA indicators for trend analysis and signal generation. Multiple Candle Patterns: Supports Pin Bar, Morning Star, Engulfing,
FREE
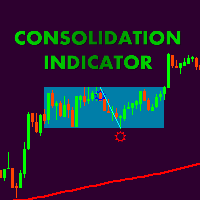
Сonsolidation box indicator with possibility of flexible settings according to the traiders requipments. Also, it is possible to embed indicatior in EA. Thank Alexey Mavrin for realization of technical task. According to the classic technical analysis the price is in motion without a clear direction for almost 70% of the market time and methods of getting profit from flat should be in the arsenal of any trader. Price consolidation- are periods of market equilibrium when supply and demand are app
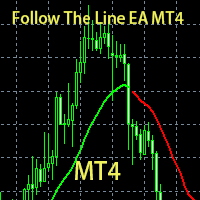
这是基于颜色识别的自定义指标基础上编写的EA。 当颜色为绿色时做多单。 当颜色为红色时做空单。 当前EA内置第三方自定义指标Follow The Line。
参数详解: lotS:EA下单的手数 sL:止损点数 tP:止盈点数 magic:当前EA订单标识,这是区别和其它EA或手工下单的识别号,建议不要改 useMovingTP:开启或关闭 移动止盈功能,默认关闭,安装后建议开启设置成 useMovingTP =false moveSL:移动止损点数 useTimeFrameFilter:开启或关闭时间周期过滤 filterTimeFrame:时间周期过滤,当 useTimeFrameFilter =true时生效。默认4小时,可以根据情况修改。 MAPeriod:EA下单工作周期,建议不要修改
这是调用第三方自定义指标,指标加载到图表上根据线颜色很好标识下单方向,然后再根据指标信号编写出EA,无时间,货币对限制。 当前EA最好在1小时,4小时时间周期上工作,效果较好,虽然然指标是无限制的,但是效果不太好。 本EA工作平台最好选择点差比较小的交
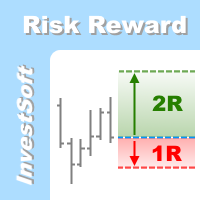
This is the forex visual orders tool & forex position size (lot) calculator with intuitive panel. Risk Reward Ratio Indicator works on all kind of symbols: currency pairs, indices, metals, commodities, cryptocurrencies, etc.
If you want to make sure that Risk Reward Ratio Indicator works on your favorite symbols contact us ( visit our profile ) and ask for 7-day free trial to test this tool without limits. If you want to place orders easier, faster and more intuitive? If you like to mark trad

Indicator (includes Volume Profile + Order Blocks) - a revolutionary indicator that combines two of the most powerful concepts of modern technical analysis: volume profiles and institutional players' order blocks. This tool allows you to see what is hidden from most traders and gives you a significant advantage in the market.
Key benefits of the indicator: Visualization of "smart money": Clearly shows the areas of concentration of large players, highlighting areas with maximum volume in bright

Ultimate No Nonsense FX Backtester - You can Run Forward Test Simulation with this tool! Do Not Download the Demo Here, Please Read Below!
Step by Step Manual Guide PDF for this backtester PDF List of Commands(Shortcuts) for this backtester
Ultimate NNFX Backtester is a powerful utility tool that significantly reduces the length of backtesting process for NNFX followers. As well as for Forex traders that operates their entries and exits at the close of a candle and manage the risk using ATR.
Grid Assistant Pro – Utility for Managing Grid Strategies on MetaTrader 4
Grid Assistant Pro is a professional utility that helps traders manage and monitor unidirectional grid strategies directly from the MT4 chart.
It provides a visual dashboard , clear controls, and automated risk protection features for precise and efficient grid operation.
Key Features
Visual Dashboard
Real-time metrics: Balance, Equity, Floating P/L, Drawdown %, Free Margin Grid status: active and pending or
FREE
MetaTrader市场提供了一个方便,安全的购买MetaTrader平台应用程序的场所。直接从您的程序端免费下载EA交易和指标的试用版在测试策略中进行测试。
在不同模式下测试应用程序来监视性能和为您想要使用MQL5.community支付系统的产品进行付款。
您错过了交易机会:
- 免费交易应用程序
- 8,000+信号可供复制
- 探索金融市场的经济新闻
注册
登录