

Population-Based Optimization Algorithms: Building a Defense Against Cheaters
 159
 0

Table of Contents
Introduction
In the previous article, we found that certain algorithms can receive inflated scores not because of the quality of their search, but because of a chance match between their internal mechanics and the geometry of the test functions. We identified the nature of the phenomenon, formulated diagnostic criteria, and adjusted the Forest and Megacity test functions. This eliminated the possibility of gaining an advantage due to search agents moving "diagonally" in a two-dimensional plane. The article concluded with a plan: to run all the algorithms on the updated test bench and recalculate the rankings.
This article carries out that plan. All 45 algorithms from the ranking table were retested using the adjusted test functions. In addition to the recalculation, a composite test for detecting “cheating” was developed. Instead of optimizing a single function with repeating coordinates, the agent simultaneously optimizes five different functions with different landscapes. An algorithm with an artificial directional bias cannot simultaneously “guess” the optimum on five different surfaces, whereas an honest search mechanism will show very similar results on both the updated test functions and the new multi-function test. Its purpose is to quickly and definitively determine whether an algorithm has actual search capability before running the full test bench. This is a kind of entry filter that weeds out dummy algorithms at an early stage. This is not about revising the methodology, but about eliminating a few exceptions that exploited the specific location of the extrema.
After reading this, the trader will receive an updated ranking table — free of algorithms with artificially inflated results — and a ready-to-use script for independently testing any new algorithm before entrusting it with the optimization of their strategy.
Test Results
Here are the test results for the first 10 algorithms from our old ranking table, as tested on the new test bench.
ANS (72.73%) — clearly ranks first, achieving the maximum possible score of 1.0 on Forest and a nearly perfect score on Hilly on the 5-function test. Consistently high performance across all three functions.
ANS|Across Neighbourhood Search|50.0|100.0|8.0|1.0|0.6|
=============================
Hilly-5; function evaluations: 10000; result: 0.9999999999875436
Hilly-25; function evaluations: 10000; result: 0.8822811736388573
Hilly-500; function evaluations: 10000; result: 0.40137720364864543
=============================
Forest-5; function evaluations: 10000; result: 1.0
Forest-25; function evaluations: 10000; result: 0.9528121725014275
Forest-500; function evaluations: 10000; result: 0.2809183267906096
=============================
Megacity-5; function evaluations: 10000; result: 0.9466666666666669
Megacity-25; function evaluations: 10000; result: 0.8573333333333336
Megacity-500; function evaluations: 10000; result: 0.2238933333333332
=============================
Overall score: 6.54528 (72.73%)
CLA (71.17%) ranks third in the new ranking. High performance on the initial tests for all functions (0.951, 0.993, 0.936), and robust scaling in medium dimensions.
CLA|Code Lock Algorithm|100.0|8.0|0.8|0.03|
=============================
Hilly-5; function evaluations: 10000; result: 0.9513916030211934
Hilly-25; function evaluations: 10000; result: 0.8619898090237819
Hilly-500; function evaluations: 10000; result: 0.37878768991969275
=============================
Forest-5; function evaluations: 10000; result: 0.9934937994742749
Forest-25; function evaluations: 10000; result: 0.9350030299784114
Forest-500; function evaluations: 10000; result: 0.264969743691552
=============================
Megacity-5; function evaluations: 10000; result: 0.9359999999999999
Megacity-25; function evaluations: 10000; result: 0.8426666666666668
Megacity-500; function evaluations: 10000; result: 0.24059999999999984
=============================
Overall score: 6.40490 (71.17%)
AMOm (71.95%) ranks second in the new ranking, with a very steady profile: it shows neither an anomalous spike nor a drop on any function. It performs particularly well in high dimensions — 0.468 on Hilly-500 and 0.364 on Forest-500, among the best scores in the table.
AMOm|Animal Migration Optimization M|50.0|8.0|10.0|
=============================
Hilly-5; function evaluations: 10000; result: 0.9162371105304754
Hilly-25; function evaluations: 10000; result: 0.8360339347175263
Hilly-500; function evaluations: 10000; result: 0.46789660023174695
=============================
Forest-5; function evaluations: 10000; result: 0.9848161468170084
Forest-25; function evaluations: 10000; result: 0.9200997377060082
Forest-500; function evaluations: 10000; result: 0.3639111656785071
=============================
Megacity-5; function evaluations: 10000; result: 0.9173333333333332
Megacity-25; function evaluations: 10000; result: 0.8170666666666667
Megacity-500; function evaluations: 10000; result: 0.2517733333333329
=============================
Overall score: 6.47517 (71.95%)
(P+O)ES (69.63%) — the best result on Hilly-25 among the entire top ten (0.895). A well-balanced algorithm with no weaknesses that handles a variety of tasks effectively.
=============================
Hilly-5; function evaluations: 10000; result: 0.8657144873317885
Hilly-25; function evaluations: 10000; result: 0.8953901738038004
Hilly-500; function evaluations: 10000; result: 0.39739528286050285
=============================
Forest-5; function evaluations: 10000; result: 0.9776075492446766
Forest-25; function evaluations: 10000; result: 0.8981952542170181
Forest-500; function evaluations: 10000; result: 0.2687849185074435
=============================
Megacity-5; function evaluations: 10000; result: 0.9213333333333333
Megacity-25; function evaluations: 10000; result: 0.8024000000000001
Megacity-500; function evaluations: 10000; result: 0.23952000000000004
=============================
Overall score: 6.26634 (69.63%)
CTA (65.14%) — ties for 9th–10th place with ESG in the new ranking. The best result in the top ten on Megacity-5 (0.955), but the sharpest decline as dimensionality increases: from 0.955 to 0.110 on Megacity. The algorithm performs well on small-scale problems, but does not scale well.
CTA|Comet Tail Algorithm|80.0|40.0|4.0|-1.0|0.2|1.0|0.5|0.1|15.0|
=============================
Hilly-5; function evaluations: 10000; result: 0.9243464383277585
Hilly-25; function evaluations: 10000; result: 0.8678611260832623
Hilly-500; function evaluations: 10000; result: 0.2783803821000941
=============================
Forest-5; function evaluations: 10000; result: 0.9903857592716669
Forest-25; function evaluations: 10000; result: 0.8457126196030522
Forest-500; function evaluations: 10000; result: 0.19448478585260007
=============================
Megacity-5; function evaluations: 10000; result: 0.9546666666666669
Megacity-25; function evaluations: 10000; result: 0.6968000000000002
Megacity-500; function evaluations: 10000; result: 0.11008000000000102
=============================
Overall score: 5.86272 (65.14%)
TETA (65.21%) — an almost perfect result on Forest-5 (0.997) and a strong result on Megacity-25 (0.822), but weaker performance in high dimensions: Forest-500 (0.144) and Megacity-500 (0.104) are the lowest among the top ten.
TETA|Time Evolution Travel Algorithm (joo)|50.0|
=============================
5 Hilly's; Func runs: 10000; result: 0.9145203656820382
25 Hilly's; Func runs: 10000; result: 0.8636891042289963
500 Hilly's; Func runs: 10000; result: 0.2557893068727686
=============================
5 Forest's; Func runs: 10000; result: 0.9965389719633986
25 Forest's; Func runs: 10000; result: 0.9129125157050326
500 Forest's; Func runs: 10000; result: 0.14394284935691087
=============================
5 Megacity's; Func runs: 10000; result: 0.8546666666666669
25 Megacity's; Func runs: 10000; result: 0.8221333333333336
500 Megacity's; Func runs: 10000; result: 0.10442666666666756
=============================
All score: 5.86862 (65.21%)
SDSm (68.63%) — strong results in the initial tests of all functions (above 0.92), but a noticeable decline at high dimensions, especially on Forest-500 (0.221) and Megacity-500 (0.214).
SDSm|Stochastic Diffusion Search M|100.0|100.0|0.05|
=============================
5 Hilly's; Func runs: 10000; result: 0.9519471636297065
25 Hilly's; Func runs: 10000; result: 0.8494376697764915
500 Hilly's; Func runs: 10000; result: 0.3624897619727907
=============================
5 Forest's; Func runs: 10000; result: 0.9806113591666786
25 Forest's; Func runs: 10000; result: 0.8845675590592755
500 Forest's; Func runs: 10000; result: 0.2211247219431563
=============================
5 Megacity's; Func runs: 10000; result: 0.9226666666666669
25 Megacity's; Func runs: 10000; result: 0.7901333333333336
500 Megacity's; Func runs: 10000; result: 0.21379999999999993
=============================
All score: 6.17678 (68.63%)
ECBO (62.97%) — an almost perfect result on Forest-5 (0.995) and a strong result on Hilly-5 (0.940), but performance drops at high dimensions: Forest-500 scores only 0.131.
ECBO|Enhanced Colliding Bodies Optimization|50.0|20.0|0.7|
=============================
5 Hilly's; Func runs: 10000; result: 0.9402415265522688
25 Hilly's; Func runs: 10000; result: 0.7236308766253738
500 Hilly's; Func runs: 10000; result: 0.3235591845134633
=============================
5 Forest's; Func runs: 10000; result: 0.9947663805080049
25 Forest's; Func runs: 10000; result: 0.8029133468157632
500 Forest's; Func runs: 10000; result: 0.13055914998929397
=============================
5 Megacity's; Func runs: 10000; result: 0.8760000000000001
25 Megacity's; Func runs: 10000; result: 0.7016000000000002
500 Megacity's; Func runs: 10000; result: 0.17433333333333365
=============================
All score: 5.66760 (62.97%)
BOAm (60.41%) is the only algorithm in the top ten with a Hilly-5 value below 0.8 (0.762), but it is the most stable at medium dimensions: the gap between Hilly-25 (0.724) and Forest-25 (0.820) is minimal. A good result on Forest-500 (0.289) — second in the top ten behind AMOm — but a poor showing on Megacity-500 (0.098) — the lowest in the table.
BOAm|Billiards Optimization Algorithm M|50.0|10.0|
=============================
5 Hilly's; Func runs: 10000; result: 0.7617749675007237
25 Hilly's; Func runs: 10000; result: 0.7242063623901942
500 Hilly's; Func runs: 10000; result: 0.2527483917912686
=============================
5 Forest's; Func runs: 10000; result: 0.9089006604555031
25 Forest's; Func runs: 10000; result: 0.819600230097181
500 Forest's; Func runs: 10000; result: 0.2885341267767846
=============================
5 Megacity's; Func runs: 10000; result: 0.8373333333333333
25 Megacity's; Func runs: 10000; result: 0.7461333333333333
500 Megacity's; Func runs: 10000; result: 0.09762666666666744
=============================
All score: 5.43686 (60.41%)
AAm (66.16%) — stands out with the best result among the top ten on Hilly-500 (0.426) and Megacity-500 (0.287). This algorithm scales better than others at high dimensions, but lags behind the leaders at low dimensions.
AAm|Archery Algorithm M|50.0|0.3|
=============================
5 Hilly's; Func runs: 10000; result: 0.8468452965108316
25 Hilly's; Func runs: 10000; result: 0.7332044456299903
500 Hilly's; Func runs: 10000; result: 0.42589593336440623
=============================
5 Forest's; Func runs: 10000; result: 0.9670855014018752
25 Forest's; Func runs: 10000; result: 0.7783747648133637
500 Forest's; Func runs: 10000; result: 0.27788504722761453
=============================
5 Megacity's; Func runs: 10000; result: 0.8613333333333332
25 Megacity's; Func runs: 10000; result: 0.7770666666666668
500 Megacity's; Func runs: 10000; result: 0.28711999999999954
=============================
All score: 5.95481 (66.16%)
The results of running the algorithms on the updated test bench have been obtained and are ready to be entered into the ranking table. However, before doing that, it makes sense to take one more step, which will be discussed below.
Our research has shown that some optimization algorithms may produce inflated results on certain test functions — not because of the quality of the search, but due to a random coincidence between the algorithm’s internal mechanics and the geometry of the function’s landscape. For example, if the algorithm generates trajectories primarily along the diagonal of the search space, and the global maximum lies on that diagonal, then the optimal solution will be easier to find. This does not reflect the algorithm's actual search capability.
HHO demonstrated a suspiciously high result on the Forest function — over 93% — even though on Hilly of the same dimensionality it showed only about 58%. This discrepancy went beyond the usual range of variation and required a detailed investigation. An analysis of the algorithm’s internal mechanics revealed that the scalar multipliers in the HHO formulas generate predominantly diagonal search trajectories, and that the global maximum of Forest was located right near the diagonal of the space. The algorithm was not so much searching for the optimum as systematically running into it because its direction of movement coincided with the geometry of the landscape. We called this phenomenon “cheating.”
The standard test bench runs each of the three test functions (Hilly, Forest, Megacity) independently, at three dimensionality levels: 10, 50, and 1,000 coordinates of the same function. In this case, all of the agent's coordinate pairs optimize the same surface. An algorithm with a systematic bias in a certain direction can exploit this uniformity.
A composite test was developed to identify such behavior at an early stage. The principle is simple: instead of 10 coordinates from a single function (5 pairs), we use 5 different functions — Hilly, Forest, Megacity, Peaks, and Skin. Each function is assigned a single pair of coordinates. Each pair lives in its own landscape and has its own permissible range: Hilly is optimized in [-3, 3], Forest in [-42.5, -37] × [-45, -39.8], Megacity in [-10, -2] × [-10.5, 10], and so on. An agent's final fitness is calculated as the average of the Core() values across all five functions.
A key property of the test is that the algorithm cannot “cheat” on it in the same way it can cheat on a single function. Any cheating technique — for example, one that works for Forest — is useless for Hilly or Megacity, with their completely different geometries and different coordinate ranges. To achieve a high score on the composite test, the algorithm must genuinely be able to find the optimum independently in each of the five different landscapes.
Interpreting the results is simple. If the algorithm is “honest,” its result on the composite test will roughly correspond, with only a small deviation, to the average result of the standard test bench's first test (with 5 functions) on the same functions. However, if the algorithm inflates its result on any single function due to a geometric match, this advantage will disappear on the composite test, and the difference between the standard and composite tests will be significant. The greater this discrepancy, the more the algorithm exploits the characteristics of a specific function instead of performing a real search.
Composite Test
The Test_AO_AntiCheat script is designed to be as simple as possible and does not require visualization — only outputting the results to the log.
At startup, the optimization algorithm is selected from a drop-down list via the AOexactly_P parameter, allowing you to quickly switch between any algorithms without recompiling. The two remaining parameters specify the number of function evaluations (NumbTestFuncRuns_P) and the number of repeated runs (NumberRepetTest_P).
At the start, the script creates five test function objects: Hilly, Forest, Megacity, Peaks, and Skin. Next, the rangeMin and rangeMax arrays are created, each 10 elements long (5 coordinate pairs). Each pair receives its search bounds from its function: elements 0–1 are filled with the Hilly domain, elements 2–3 with the Forest domain, and so on. The rangeStep array is filled with zeros because argument discretization is not used.
The number of epochs is calculated in the standard way: the total number of function evaluations is divided by the population size. Next, the main loop of repeated runs begins. In each run, the algorithm is reinitialized, and the inner loop over epochs executes the standard sequence: calling Moving(), calculating fitness, and calling Revision().
The fitness calculation is the only difference from the standard script. Instead of calling f.CalcFunc(ao.a[set].c), which passes all coordinates to a single function, a loop over the five functions is executed for each agent. Each function receives its own coordinate pair via a direct call to Core(x, y); the results are summed and divided by five. Since all functions return normalized values in the range [0, 1], the final fitness also lies in [0, 1].
After each run, the achieved result ao.fB is logged. Once all runs are complete, the average value and its percentage representation are displayed. This percentage is an indicator. It is enough to compare it with the average value of the first test on the standard test bench to assess the algorithm's "honesty."
//+------------------------------------------------------------------+
void OnStart()
 {
  C_AO *AO = SelectAO(AOexactly_P);

  if(AO == NULL)
   {
    Print("AO is not selected...");
    return;
   }

  Print(AO.GetName(), "|", AO.GetDesc(), "|", AO.GetParams());

//--- create 5 functions
#define NFUNCS 5
  C_Function *funcs [NFUNCS];
  funcs [0] = new C_Hilly();
  funcs [1] = new C_Forest();
  funcs [2] = new C_Megacity();
  funcs [3] = new C_Peaks();
  funcs [4] = new C_Skin();

//--- 10 coordinates: pair 0-1 = Hilly, 2-3 = Forest, 4-5 = Megacity,
//                   6-7 = Peaks, 8-9 = Skin
  int params = NFUNCS * 2;

  double rangeMin  [];
  double rangeMax  [];
  double rangeStep [];
  ArrayResize(rangeMin,  params);
  ArrayResize(rangeMax,  params);
  ArrayResize(rangeStep, params);

  for(int i = 0; i < NFUNCS; i++)
   {
    rangeMin  [i * 2]     = funcs [i].GetMinRangeX();
    rangeMax  [i * 2]     = funcs [i].GetMaxRangeX();
    rangeStep [i * 2]     = 0.0;

    rangeMin  [i * 2 + 1] = funcs [i].GetMinRangeY();
    rangeMax  [i * 2 + 1] = funcs [i].GetMaxRangeY();
    rangeStep [i * 2 + 1] = 0.0;
   }

//--- run tests
  int    epochCount = NumbTestFuncRuns_P / (int)AO.params [0].val;
  double aveResult  = 0.0;

  Print("=============================");
  Print("Composite test: Hilly + Forest + Megacity + Peaks + Skin");
  Print("Coordinates: ", params, "; Epochs: ", epochCount,
        "; Repeats: ", NumberRepetTest_P);
  Print("=============================");

  for(int test = 0; test < NumberRepetTest_P; test++)
   {
    if(!AO.Init(rangeMin, rangeMax, rangeStep, epochCount))
      break;

    for(int epochCNT = 1; epochCNT <= epochCount && !IsStopped(); epochCNT++)
     {
      AO.Moving();

      //--- calculate fitness for each agent
      for(int set = 0; set < ArraySize(AO.a); set++)
       {
        double sum = 0.0;
        for(int i = 0; i < NFUNCS; i++)
         {
          sum += funcs [i].Core(AO.a [set].c [i * 2],
                                AO.a [set].c [i * 2 + 1]);
         }
        AO.a [set].f = sum / NFUNCS;
       }

      AO.Revision();
     }

    Print("Run ", test + 1, "/", NumberRepetTest_P, ": ", AO.fB);
    aveResult += AO.fB;
   }

  aveResult /= (double)NumberRepetTest_P;

  Print("=============================");
  Print("Average result: ", DoubleToString(aveResult, 10),
        " (", DoubleToString(aveResult * 100.0, 2), "%)");
  Print("=============================");

//--- release
  for(int i = 0; i < NFUNCS; i++)
    delete funcs [i];
  delete AO;
 }
//+------------------------------------------------------------------+
Now we can move on to printing the results. The results are very revealing and clearly demonstrate how the test works.
DOAm (53.68%) and HHO (53.18%) showed virtually identical results on the composite test. However, on the standard test bench, their overall scores differed noticeably: DOAm — 73.63%, HHO — 68.32%. The behavior on Forest is particularly striking: both algorithms showed abnormally high results on this function (DOAm — 94.1%, HHO — 92.9% on the first 5-function test), significantly exceeding their results on Hilly. The composite test “cut off” this advantage: when Forest is placed alongside four other functions with completely different domains and landscapes, it is no longer possible to exploit the geometry of one specific function. A drop from ~73% and ~68% to ~53% is a significant discrepancy, indicating that part of the result on the standard test bench was “undeserved.”
DOAm|Dingo Optimization Algorithm M|50.0|0.5|0.7|
=============================
Composite test: Hilly + Forest + Megacity + Peaks + Skin
Coordinates: 10; Epochs: 200; Repeats: 10
=============================
Run 1/10: 0.4239956151778058
Run 2/10: 0.6031577198849927
Run 3/10: 0.472651762215779
Run 4/10: 0.44242763860374995
Run 5/10: 0.393561526388916
Run 6/10: 0.58159034825664
Run 7/10: 0.58159034825664
Run 8/10: 0.6044791403615191
Run 9/10: 0.6682691450306482
Run 10/10: 0.5960407868510031
=============================
Average result: 0.5367764031 (53.68%)
=============================
HHO|Harris Hawks Optimization|50.0|1.5|
=============================
Composite test: Hilly + Forest + Megacity + Peaks + Skin
Coordinates: 10; Epochs: 200; Repeats: 10
=============================
Run 1/10: 0.5647280120475809
Run 2/10: 0.5866885383601005
Run 3/10: 0.510840192697806
Run 4/10: 0.510840192697806
Run 5/10: 0.5801540782975321
Run 6/10: 0.5801540782975321
Run 7/10: 0.6101617039102479
Run 8/10: 0.4505520166668432
Run 9/10: 0.4505520166668432
Run 10/10: 0.4732281103689847
=============================
Average result: 0.5317898940 (53.18%)
=============================
ANS|Across Neighbourhood Search|50.0|100.0|8.0|1.0|0.6|
=============================
Composite test: Hilly + Forest + Megacity + Peaks + Skin
Coordinates: 10; Epochs: 200; Repeats: 10
=============================
Run 1/10: 0.9866666666663436
Run 2/10: 0.9866666666666667
Run 3/10: 0.9999999999999998
Run 4/10: 0.9994983755015288
Run 5/10: 0.9069704495992525
Run 6/10: 0.9861650421661512
Run 7/10: 0.98612941584339
Run 8/10: 0.9999999999999993
Run 9/10: 0.9866666666666623
Run 10/10: 0.999498375502054
=============================
Average result: 0.9838261659 (98.38%)
=============================
CLA (96.70%) confirmed a similar pattern: consistently high results across all runs, with virtually all above 98% (except for two outliers around 90%, which is normal for a stochastic process). This is also an “honest” algorithm.
CLA|Code Lock Algorithm (joo)|100.0|8.0|0.8|0.03|
=============================
Composite test: Hilly + Forest + Megacity + Peaks + Skin
Coordinates: 10; Epochs: 100; Repeats: 10
=============================
Run 1/10: 0.9814189578704682
Run 2/10: 0.9839805249712157
Run 3/10: 0.9847263113568381
Run 4/10: 0.9849091877632024
Run 5/10: 0.9064307824513899
Run 6/10: 0.9848008598052127
Run 7/10: 0.8930626122526194
Run 8/10: 0.9856223196479059
Run 9/10: 0.9795896538911133
Run 10/10: 0.9854045893497755
=============================
Average result: 0.9669945799 (96.70%)
Conclusion: the test clearly divided the algorithms into two groups. ANS and CLA demonstrated that their search mechanism works universally. DOAm and HHO lost about 20 percentage points — this is the portion of their standard score that was attributable to “luck” with the geometry of individual functions, rather than to actual search ability.
Therefore, DOAm and HHO will not be included in our ranking table, as including such algorithms in the ranking would distort the overall picture and mislead readers regarding their actual effectiveness.
After the test functions were updated (the Megacity maximum and the Forest adjustment), the ranking table was completely recalculated. A comparison of the old and new results showed that most algorithms maintained their positions, with only minor deviations. Several algorithms improved their scores by 4–6 points: SSG (+5.8), AMOm (+5.4), SDSm (+5.2), (PO)ES (+5.0), and SIA (+4.7). Some showed a slight decrease: BOAm (−1.8), BSA backtracking (−1.9), CSO (−1.6). A number of algorithms — CTA, ECBO, DOA, and FBA — changed by less than 1 percentage point. Overall, the discrepancies were within expectations: changes in the geometry of the test functions naturally redistribute the results; the new landscape suits some algorithms slightly better, while others perform slightly worse.
However, one algorithm raised questions: HS (Harmony Search). Its overall score rose from 52.79% to 60.60%, an increase of 7.8 percentage points — significantly more than the others. Moreover, all of the improvement came from a single function: the score on the first Megacity test rose from 0.620 to 0.917, and the total Megacity score rose from 1.097 to 1.698. On the Hilly and Forest functions, the HS results remained virtually unchanged. Such a sharp jump on one specific function required verification: did HS truly become better at searching, or did its mechanics just happen to align with the new Megacity geometry?
To answer this question, we ran HS through a composite test. HS is clean. 92.45% is roughly at the level of ANS (98.38%) and CLA (96.70%) on the same composite test.
HS|Harmony Search|50.0|0.9|0.1|0.1|
=============================
Composite test: Hilly + Forest + Megacity + Peaks + Skin
Coordinates: 10; Epochs: 200; Repeats: 10
=============================
Run 1/10: 0.8521718129502356
Run 2/10: 0.8521718129502356
Run 3/10: 0.9800589497283483
Run 4/10: 0.9800589497283483
Run 5/10: 0.9949839619589923
Run 6/10: 0.9949839619589923
Run 7/10: 0.9949839619589923
Run 8/10: 0.8064827441874302
Run 9/10: 0.8064827441874302
Run 10/10: 0.9828288881157536
=============================
Average result: 0.9245207788 (92.45%)
=============================
By comparison, the algorithms found to be “cheating” (DOAm and HHO) scored only 53.68% and 53.18%, respectively, on the same test. The difference is clear: HS is truly capable of finding the optimum across different landscapes simultaneously.
Our ranking table is now complete and looks like this:
| cc | AO | Description | Hilly | Hilly Final | Forest | Forest Final | Megacity (discrete) | Megacity Final | Final Result | % of MAX | ||||||
| 10 p (5 F) | 50 p (25 F) | 1000 p (500 F) | 10 p (5 F) | 50 p (25 F) | 1000 p (500 F) | 10 p (5 F) | 50 p (25 F) | 1000 p (500 F) | ||||||||
| 1 | ANS | across neighbourhood search | 1.00000 | 0.88228 | 0.40138 | 2.28366 | 1.00000 | 0.95281 | 0.28092 | 2.23373 | 0.94667 | 0.85733 | 0.22389 | 2.02789 | 6.545 | 72.72 |
| 2 | AMOm | animal migration optimization M | 0.91624 | 0.83603 | 0.46790 | 2.22017 | 0.98482 | 0.92010 | 0.36391 | 2.26883 | 0.91733 | 0.81707 | 0.25177 | 1.98617 | 6.475 | 71.94 |
| 3 | CLA | code lock algorithm (Joo) | 0.95139 | 0.86199 | 0.37879 | 2.19217 | 0.99349 | 0.93500 | 0.26497 | 2.19346 | 0.93600 | 0.84267 | 0.24060 | 2.01927 | 6.405 | 71.17 |
| 4 | (P+O)ES | (P+O) evolution strategies | 0.86571 | 0.89539 | 0.39740 | 2.15850 | 0.97761 | 0.89820 | 0.26878 | 2.14459 | 0.92133 | 0.80240 | 0.23952 | 1.96325 | 6.266 | 69.62 |
| 5 | SDSm | stochastic diffusion search M | 0.95195 | 0.84944 | 0.36249 | 2.16388 | 0.98061 | 0.88457 | 0.22112 | 2.08630 | 0.92267 | 0.79013 | 0.21380 | 1.92660 | 6.177 | 68.63 |
| 6 | AAm | archery algorithm M | 0.84685 | 0.73320 | 0.42590 | 2.00595 | 0.96709 | 0.77837 | 0.27789 | 2.02335 | 0.86133 | 0.77707 | 0.28712 | 1.92552 | 5.955 | 66.17 |
| 7 | SIA | simulated isotropic annealing (joo) | 0.93543 | 0.86504 | 0.38483 | 2.18530 | 0.94069 | 0.80609 | 0.23835 | 1.98513 | 0.86400 | 0.66160 | 0.19536 | 1.72096 | 5.891 | 65.46 |
| 8 | TETA | time evolution travel algorithm (joo) | 0.91452 | 0.86369 | 0.25579 | 2.03400 | 0.99654 | 0.91291 | 0.14394 | 2.05339 | 0.85467 | 0.82213 | 0.10443 | 1.78123 | 5.869 | 65.21 |
| 9 | ESG | evolution of social groups (joo) | 0.98111 | 0.79857 | 0.31167 | 2.09135 | 0.98954 | 0.82270 | 0.15032 | 1.96256 | 0.92133 | 0.73440 | 0.15315 | 1.80888 | 5.863 | 65.14 |
| 10 | CTA | comet tail algorithm (joo) | 0.92435 | 0.86786 | 0.27838 | 2.07059 | 0.99039 | 0.84571 | 0.19448 | 2.03058 | 0.95467 | 0.69680 | 0.11008 | 1.76155 | 5.863 | 65.14 |
| 11 | ECBO | enhanced colliding bodies optimization | 0.94024 | 0.72363 | 0.32356 | 1.98743 | 0.99477 | 0.80291 | 0.13056 | 1.92824 | 0.87600 | 0.70160 | 0.17433 | 1.75193 | 5.668 | 62.98 |
| 12 | DA | dialectical algorithm | 0.93117 | 0.75400 | 0.26205 | 1.94722 | 0.98925 | 0.81375 | 0.08662 | 1.88962 | 0.92667 | 0.68107 | 0.11315 | 1.72089 | 5.558 | 61.76 |
| 13 | BBO | biogeography-based optimization | 0.95876 | 0.70609 | 0.35752 | 2.02237 | 0.92981 | 0.70660 | 0.16970 | 1.80611 | 0.87467 | 0.63013 | 0.20813 | 1.71293 | 5.541 | 61.57 |
| 14 | BHAm | black hole algorithm M | 0.79558 | 0.76207 | 0.34682 | 1.90447 | 0.99836 | 0.75798 | 0.13826 | 1.89460 | 0.85067 | 0.64427 | 0.17020 | 1.66514 | 5.464 | 60.71 |
| 15 | HS | harmony search | 0.91420 | 0.69049 | 0.29924 | 1.90393 | 0.97627 | 0.73373 | 0.14193 | 1.85193 | 0.91733 | 0.62720 | 0.15364 | 1.69817 | 5.454 | 60.60 |
| 16 | RFO | royal flush optimization (JOO) | 0.80989 | 0.74481 | 0.34546 | 1.90016 | 0.95251 | 0.77926 | 0.15185 | 1.88362 | 0.80400 | 0.66427 | 0.19071 | 1.65898 | 5.443 | 60.48 |
| 17 | BOAm | billiards optimization algorithm M | 0.76177 | 0.72421 | 0.25275 | 1.73873 | 0.90890 | 0.81960 | 0.28853 | 2.01703 | 0.83733 | 0.74613 | 0.09763 | 1.68109 | 5.437 | 60.41 |
| 18 | ASO | anarchy society optimization | 0.73070 | 0.73713 | 0.31195 | 1.77978 | 0.99732 | 0.87700 | 0.17619 | 2.05051 | 0.72000 | 0.68773 | 0.18988 | 1.59761 | 5.428 | 60.31 |
| 19 | EOm | extremal optimization_M | 0.76527 | 0.75205 | 0.31908 | 1.83640 | 0.99999 | 0.76426 | 0.12437 | 1.88862 | 0.84133 | 0.64133 | 0.15247 | 1.63513 | 5.360 | 59.56 |
| 20 | ACS | artificial cooperative search | 0.75545 | 0.77162 | 0.31653 | 1.84360 | 1.00000 | 0.80488 | 0.10705 | 1.91193 | 0.76933 | 0.60800 | 0.14157 | 1.51890 | 5.274 | 58.60 |
| 21 | SSG | saplings sowing and growing | 0.75436 | 0.63206 | 0.35935 | 1.74577 | 0.91907 | 0.69694 | 0.19755 | 1.81356 | 0.81867 | 0.60533 | 0.21347 | 1.63747 | 5.197 | 57.74 |
| 22 | AOSm | atomic orbital search M | 0.76184 | 0.68435 | 0.31344 | 1.75963 | 0.90015 | 0.80044 | 0.11501 | 1.81560 | 0.82800 | 0.63280 | 0.15696 | 1.61776 | 5.193 | 57.70 |
| 23 | TSEA | turtle shell evolution algorithm (JOO) | 0.95809 | 0.64852 | 0.29571 | 1.90232 | 0.99522 | 0.58104 | 0.10542 | 1.68168 | 0.92133 | 0.52160 | 0.14567 | 1.58860 | 5.173 | 57.48 |
| 24 | DE | differential evolution | 0.96398 | 0.62346 | 0.26089 | 1.84833 | 0.98482 | 0.77018 | 0.11459 | 1.86959 | 0.93067 | 0.36213 | 0.11000 | 1.40280 | 5.121 | 56.90 |
| 25 | BIO | blood inheritance optimization (joo) | 0.72580 | 0.66522 | 0.31228 | 1.70330 | 0.99995 | 0.68125 | 0.11540 | 1.79660 | 0.85467 | 0.59333 | 0.15364 | 1.60164 | 5.102 | 56.69 |
| 26 | (PO)ES | (PO) evolution strategies | 0.73972 | 0.58190 | 0.38896 | 1.71058 | 0.91199 | 0.59975 | 0.21262 | 1.72436 | 0.82400 | 0.56240 | 0.23432 | 1.62072 | 5.056 | 56.18 |
| 27 | BO | bonobo optimizer | 0.75555 | 0.64366 | 0.32657 | 1.72578 | 0.94332 | 0.70442 | 0.13999 | 1.78773 | 0.73467 | 0.61440 | 0.16728 | 1.51635 | 5.030 | 55.89 |
| 28 | SRA | successful restaurateur algorithm (joo) | 0.89010 | 0.63359 | 0.29115 | 1.81484 | 0.96634 | 0.55285 | 0.08914 | 1.60833 | 0.89333 | 0.52800 | 0.13911 | 1.56044 | 4.984 | 55.38 |
| 29 | CRO | chemical reaction optimisation | 0.91281 | 0.65681 | 0.29866 | 1.86828 | 0.90513 | 0.56020 | 0.10939 | 1.57472 | 0.82800 | 0.50133 | 0.14149 | 1.47082 | 4.914 | 54.60 |
| 30 | BCOm | bacterial chemotaxis optimization M | 0.82589 | 0.61733 | 0.31584 | 1.75906 | 0.95296 | 0.63718 | 0.11984 | 1.70998 | 0.76533 | 0.51653 | 0.15800 | 1.43986 | 4.909 | 54.54 |
| 31 | DOA | dream optimization algorithm | 0.78522 | 0.78121 | 0.36036 | 1.92679 | 0.61584 | 0.42117 | 0.12254 | 1.15955 | 0.86667 | 0.72587 | 0.21127 | 1.80381 | 4.890 | 54.33 |
| 32 | ABO | african buffalo optimization | 0.92295 | 0.62528 | 0.29885 | 1.84708 | 0.92992 | 0.57468 | 0.09372 | 1.59832 | 0.73333 | 0.51333 | 0.14324 | 1.38990 | 4.835 | 53.72 |
| 33 | BSA | bird swarm algorithm | 0.94432 | 0.67941 | 0.26401 | 1.88774 | 0.91649 | 0.65619 | 0.12054 | 1.69322 | 0.80933 | 0.33547 | 0.10652 | 1.25132 | 4.832 | 53.69 |
| 34 | TSm | tabu search M | 0.87806 | 0.61040 | 0.28993 | 1.77839 | 0.98116 | 0.52165 | 0.08544 | 1.58825 | 0.82667 | 0.49547 | 0.13552 | 1.45766 | 4.824 | 53.60 |
| 35 | BSA | backtracking search algorithm | 0.87128 | 0.53190 | 0.28675 | 1.68993 | 0.92408 | 0.51602 | 0.09153 | 1.53163 | 0.96000 | 0.47253 | 0.13760 | 1.57013 | 4.792 | 53.24 |
| 36 | WOAm | whale optimization algorithm M | 0.93893 | 0.59477 | 0.26695 | 1.80065 | 0.98036 | 0.53873 | 0.07112 | 1.59021 | 0.78667 | 0.47600 | 0.11892 | 1.38159 | 4.772 | 53.02 |
| 37 | CSO | competitive swarm optimizer | 0.85151 | 0.60786 | 0.29896 | 1.75833 | 0.84085 | 0.58491 | 0.11974 | 1.54550 | 0.80000 | 0.48560 | 0.14184 | 1.42744 | 4.731 | 52.57 |
| 38 | FBA | fractal-based algorithm | 0.69419 | 0.64267 | 0.28955 | 1.62641 | 0.99812 | 0.54905 | 0.08705 | 1.63422 | 0.76133 | 0.51253 | 0.13689 | 1.41075 | 4.671 | 51.90 |
| 39 | ECOi | eco-inspired evolutionary algorithm | 0.78817 | 0.54402 | 0.29360 | 1.62579 | 0.88996 | 0.46592 | 0.09747 | 1.45335 | 0.78533 | 0.45173 | 0.14295 | 1.38001 | 4.459 | 49.54 |
| 40 | BSO | brain storm optimization | 0.92207 | 0.57625 | 0.29732 | 1.79564 | 0.80764 | 0.42508 | 0.09448 | 1.32720 | 0.77200 | 0.36533 | 0.13065 | 1.26798 | 4.391 | 48.79 |
| 41 | CAm | camel algorithm M | 0.71534 | 0.56917 | 0.35985 | 1.64436 | 0.84094 | 0.47174 | 0.10850 | 1.42118 | 0.70400 | 0.41947 | 0.19563 | 1.31910 | 4.385 | 48.72 |
| 42 | ACOm | ant colony optimization_M | 0.71885 | 0.48410 | 0.30990 | 1.51285 | 0.75792 | 0.48639 | 0.11871 | 1.36302 | 0.83600 | 0.48667 | 0.16148 | 1.48415 | 4.360 | 48.44 |
| 43 | BSO | brain storm optimization | 0.91331 | 0.55813 | 0.29705 | 1.76849 | 0.85329 | 0.44038 | 0.09447 | 1.38814 | 0.72267 | 0.32880 | 0.13325 | 1.18472 | 4.341 | 48.23 |
| 44 | AEFA | artificial electric field algorithm | 0.88798 | 0.65769 | 0.25276 | 1.79843 | 0.95550 | 0.63602 | 0.03946 | 1.63098 | 0.60800 | 0.16000 | 0.09845 | 0.86645 | 4.296 | 47.73 |
| 45 | SOA | simple optimization algorithm | 0.91664 | 0.47040 | 0.27095 | 1.65799 | 0.88264 | 0.31546 | 0.06044 | 1.25854 | 0.82933 | 0.31733 | 0.11579 | 1.26245 | 4.179 | 46.43 |
| RW | random walk | 0.49970 | 0.32333 | 0.25791 | 1.08094 | 0.30754 | 0.11470 | 0.04400 | 0.46624 | 0.36133 | 0.17013 | 0.10244 | 0.63390 | 2.181 | 24.23 | |
Conclusions
In this article, we have completed the work we began in the previous article: we moved from diagnosing the problem to fully resolving it. Key findings:
- All 45 algorithms were tested on the updated test functions, with the ranking table recalculated. The vast majority of algorithms produced results close to their previous ones: deviations ranged from fractions of a percent to 5–6 percentage points, which falls within the natural scatter caused by changes in the landscape. This confirmed the reliability of the test bench as a tool: its methodology works correctly, and the identified problem concerned only a few outlier algorithms.
- The HHO and DOAm algorithms were identified as “cheaters” and removed from the ranking table. The composite test showed a score of about 53% for them — a level not comparable to their previous scores on the standard test bench (68% and 73%). By comparison, the algorithms at the top of the table — ANS, CLA, and HS — achieved scores of 96–99% on the same composite test, confirming the universality of their search mechanism.
- A script for a composite test of resistance to geometric bias has been developed. Five different functions (Hilly, Forest, Megacity, Peaks, Skin), each with different domains and landscapes, are combined into a single problem with 10 coordinates. A single run of this script takes a few seconds and provides a definitive answer: if the result is significantly lower than the average for the first test on the standard test bench, the algorithm is exploiting the geometry rather than searching. It is recommended to use this script as an initial filter before a full run on the test bench.
For a practicing trader, all of this is of direct importance. Optimization algorithms are widely used in trading — to tune the parameters of trading strategies, configure indicators, and optimize portfolios. If an algorithm overstates its results on test problems due to an accidental match with their geometry, then on real-world problems it will produce parameters that are far from optimal and create a false impression of optimization quality. Our toolkit for detecting "cheating" helps weed out such algorithms as early as the selection stage and use only those that truly have a high-quality search mechanism.
Practical advice for traders: before using a new optimization algorithm to select parameters for a trading strategy, run it through a composite test. If the result of the composite test differs significantly from the results of the standard test bench, do not trust that algorithm: it will fail to handle a real-world task just as it fails the composite test. All the tools described — the composite test script, the updated test functions, and the 3D visualization panel — are included with the article and are ready to use.
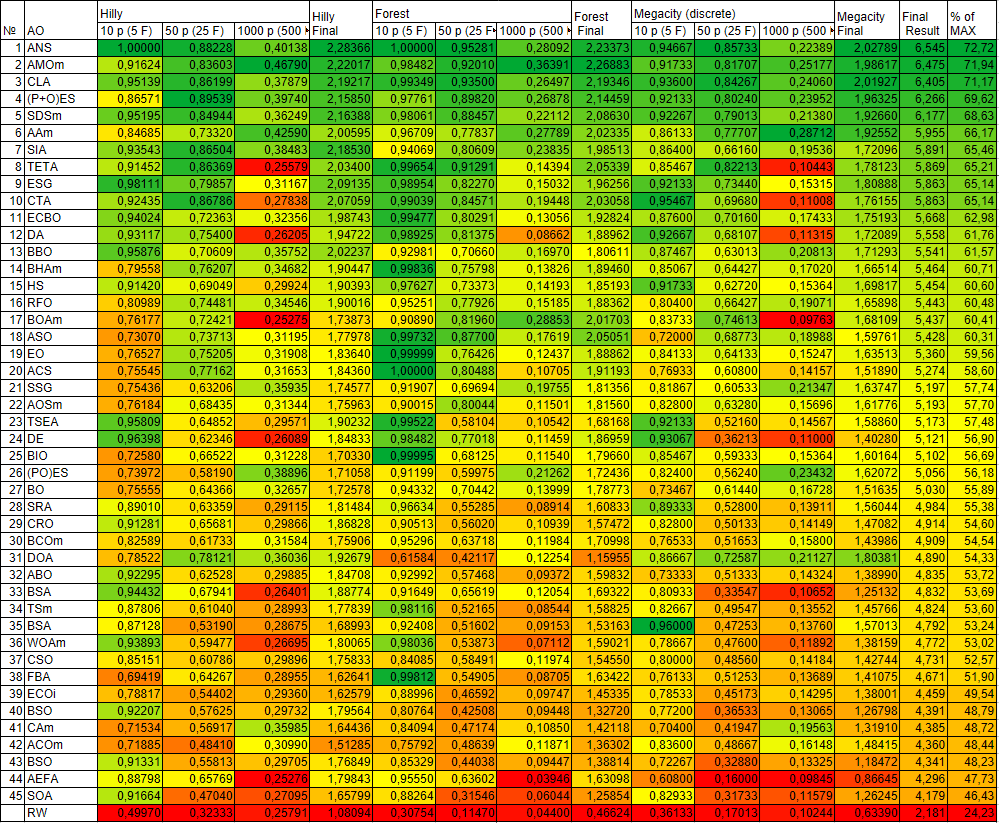
Figure 1. Color gradation of algorithms by the corresponding tests
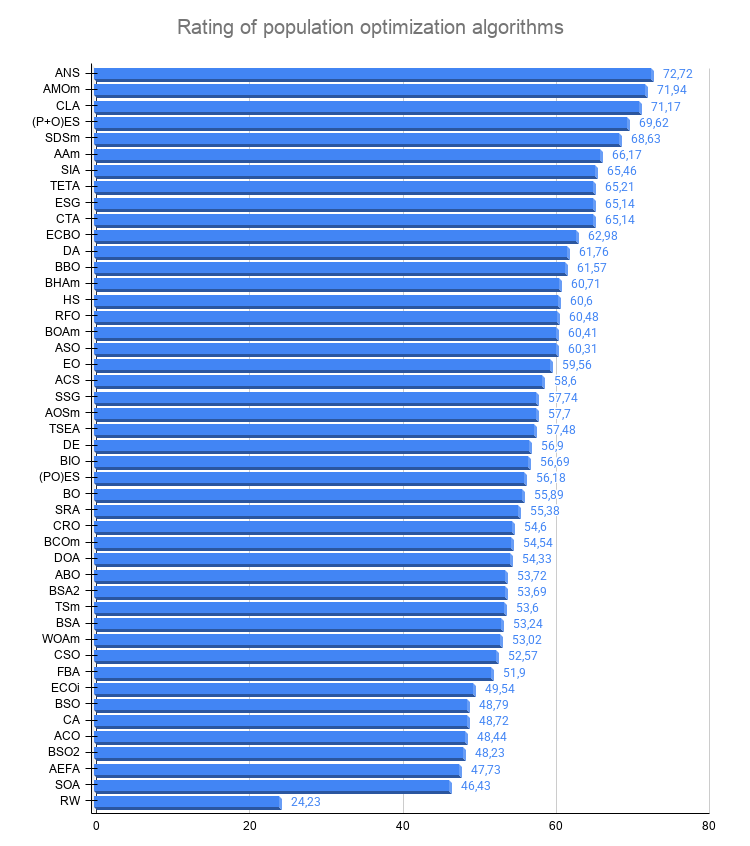
Figure 2. Histogram of results (0–100; higher is better; 100 is the theoretical maximum). The archive contains a script for calculating the ranking table.
An archive containing the latest versions of the algorithm code is attached to the article. The author does not claim absolute accuracy in the descriptions of the canonical algorithms; many of them have been modified to improve their search capabilities. The conclusions and judgments presented in the articles are based on the results of the experiments conducted.
Programs used in the article
| # | Name | Type | Description |
|---|---|---|---|
| 1 | #C_AO.mqh | Include file | Parent class of population-based optimization algorithms |
| 2 | #C_AO_enum.mqh | Include file | Enumeration of population-based optimization algorithms |
| 3 | TestFunctions.mqh | Include file | Test function library |
| 4 | TestStandFunctions.mqh | Include file | Library of test bench functions |
| 5 | TestStand3D.mqh | Include file | 3D visualization panel for the test bench |
| 6 | Utilities.mqh | Include file | Library of utility functions |
| 7 | Test_AO_All.mq5 | Script | Unified test bench for all population-based optimization algorithms |
| 8 | Verify_Extremes.mq5 | Script | Search for RAW extrema + 2D heat map of the function |
| 9 | Test_AO_AntiCheat.mq5 | Script | Cheating test for optimization algorithms |
Translated from Russian by MetaQuotes Ltd.
Original article: https://www.mql5.com/ru/articles/22075
Warning: All rights to these materials are reserved by MetaQuotes Ltd. Copying or reprinting of these materials in whole or in part is prohibited.
This article was written by a user of the site and reflects their personal views. MetaQuotes Ltd is not responsible for the accuracy of the information presented, nor for any consequences resulting from the use of the solutions, strategies or recommendations described.

 Machine Learning Under Constraint (Part 4): The Stop-Loss Ceiling Meets the Optimal Trading Rule Search
 Benchmark Champions vs. Real-World Optimization Problems
 Real-Time Polynomial Regression: A Causal Savitzky-Golay Implementation for MQL5
 Hyperdimensional Computing: Learning in One Integer Add, and the Nulls That Judge It

- Free trading apps
- Over 8,000 signals for copying
- Economic news for exploring financial markets
You agree to website policy and terms of use