 MetaTrader 5
 专家
专家
 指标
指标
 程序库
程序库
 实用工具
实用工具
 窗口小部件
窗口小部件
 规则
规则
适用于MetaTrader 4的技术指标
 下面列出的技术指标信号对MetaTrader 4平台的开仓交易和平仓交易起着至关重要的作用。
指标的本质就是一种交易品种的数学转换,旨在预测价格变化。
下面列出的技术指标信号对MetaTrader 4平台的开仓交易和平仓交易起着至关重要的作用。
指标的本质就是一种交易品种的数学转换,旨在预测价格变化。 
Trend Sniper X 是一款用于 MetaTrader 5 的多周期趋势追踪指标,旨在帮助交易者清晰、精准地识别趋势方向及潜在的反转点。 适用于 MT5: https://www.mql5.com/en/market/product/181101 价格信息: 当前价格为促销价,随着后续更新和新功能的推出,价格可能会发生变动。 Code2Profit 频道 通过多周期分析掌控市场! 如何使用 Trend Sniper X 最大化胜率:关键规则与交易时段技巧 技术规格 交易平台 MetaTrader 5 指标类型 多周期趋势指标 运行时间周期 任意图表周期,支持独立选择更高周期(M1–MN1) 主要交易品种 外汇、黄金 (XAUUSD) 及其他 CFD 差价合约 推荐账户 任何账户类型 可视化呈现 彩色趋势 K 线(买入/卖出/弱势/转变)+ 买入/卖出信号箭头 附加模块 市场交易时段框(悉尼、东京、伦敦、纽约) 核心功能 多周期趋势分析: 将更高周期的趋势方向直接投影到当前图表上,提供清晰的宏观视角。 弱势/不确定 K 线检测: 高亮显示趋势状况不明确的 K 线,帮助交易者远离震

两个振荡器的组合。第一个显示入场点,第二个显示当前趋势。该指标可以通过两种模式的箭头显示振荡信号,所有快速振荡信号或仅在当前趋势方向的信号。它具有多时间范围面板和三种类型的信号通知。 好处: 适合当日交易和倒卖交易 趋势过滤 简单而灵敏的设置 多时间框架面板 适合融入顾问。 适用于任何交易品种和任何时间范围 三种类型的通知 MT5 version -> HERE / Problem solving -> HERE 指标策略 该指标由两个不同的振荡器组成: 慢趋势线(粗) - 当指标的最高水平从上到下交叉时,它是下降趋势的指标,当较低的水平水平(指标的低水平)从下到上交叉时,它是下降趋势的指标上升趋势。此外,在较低区域找到一条慢线表明当前趋势是下降趋势,反之亦然,在上方区域找到一条慢线表明当前趋势是上升趋势。这就是该指标确定当前市场趋势的方式。 快速入场线(细):识别从下到上与下线相交处的入场点,这是买入信号,在从上到下穿越上线时,这是卖出信号。除了振荡线之外,调整指标线也很重要,因为这会影响信号的数量和准确性。 本产品使用不同的振荡器来显示慢线和快线,每个振荡器必须单独调整。 为

SR Liquidity 是一款旨在揭示市场流动性高度集中且价格反应最剧烈的隐蔽区域的交易指标。这些特殊的流动性区域充当着强有力的支撑位与阻力位,为您清晰呈现市场最可能发生反转的位置。 SR Liquidity 指标并非简单地绘制常规的支撑/阻力线,而是通过分析实际的价格行为,识别买卖压力积聚的区域。这些区域实际上是推动市场真实波动的流动性池。通过在图表上直观呈现这些区域,该指标能助您在价格反应发生前预判走势——这意味着它实际上能够预测价格方向可能发生的变化。它将原始的价格行为转化为清晰且具实操价值的市场蓝图,标示出那些可能成为市场转折点的关键价位。 该指标适用于任何交易品种和时间周期——包括外汇、指数、金属、加密货币等。支持任意时间周期。 购买后请联系我,以获取交易指南及免费赠送的优质附加指标!

Super Signal – Skyblade Edition 專業級無重繪 / 無延遲趨勢信號系統,擁有卓越勝率 | 適用於 MT4 / MT5 在較低的時間週期上效果最佳,例如 1 分鐘、5 分鐘與 15 分鐘圖表。
核心特色: Super Signal – Skyblade Edition 是一套專為趨勢交易設計的智能信號系統。
其採用多重濾波邏輯,僅篩選出具有明確方向性、動能強勁且波動結構健康的走勢進場點。 本系統 不預測高點或低點 ,只有在同時滿足以下三項條件時才會觸發交易信號: 趨勢方向明確 動能持續增強 波動率結構穩定 此外,系統還結合市場流動性分析,以進一步提升信號的準確性與觸發時機。 信號特性: 所有箭頭信號皆為 100% 無重繪,無延遲 信號一旦出現即固定於圖表,不會閃爍或消失 提供圖表箭頭、資訊面板、彈出通知、聲音提示及推播訊息 支援 EA 呼叫(Buffer 輸出),可整合至自動化交易或信號跟單系統 提供預設參數模板,免調整即可使用,適合新手快速上手
總結: Super Signal – Skyblade Edition 是一款邏輯清晰、穩定高效的專業趨勢型

折扣将在 24 小时后结束——下一价格为 69 美元 联系我获取推荐设置
首发名额有限
ZORYK — MetaTrader 4 专业 XAUUSD 黄金信号与交易计划系统
你一定经历过这种感觉。
你花时间分析黄金,等待入场,终于打开交易后,价格却立即向相反方向移动。你过早平仓,移动止损,或者因为犹豫几秒而错过机会。随后市场在没有你的情况下,准确到达你最初预期的目标。
问题并不总是方向错误。
真正的问题是不确定性。
你不知道真正的入场位置在哪里,不知道交易逻辑在什么位置失效,也不知道应该先保护较小的利润,还是继续等待更大的行情。你甚至不知道当前信号是否足够强,还是自己只是在勉强寻找一笔交易。
黄金移动速度非常快。没有明确计划的正确判断,也可能在几秒钟内变成错误决定。
ZORYK 正是为了解决这个问题而开发。
什么是 ZORYK
ZORYK 是一套专门为 MetaTrader 4 和 XAUUSD M5 周期开发的完整黄金信号与交易计划系统。
它不是一个只显示 BUY 或 SELL 箭头,然后让你独自处理所有后续决定的普通指标。
每个确认信号都可以在图表上显示

TREND LINES PRO 帮助您了解市场真正的方向转变点。该指标显示真实的趋势反转点以及主要参与者重新入场的时机。
您可以看到 BOS线、 趋势变化和更高时间框架的关键水平——无需复杂的设置或不必要的干扰。信号不会重绘,并在K线收盘后仍然保留在图表上。 VERSION MT 5 - 与……搭配使用时,可发挥其最大潜力 RFI LEVELS PRO 指示器 该指标显示的内容:
实际变化 趋势(BOS 线) 一旦信号出现,它就始终有效!这与会重绘的指标有着重要的区别,后者可能会发出信号后又改变信号,从而导致资金损失。现在,您可以更精准、更准确地进入市场。此外,还有一个功能,会在箭头出现后为K线着色,直到达到目标价位(止盈)或出现反转信号为止。 重复条目 以及主要玩家的充值 为了提高寻找入场点时的视觉清晰度,我们创建了一个模块,该模块首先显示买入/卖出区域,并在该区域内寻找最佳入场点。此外,我们还加入了智能逻辑来管理止损位,该逻辑会随着时间的推移逐步降低止损位的大小,从而降低入场交易时的初始风险(移动止损位)。 信号强度水平(BOS) 该指标采用三个显著性等级来衡量

M1 SNIPER 是一款易于使用的交易指标系统。它是一个专为 M1 时间框架设计的箭头指标。该指标可以作为独立的系统在 M1 时间框架下进行剥头皮交易,也可以作为您现有交易系统的一部分使用。虽然该交易系统专为 M1 时间框架交易而设计,但它也可以用于其他时间框架。我最初设计此方法是为了交易 XAUUSD 和 BTCUSD。但我发现这种方法在其他市场交易中也同样有用。 指标信号既可以顺势交易,也可以逆势交易。我教授一种特殊的交易技巧,帮助您利用指标信号进行双向交易。该方法基于使用特殊的动态支撑位和阻力位区域。 购买后,您可以立即下载 M1 SNIPER 箭头指标。此外,我还为所有 M1 SNIPER 工具用户免费提供下方屏幕截图所示的 Apollo Dynamic SR 指标!这两个指标的组合可以帮助您更轻松、更准确地利用 M1 时间框架进行交易。 购买后请联系我,免费获取交易提示和奖励指标! 祝您交易成功!

Atomic Analyst — MetaTrader 4 如有产品、设置或技术支持方面的问题,请直接在 MQL5 上给我发消息。 该指标将复杂的市场计算转换为简单的视觉信号、彩色K线、趋势读数、止损水平和多个止盈区域,使交易者能够快速理解并应用于真实市场环境。 主要交易用途: 剥头皮和日内交易:
专为快速决策、清晰箭头、提醒、K线颜色和结构化进出场区域而设计。 日内交易和波段交易:
帮助交易者利用趋势方向、强度、动能和多周期分析跟随更大的市场波动。 主要功能: • 价格行为、强度和动能分析
• 多周期趋势扫描器
• 总体趋势百分比计算
• 买入和卖出箭头
• 止损和多个止盈水平
• 最多 5 个基于斐波那契的止盈水平
• 移动止损逻辑
• 用于趋势和动能的彩色K线
• 实时提醒到终端、手机和电子邮件
• 现代化用户友好面板
• 实时交易监控
• 买入和卖出潜力显示
• 总交易数量显示
• 每日、每周和总利润显示
• 每日佣金计算
• Bid、Ask 和点差显示
• K线计时器、本地时间和服务器时间
• 终端连接状态
• 账户货币显示
• 可直接从面板控制时间周期
• 可手动使用,

Smart Trend Trading System 是适用于 MetaTrader 4 的图表指标,将趋势信息、入场和出场信号以及价格水平集中呈现在同一图表上。 它将 10 多种交易工具 整合到一个系统中,包括趋势检测、反转区域、Smart Cloud、移动止损逻辑、支撑与阻力、K线着色、提醒以及多周期分析。 该系统旨在帮助您应对不同的市场环境: 趋势市场:
识别主要趋势,发现回调,跟随动能,并通过止损指导和移动止损选项寻找更清晰的入场机会。 震荡市场:
识别区间震荡状态,寻找价格反应区域,并在价格触及重要水平时获得更清晰的信号。 剥头皮和日内交易:
使用快速信号、K线颜色、提醒和多周期确认,辅助短线交易决策。 主要功能: • 10 多个指标整合为一个交易系统
• 7 多种策略和信号组合
• 趋势跟随、反转、剥头皮、日内交易和波段交易模式
• 入场和出场箭头
• Smart Cloud
• Smart Reversal Zones
• 支撑和阻力水平
• Smart Trailing Stop
• 多周期趋势分析
• 成交量、趋势和反转K线着色
• 手机、电子邮件和终端提醒
•

PRO Renko Arrow Based System for trading renko charts. 准确的信号交易任何外汇工具. 另外,我将免费提供系统的附加模块! PRO Renko系统是RENKO图表上高度准确的交易系统。该系统是通用的。 该交易系统可应用于各种交易工具。 该系统有效地中和了所谓的市场噪音,打开了获得准确反转信号的通道。 该指标易于使用,只有一个参数负责产生信号。 您可以很容易地使算法适应您感兴趣的交易工具和renko酒吧的大小。 我很乐意通过提供任何咨询支持来帮助所有客户有效地使用该指标。 祝您交易成功!购买后,立即写信给我! 我将与您分享我的建议和我的renko发电机。 另外,我将免费提供系统的附加模块!

货币强度向导是一个非常强大的指标,为您提供成功交易的一体化解决方案。该指标使用多个时间范围内所有货币的数据来计算这个或那个外汇对的力量。此数据以易于使用的货币指数和货币电力线的形式表示,您可以使用它们来查看这种或那种货币的力量。 您所需要的只是将指标附加到您要交易的图表上,该指标将向您显示您交易的货币的真实强度。该指标还向您显示买卖量压力的极值,您可以在顺势交易时利用这些压力。该指标还显示了基于斐波那契的可能目标。该指标可用于各种交易时间范围。该指标支持各种货币对的交易。 该指标为您提供所有类型的警报,包括推送通知。 购买后请联系我。我将与您分享我的交易技巧,并免费为您提供丰厚的红利指标! 祝您交易愉快,获利丰厚!

目前40%的折扣
任何新手或专家交易者的最佳解决方案!
这个指标是一个独特的、高质量的、可负担得起的交易工具,因为我们纳入了一些专有的功能和一个新的公式。只需一个图表,你就可以读出28个外汇对的货币强度!想象一下,你的交易将如何得到改善,因为你的交易是在你的手中进行的。想象一下,你的交易将如何改善,因为你能够准确地确定新趋势或剥头皮机会的触发点?
用户手册:点击这里 https://www.mql5.com/en/blogs/post/697384
这是第一本,原版的! 不要买一个毫无价值的崇拜者的克隆品。
特别的 子窗口中的箭头显示强劲的货币势头GAP将指导你的交易! 当基础货币或报价货币处于超卖/超买区域(外盘斐波那契水平)时,在个人图表的主窗口中出现警告信号。 当货币力量从外围区间回落时,回撤/反转警报。 十字星模式的特别警报
可选择多个时间框架,以快速查看趋势! 货币强度线在所有的时间框架中都非常平稳,当使用较高的时间框架来识别总体趋势,然后使用较短的时间框架来确定精确的入口时,效果非常好。你可以根据自己的意愿选择任何时间框架。每个时间框架都由其自身进行了优化。

Liquidity Scalper System: 基于流动性的指标形式交易系统。 大多数指标只显示一个箭头,止损放在哪里、目标在哪里、信号是否可信,都要交易者自己判断。Liquidity Scalper System 覆盖完整的交易周期:寻找流动性池,在其被突破时给出信号,立即计算 Entry、Stop Loss 和三个目标,并在面板上显示统计数据以及新数据上的验证结果。系统自行选择设置,并每天更新。 工作原理 1. 系统寻找流动性池:市场参与者止损单聚集的价位。 2. 当价格突破流动性池,且突破经由动能(必要时还经由成交量)确认后,图表上出现 BUY 或 SELL 箭头。 3. 立即绘制 Entry、Stop Loss、TP1、TP2 和 TP3 水平,并填充区域。 4. 右侧构建流动性分布图:可以看到价格上方和下方大成交量集中的位置。 与众不同之处 • 自动优化取代手动调参。 系统在历史数据上测试 32 种设置组合,为当前品种和周期选出最佳组合。优化目标可选:Win Rate、净利润或盈利因子。 • 新数据验证。 设置在一部分历史上训练,并在优化器未见过的更新数据上检验(out

Tokyo Indicator(东京指标)直观地展示了趋势方向、潜在交易信号及市场状况。 其采用颜色编码的阶梯式趋势线,以蓝色标识看涨阶段,以洋红色标识看跌阶段。配套的方向箭头会在趋势发生变化时,标示出潜在的买入与卖出机会。 内置的综合仪表盘将当前信号、市场倾向、动能、波动率及信号质量整合于同一视图中,方便交易者在观察价格走势的同时评估指标数据,无需在不同面板间切换。 凭借清晰的图表显示和简洁的市场概览,Tokyo Indicator 支持以系统化的方式进行趋势分析与交易确认。 适用于任何时间周期及各类交易品种,尤其适合黄金交易。 购买后请立即联系我,以获取专属赠品!您可以免费获得我们的“强力支撑与趋势扫描”(Strong Support and Trend Scanner)指标,请私信我! 设置说明与使用手册请见此处。 请注意:我不会在 Telegram 上出售我的 EA 或特殊参数设置(set files);我的 EA 仅在 Mql5 平台上提供,而参数设置文件仅在我的博客(此处链接)上发布。请务必警惕诈骗,切勿从他人处购买任何参数设置! 设置 ShowHUD —— 在图表上显示

Scalper Vault 是一套功能强大且配置完善的交易系统,专为追求日内交易稳定性的交易者而设计。 作为一套完整且独立的交易系统,该高精度指标能够为外汇和二元期权交易者提供机构级的市场分析。 购买后请联系我,获取我的独家交易技巧以及一份超值赠品! Scalper Vault 能够消除凭感觉交易和复杂的各种手动分析,让您只需专注于执行交易,并运用简单易行的交易技巧进行操作。 精准的顺势交易信号:其核心算法通过分析市场结构,仅在市场主导趋势的方向上提供高胜率信号,从而大幅减少错误的入场操作。 精确的顶部与底部探测:系统能够识别市场动能耗尽的状态,从而锁定潜在的反转区域。 基于江恩(Gann)理论的买卖区域:系统会自动绘制江恩数学市场点位,让您能清晰洞察大型机构交易者在何处寻求买入或卖出。 100% 不会重绘(Non-Repainting):一旦K线收盘,生成的信号便会永久固定在图表上。绝无动态偏移,绝无虚假信号——您在历史数据中所见,即为该指标的真实表现。 广泛的市场适用性:适用于各类货币对、黄金、指数以及加密货币交易。

This is a professional chart indicator designed for traders focused on stability and clear price action. It helps filter market noise and provides clear visual entry and exit zones for your trading decisions. Core Features: Strictly Non-Repainting: The system is built with strict non-repaint logic. What you see on the chart is the true historical performance. Confirmed Signals: Signals are triggered and confirmed only after the candle closes . Once a trading arrow appears on a closed candle, it

目前8折优惠!
对任何新手或专家交易者来说都是最好的解决方案!
这个指标是专门用来显示任何符号的货币强度,如异国货币对、商品、指数或期货。它是同类产品中的第一个,任何符号都可以添加到第9行,以显示黄金、白银、石油、DAX、US30、MXN、TRY、CNH等的真实货币强度。这是一个独特的、高质量的、负担得起的交易工具,因为我们已经纳入了一些专有的功能和一个新的公式。想象一下,你的交易将如何改善,因为你能够准确地确定新趋势或剥头皮机会的触发点?
用户手册:点击这里 https://www.mql5.com/en/blogs/post/708876
它适用于所有时间框架。你将很快能够看到TREND! 根据新的基础算法设计,它使识别和确认潜在交易变得更加容易。这是因为它以图形方式显示了8种主要货币和一种符号的强弱。
该指标显示了8种主要货币(澳元加元瑞士法郎欧元英镑日元新西兰美元)的强弱线,再加上一个符号! 该指标显示了符号的真实价值。例如:对于XAUUSD(黄金):价格以美元报价。如果黄金在上涨,你怎么能知道是黄金的强势还是美元的弱势?只有当黄金走强时,我们才会进行交易。该指

Scalper Inside PRO 帮你分析日内趋势,在入场前就把交易规划好。核心是三套专属策略,让你更精准地读懂市场。信号一出现,指标就自动判断行情方向并计算关键价位,你能提前看到潜在入场点、预期的止损以及多个止盈位。详尽的绩效统计会展示不同品种和策略在历史上的表现,帮你根据当前行情挑选合适的资产。它既可以作为独立的剥头皮工具,也可以融入你的系统,或者作为你自己 EA 的基础。运行于 MetaTrader 4 平台。 指标会直接在图表上标出入场、三个止盈位 - TP1、TP2、TP3 以及一个可选止损。你甚至可以接入自己的箭头指标,检验它们的统计数据和盈利能力。 购买后请直接联系我,即可获得指标的专属附赠 add-ons、更多关于实盘运用的说明,以及把它正确接入你自己交易系统和 EA 的帮助。 指标主要功能 内置三套专属交易策略,可即时切换。 箭头信号出现后即时计算价位:入场以及 TP1、TP2、TP3 多级目标立刻显示,方便你提前规划交易。开启手动或自动计算后,会显示止损位。 三套策略均内置优化模块:自动把参数适配到当前品种和周期,帮你快速筛选资产(仅在实时状态下可用)。 HTF

现在优惠 30%! 任何新手或专业交易者的最佳解决方案! 该指标是一款独特、高质量、且价格合理的交易工具,因为我们已经整合了许多专有功能和新公式。 依据此更新,您将能够显示双重时间帧区域。 您不仅可以显示一个较高的时间帧,还可以同时显示图表时间帧,加上更高的时间帧:显示嵌套时区。 供需双方所有交易者都会喜欢它。 :)
重要信息披露 高级供需的最大潜力,请访问 https://www.mql5.com/zh/blogs/post/720245 想象您的交易如何得以改善,是因为您能够精准定位入场或目标位吗? 构建于新的底层算法,它可以更轻松地识别出买卖双方之间的潜在失衡。 这是因为它以图形方式展示供需最强劲区域,及其过去的表现(显示旧区域)。 这些功能旨在帮助您更轻松地发现最佳入场区域和价位。 现在您可以针对您的交易品种和时间帧来优化和编辑区域强度! 高级供需指标适用于所有产品和时间帧。 它是一个新的公式,非常新的功能是两个区域强度函数可由用户输入进行调整! 这在交易中是一大优势。 当您学习如何使用专有功能,例如带有价格游离最小 X 因子的区域强度时,您能够判断该区域强劲与否。 供需

Miraculous Indicator Binary & Forex v3 StrategySafe Miraculous Indicator Binary & Forex v3 StrategySafe 是一款专业交易指标,适合希望获得清晰信号、强大确认工具以及结构化交易方式的 Binary 和 Forex 交易者。 v3 版本加入了 MIR Dashboard、Miraculous Confirmation Dashboard、GANN Law、Square of 9 水平线、GANN 角度以及更强的 Forex 分析模式。 核心功能 同时支持 Binary 和 Forex 交易模式。 MIR Dashboard 可快速读取市场状态。 Miraculous Confirmation Dashboard 用于确认交易机会。 GANN Law drawing lines 用于 Forex 市场结构分析。 Square of 9 线条、方向和关键价格水平。 1x1 GANN Angle 用于判断趋势压力。 Entry Information TP 帮助寻找合理止盈区域。 Strateg

Ultimate AIO ICT Concept Indicator for MT4:自动掌握 Smart Money Concepts 您是否厌倦了每天花费数小时手动绘制图表?AIO ICT Concept 指标是您掌握 Smart Money Concepts 的一体化完整解决方案。这款强大的算法工具旨在消除手动技术分析的猜测和情绪疲劳,自动在您的图表上绘制出最关键的价格行为元素。 掌握市场方向和高级时间框架偏见 (High Timeframe Bias): 知道市场走向就成功了一半。借助我们先进的 Market Structure 映射和 Change in State of Delivery (CISD) 检测,您可以立即识别真实的市场趋势。一目了然地轻松确定您的每日和每周方向偏见。对于波段交易者和日内交易者来说,该指标在 H4、H1 和 M15 时间框架上绝对是游戏规则的改变者。它帮助您建立高度准确的 ICT 叙事并预测未来的价格行为,而无需您自己费力地绘制线条和区域。 在较低时间框架上进行精准的盘口解读 (Tape Reading): 到了执行的时候,AIO ICT Con

Introducing Volume Orderflow Profile , a versatile tool designed to help traders visualize and understand the dynamics of buying and selling pressure within a specified lookback period. Perfect for those looking to gain deeper insights into volume-based market behavior! MT5 Version - https://www.mql5.com/en/market/product/122657 The indicator gathers data on high and low prices, along with buy and sell volumes, over a user-defined period. It calculates the maximum and minimum prices during this

"The Squeeze indicator attempts to identify periods of consolidation in a market. In general the market is either in a period of quiet consolidation or vertical price discovery. By identifying these calm periods, we have a better opportunity of getting into trades with the potential for larger moves. Once a market enters into a "squeeze," we watch the overall market momentum to help forecast the market direction and await a release of market energy." Modified TTM Squeeze Indicator is a modifica

Day Trader Master 是一个完整的日间交易者交易系统。该系统由两个指标组成。一个指标是买入和卖出的箭头信号。这是你得到的箭头指示器。我将免费为您提供第二个指标。第二个指标是专门设计用于与这些箭头结合使用的趋势指标。 指标不重复也不迟到! 使用这个系统非常简单。您只需按照当前趋势方向的箭头信号,显示为双色线。蓝色是买入趋势。红色是一种销售趋势。蓝色箭头是买入信号。红色箭头是卖出信号。您需要箭头的颜色和信号的方向来匹配趋势线的颜色。 箭头指标主要是为 M5 和 M15 时间间隔的日内交易而创建的。但从技术上讲,该系统可以用于其他时间间隔。 指示器配备带有推送消息功能的弹出警报。 购买后一定要写信给我!我将为您提供与系统交易的个人建议,以及我的趋势指标。此外,还有丰厚的奖励等着您!

Gann Made Easy 是一个专业且易于使用的外汇交易系统,它基于使用先生理论的最佳交易原则。 W.D.江恩。该指标提供准确的买入和卖出信号,包括止损和获利水平。您甚至可以使用推送通知在旅途中进行交易。 购买后请联系我,即可免费获得交易指导和超棒的额外指标! 您可能已经多次听说过江恩交易方法。通常 Gann 的理论不仅对于新手交易者而且对于那些已经有一定交易经验的人来说都是非常复杂的东西。这是因为江恩的交易方法在理论上并不那么容易应用。我花了几年时间来完善这些知识,并将最好的原则应用到我的外汇指标中。 该指标非常易于应用。您所需要的只是将其附加到您的图表并遵循简单的交易建议。该指标不断进行市场分析工作并寻找交易机会。当它检测到一个好的入口点时,它会为您提供一个箭头信号。该指标还显示止损和获利水平。 换句话说,当您像先生一样进行交易时,该指标会为您提供最佳江恩建议。江恩亲自告诉你此时此刻该做什么。但最好的部分是您不需要了解任何有关江恩交易原则的知识,因为该指标会为您完成整个市场分析工作。

ZONEFUSION PRO INSTITUTIONAL CLUSTER SYSTEM ZoneFusion Pro 是一款专业级外汇交易系统,专为追求精准、结构化和稳定交易的交易者打造,基于真实的机构交易逻辑。 该系统专为严肃的外汇交易者、道具账户(Prop Firm)挑战者以及 SMC 交易者设计,消除交易中的猜测,用清晰、规则化的执行框架取而代之。 它将多时间框架市场结构、供需区以及移动平均线共振整合为一体,帮助你精准识别高概率入场机会。 核心功能 多时间框架市场结构 自动识别 D1 和 H4 的机构供需区
标记价格最有可能产生反应的关键流动性区域
随着市场结构变化动态更新 双移动平均系统 通过快慢均线判断真实趋势方向
过滤低质量和逆趋势交易
确保交易顺应机构动能 多时间框架趋势确认 通过 H1 和 H4 的趋势一致性确认方向
避免假突破和市场陷阱
提升入场时机和准确性 集群信号引擎 仅在多重条件共振时生成买卖信号
条件越多,信号越强
帮助捕捉早期突破和反转机会 区间强度逻辑 当卖出区合并并变为蓝色时,表示强力卖出区
这意味着机构正在进行强势派发 当需求区合并并变为亮绿色时,表示

Apollo Pips Generator 是提供趨勢方向信號的指標。該指標提供多個入口點,因此您總能找到獲利的交易機會。注意截圖。 屏幕截圖顯示了點數生成器工具與我的其他工具的組合,該工具由帶有指示頂部和底部的星形信號的通道表示。這種組合為您提供了多種應用系統的方式。 購買後請聯繫我免費獲得我的第二個指標。您將擁有與我在屏幕截圖中顯示的完全相同的系統。 我還將為您提供有關如何使用該系統以獲得最佳結果的說明。 這兩種工具都提供所有類型的警報,包括推送通知。 該指標可用於任何貨幣對、商品、指數、金屬或任何其他資產。它也可以用於任何時間範圍。 無論您擁有何種級別的交易經驗,您一定會發現此工具對您的交易需求和目標很有幫助。 祝您交易愉快!

All in One package includes the Oscillator Predictor , MACD Predictor , Thrust Scanner and Advanced Fibonacci indicators which are mandatory for applying Dinapoli trade plans.
Please visit below links for detailed explanations of indicators. Advanced Fibonacci Indicator => https://www.mql5.com/en/market/product/52834 Thrust Scanner Indicator => https://www.mql5.com/en/market/product/52830 Overbought /Oversold Predictor indicator => https://www.mql5.com/en/market/product/52621
Macd P

箭头只告诉您买入。Obsidian Scalper Pro 告诉您在哪里买、止损放在哪里、三个目标在哪里、按照您的风险仓位该有多大,以及这个形态在 100 分里值多少分。每个信号都以一份画在图表上的完整交易计划的形式到来,内置的统计窗口展示最近一百个信号的诚实结果,连带置信区间的胜率一并给出。每个决定都在收盘K线上做出,所以您看到的历史,就是您本可以交易的那段历史。 该指标在黄金(XAUUSD)M30 上表现最佳,也可用于任何其他品种和周期。 需要与之配套的策略吗? 购买后请在 MQL5 上给我发消息,我会发送给您。 它做什么 Obsidian Scalper Pro 在既有趋势中寻找回调入场,并为每一个入场交出一份现成的计划。Entry、SL、TP1 和 TP2,以及可选的 TP3,作为水平线和阴影区域直接画在图表上,带着价格标签和 R:R 比例。手数由您的风险百分比和这个信号实际的止损距离算出,使用亏损方向的跳动点价值,因此在 CFD 和交叉货币账户上都保持正确。每个信号还有一个 0 到 100 的 Score,面板上另有一个实时的就绪度数值,说明此刻的形态会有多好。 三层结构,一

GoldRush 趨勢箭頭信號
GoldRush 趨勢箭頭信號 指標為 XAU/USD 中的高速、短期短線交易者提供精確、實時的趨勢分析。
專為1分鐘時間框架設計,此工具顯示方向箭頭以明確顯示入場點,使短線交易者能在波動市場中自信操作。
該指標包含主要和次要警示箭頭。主要信號為白色和黑色方向箭頭,用於指示趨勢方向的轉變;次要信號為藍色和紅色箭頭,用於確認主要箭頭指示的方向並提示潛在交易入場點。
注意:當趨勢方向發生變化後僅出現一個主要警報箭頭時,請注意可能會出現多個次要藍/紅箭頭。次要信號將在滿足信號標準的任何蠟燭圖後出現,因此在長期趨勢移動中,螢幕上將顯示大量次要箭頭(如附帶的截圖所示)。您可在設置中開啟或關閉任一箭頭類型。
以下是我使用此指標進行交易的方式:
- 對於買入入場,我會耐心等待白箭頭在蠟燭收盤時出現,並在下一根可用蠟燭收盤時出現藍箭頭時進行買入交易。
- 對於賣出入場,我會耐心等待黑箭頭在蠟燭收盤時出現,並在下一根可用蠟燭收盤時出現紅箭頭時進行賣出交易。
- 獲利了結/止損設置由使用者自行負責,但我個人使用最低R:R為1:2,並發現這在倫敦/紐約開盤等

UR 趨勢疲憊
UR TrendExhaustion 是不想處理參數值或其他設置的交易者的最佳解決方案 - 它對每個人來說既簡單又直觀易懂。
使用 UR TrendExhaustion 的優勢:
無參數 您有 3 條線最能描述圖表上的情況:趨勢耗盡線、鯨魚資金線和零售資金線。 該界面展示了兩個極端(紅色區域)上任何一條線的耗盡 最大優勢:簡單且可適應所有資產。 有一個特殊的電報聊天,您可以在其中了解最新的工具更新,如果您覺得缺少什麼,也可以發送請求!
為什麼是 UR TrendExhaustion?
在我的整個職業生涯中,我一直在編寫多種指標,並達到了這樣一個地步,即我收集了我所有的知識來編寫這個簡單但最好的 (imo) 工具來進行交易,而不需要圖表上的任何其他工具。 易於理解,易於設置。 該策略的執行方式使做市商很難與它進行交易 - 將死 MM! 您與 UR TrendExhaustion 一起使用的任何其他工具都會增加您的交易,但我一直單獨使用它並取得了很好的效果。 祝你好運!
如何使用 UR TrendExhaustion ?
YT 上有一段視頻展示瞭如何使

Alright. This indicator works on MT4 and is very easy to use. When you receive a signal from it, you wait for that candle with the signal to close and you enter your trade at the beginning of the next new candle. A red arrow means sell and a green arrow means buy. All arrows comes with a long dotted like for easy identification of trade signal. Are you okay with that?
100% non repaint
Work All Major currency Pair,
1 minute time frame 1 minute expire

Neuro Poseidon is a new indicator by Daria Rezueva. It combines precise trading signals with adaptive TP/SL levels - creating best possible trades as a result! Message me and get Neuro Poseidon Assistant as a gift to automize your trading process!
What makes it stand out?
1. Proven profitability on all assets and timeframes
2. Only confirmed BUY and SELL signals present on the chart
3. Adaptive TP & SL levels generated by the software for each trade
4. Easy to understand - suitable for all

Extreme Value Sniper is a detrended price indicator Indicator finds the potential reversal levels by checking value ranges and price cycles. MT5 Version of the product : https://www.mql5.com/en/market/product/114550
It shows the overbought and oversold levels using the average range. Overbought Levels are between 4 and 10 Oversold levels are bewtween -4 and -10
Those levels can be used as a reversal levels.
Extreme Value Sniper look for some special divergence and convergence patterns to c
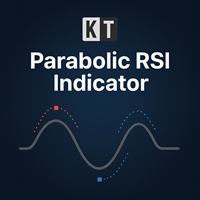
KT Parabolic RSI 将抛物线SAR直接叠加在RSI线上,用来突出可能的市场转折点。传统的RSI超买和超卖读数已经提示潜在的反转,但加入PSAR过滤器后,能有效去除大量噪音,使信号更加清晰和可靠,从而为交易者提供更稳健的入场和出场机会。 大方块信号: 当RSI处于超买或超卖区域时,Parabolic SAR翻转。这通常标志着高概率的市场转折。 小方块信号: 当RSI位于中性区间时出现的SAR翻转。将其视为低概率提示,更适合用于部分止盈或顺势跟随。
功能特点 将RSI动能和Parabolic SAR趋势翻转整合在同一个窗口中,无需再使用两个分离的指标。 出现在RSI窗口中的方块标记会同步显示在主图表上,这样您可以在观察价格走势的同时捕捉到信号。 结合K线形态分析和RSI-SAR定量信号,帮助您在入场前确认图表形态的可靠性。 支持自定义RSI周期、Parabolic SAR步长与最大值,以及超买和超卖阈值,以便适应不同交易风格与市场环境。 提供弹窗、声音、邮件和移动推送提醒,让您即使不在电脑前也能及时掌握每一个信号。
为什么结合RSI和Parabolic SAR有效 RSI

FibStrike Rejection 是一款功能强大的 MT4 指标,专为希望使用斐波那契回撤结合烛芯反转信号来可视化高概率买卖区的交易者设计。 该指标会根据可自定义的回溯周期自动识别最近的高点和低点,并绘制 100% 到 40% 的斐波那契水平。在这些水平内,高亮显示买入和卖出区域。 此外,指标会检测斐波那契区间和当日最高/最低价的烛芯反转,只在 定义的区域内生成箭头,从而减少噪音和错误信号。警报可选,包括声音提醒、手机通知和电子邮件提醒。 此指标适合使用 价格行为(Price Action)、烛芯反转或智能资金(Smart Money Concepts)进行入场的交易者,有助于识别关键区间内的强烈反转。 功能特点: 使用斐波那契回撤自动检测买卖区(100% → 40%) 烛芯反转箭头仅在 BUY/SELL 区域内显示 检测当日最高/最低烛芯反转,可选警报 斐波那契和每日烛芯检测参数分开设置 可配置箭头颜色、代码和阈值 支持弹窗、声音、手机和邮件提醒 区域标签及矩形高亮显示,便于视觉参考 可自定义回溯周期和区域延伸长度 工作原理: 检测回溯周期内的最新高点和低点。 在 100% 到

DayTrader PRO MT5: https://www.mql5.com/en/market/product/186222 DayTrader PRO 是一款先进的交易指标,它结合了约翰·埃勒斯 (John Ehlers) 的 Laguerre 滤波器与强大的自动优化引擎。该指标不依赖固定的参数,而是根据最新的市场状况自动搜寻最佳设置,帮助您在无需手动调整的情况下适应不断变化的市场波动。 该指标可生成清晰的买入 (BUY) 和卖出 (SELL) 信号,并提供根据当前市场波动率计算得出的自适应止损 (Stop Loss) 和止盈 (Take Profit) 水平。内置的趋势、效率系数 (Efficiency Ratio)、波动率和蜡烛图过滤功能,有助于剔除低质量的交易设置,从而提高信号的准确性。 实时性能面板会显示当前已优化的设置、利润因子 (Profit Factor)、胜率 (Win Rate)、回撤 (Drawdown) 以及其他交易统计数据。DayTrader PRO 还支持弹出窗口、推送、邮件和声音提醒,确保您不会错过任何交易机会。 主要功能 全自动参数优化 自适应买入

MSNR & OCL Combined:终极马来西亚支撑阻力线与价格行为指标 厌倦了手动绘制水平线,或者在厚重杂乱的区域内猜测价格会在哪里反应? 现在您可以节省时间并充满信心地进行交易。与绘制宽泛且模棱两可区域的传统工具不同, MSNR & OCL Combined 是一款先进的分析工具,旨在自动绘制精确的价格行为线。该指标专门设计用于简化高效的 马来西亚支撑和阻力(Malaysia SNR) 技术,为您的突破与回踩(Breakout & Retest)策略带来无与伦比的精确度。 主要特点: 全新独家功能 POI to POI: 当这种强大的“兴趣点到兴趣点(POI to POI)”反应发生时,指标会通过在最右端放置一个明显的 金色/橙色圆点(DOT) 来突出显示新形成的新鲜线条。 多时间框架(MTF)投影: 无需切换图表即可纵观全局。轻松将主要的高时间框架(HTF)支撑和阻力线直接投影到您的低时间框架执行图表上,以获得高概率的交易设置。 精准的 SNR 与角色转换检测: 自动识别主要市场结构的转变。该指标绘制精确的单一价格线,并动态标记关键的 阻力变支撑(RBS) 和 支撑变阻力(S
Binary Trader Master 是一个基于箭头的指标,可预测蜡烛的收盘价。它仅在一根蜡烛内进行分析。当蜡烛打开时,需要一些时间来进行分析并预测蜡烛的收盘价。然后它产生一个信号。该指标还允许您应用可用于分析的时间限制,这意味着您实际上可以告诉指标允许在蜡烛内进行分析的时间。该指标监控蜡烛中的特殊交易量模式。该分析实际上预测了当前 (0) 蜡烛的收盘价。由于此类蜡烛通常具有强劲的成交量,因此这些信号也具有良好的获利潜力,也可用于外汇交易。二元和外汇交易者都可以从该指标中受益。 由于指标与单个蜡烛的主体一起使用,因此指标仅在实时或视觉策略测试模式下提供信号! 信号不要重绘! 购买后请联系我!我会为您提供交易说明,免费赠送您丰厚的红利!

This Indicator only places quality trades when the market is really in your favor with a clear break and retest. Patience is key with this price action strategy!
If you want more alert signals per day, you increase the number next to the parameter called: Support & Resistance Sensitivity. After many months of hard work and dedication, we are extremely proud to present you our Break and Retest price action indicator created from scratch. One of the most complex indicators that we made with over

The indicator very accurately determines the levels of the possible end of the trend and profit fixing. The method of determining levels is based on the ideas of W.D.Gann, using an algorithm developed by his follower Kirill Borovsky. Extremely high reliability of reaching levels (according to K. Borovsky - 80-90%) Indispensable for any trading strategy – every trader needs to determine the exit point from the market! Precisely determines targets on any timeframes and any instruments (forex, met

Channel Pro MT4 Identify high-probability reversal zones with a single glance. Channel Pro MT4 combines a dynamic volatility channel with a color-coded momentum trend line to help traders spot potential price reversals before they develop. When price briefly breaks outside the channel and snaps back, the indicator marks the event with a clear arrow signal directly on the chart — no separate window needed. Key Features Non-repainting — all signals are confirmed on the closed bar only Upper and lo

CRT Candle Range Theory HTF MT4 - Ultimate CRT Indicator: 高级ICT概念与马来西亚SnR交易系统 使用最先进的 Candle Range Theory 指标掌握做市商的足迹。释放 Smart Money Concepts (SMC) 的真正力量,并使用 Ultimate CRT Indicator 像机构一样精确交易。该指标专为严肃的交易者打造,自动化了高效的蜡烛范围理论 (CRT)——ICT概念 (Inner Circle Trader) 的核心支柱,并通过马来西亚支撑与阻力 (SnR) 入场方法和 FVG (不平衡) 区域的致命精度对其进行了强化。 无论您是在 MT4 或 MT5 上交易外汇、加密货币还是指数,该算法都能消除市场噪音,过滤虚假突破,并将高概率、高回报的交易区域直接传送到您的图表上。 CRT Indicator 的核心功能: Absolute Extreme SnR Entry Engine: 与依赖滞后吞没形态的传统指标不同,我们的系统采用了马来西亚 SnR 技术。它在严格的时间窗口内扫描绝对最高的 Buy-

對稱三角形圖表模式代表價格被迫向上突破或崩盤之前的一段收縮和盤整期。向下趨勢線的突破標誌著新的看跌趨勢的開始,而從上部趨勢線的突破則表明新的看漲趨勢的開始。 獲取儀表板以立即監控您為對稱三角形模式交易的所有工具和時間範圍! https://www.mql5.com/en/market/product/69169/
此處提供 MT5 版本: https://www.mql5.com/en/market/product/70006/
該指標識別這些模式並在 4 個關鍵點形成且價格再次回落至三角形時提醒您,以便您為潛在的突破做好準備。對稱三角形並不總是完全對稱的,價格可以向上或向下突破,但通常最成功的突破是在形成三角形第一個點的高點或低點的方向上。因此,該指標為我們提供了對突破的看漲或看跌偏見,並採用顏色編碼並針對該特定方向發出警報。沒有必要只在一個方向進行交易,但是因為任何一個方向的突破都是可能的,但是當突破與第一個點趨勢一致時,您往往會獲得更大更快的價格變動和更好的風險回報。
輸入和配置選項:
開始搜索蠟燭 - 指標將開始尋找多少根蠟燭來尋找已完成的形態 Fib Max Ret
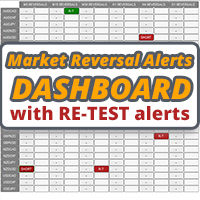
此儀表板是與市場結構反轉指標一起使用的警報工具。它的主要目的是提醒您在特定時間範圍內的逆轉機會,以及像指標一樣重新測試警報(確認)。儀表板設計為單獨放置在圖表上,並在後台工作,以向您發送有關您選擇的貨幣對和時間範圍的警報。它是在許多人要求衝刺以同時監控多個貨幣對和時間框架而不是讓市場反轉指標在一個 MT4 中的多個圖表上運行之後開發的。它會在 M5、M15、M30、H1、H4 和 D1 時間範圍內發出警報。當然,與交易中的任何事情一樣,更高的時間框架效果最好。
該儀表板被設計為市場結構反轉指標的附加組件。它將獨立工作,並提醒市場反轉警報指標給出的模式和信號。
在此處獲取市場反轉警報指標: https://www.mql5.com/en/market/product/46295 此儀表板的 MT5 版本可在此處獲得: https://www.mql5.com/en/market/product/65828 此處提供 EA:汽車交易市場反轉警報! https://www.mql5.com/en/market/product/65383
我創建的用於繪製矩形並提醒特定貨幣對的市場結構
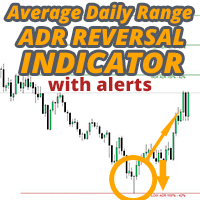
ADR 反轉指標一目了然地顯示當前價格相對於其正常平均每日範圍的交易位置。當價格超過您選擇的平均範圍和高於它的水平時,您將通過彈出窗口、電子郵件或推送獲得即時警報,以便您可以快速跳入回調和反轉。該指標在圖表上在平均每日範圍極值處繪製水平線,並在這些水平之上延伸,這些水平附加了價格超過它們的數學概率。下面的更多細節...... ADR 警報儀表板補充指標並監控所有配對也可在此處獲得: https://www.mql5.com/en/market/product/62756
MT5 版本也可在此處獲得: https://www.mql5.com/en/market/product/64477/
大約 60% 的時間價格在其正常的平均每日範圍 (ADR) 內交易並推高這些水平通常是價格急劇波動的指標,通常會出現回調(獲利了結)走勢。您可以通過交易從每日範圍的頂部或底部回落到最近的支撐位或阻力位來利用這些急劇波動。
收集了超過 20 年的歷史數據,以找出主要外匯對和一系列交叉盤的價格超出特定 ADR 水平的平均百分比。該數據表明價格僅在 3% 的時間內超過其 ADR 的 200%,這

SMC 全能版:机构市场结构与流动性分析 SMC (Smart Money Concept) 智能货币概念指标 是一款专为自动化价格行为分析而设计的综合工具。该指标能够实时标注内部和波段市场结构、高概率订单块(Order Blocks)以及流动性区域,助您告别繁琐的手动绘图。 通过识别机构参与者可能下达订单的位置,该指标可帮助您发现更精准的入场点(POI),优化您的交易决策。 核心交易优势: 自动化绘图: 立即识别 BOS 和 CHoCH,消除主观判断偏差。 流动性追踪: 自动标注相等高低点(EQH/EQL),识别潜在的扫损区域。 失衡区探测: 发现公允价值缺口(FVG),寻找市场失衡后的回补机会。 供需分析: 自动绘制牛市和熊市订单块,支持自定义显示深度。 溢价与折价区域: 始终明确当前价位处于相对范围的折价区还是溢价区。 主要功能: 实时结构分析: 完整标注内部和波段结构(BOS/CHoCH)。 订单块 (Order Blocks): 探测最新订单块,支持设置显示数量。 公允价值缺口 (FVG): 高亮显示失衡区,具备“自动阈值”功能以过滤噪音。 多时段 (MTF) 高低点: 显示
FREE

Break and Retest Hunter MT4 is a powerful MetaTrader 5 indicator designed to automatically identify support and resistance levels, breakout structures, and potential retest opportunities in real time. Bonus Indicator: After purchasing Break and Retest Hunter , contact me to receive Trade Indicator Assistant EA completely free as a bonus utility.
$65 for the next 10 copies . Next price is $120. Combining adaptive market analysis, clear BUY/SELL signals, Fibonacci-based profit targets, and a pre

趨勢捕捉指標
趨勢捕捉指標結合了作者獨有的客製化自適應趨勢分析指標,用於分析市場價格趨勢。它透過過濾掉短期噪音,並專注於潛在的動能強度、波動性擴張和價格結構行為,來識別真實的市場方向。此外,它還結合了平滑和趨勢過濾等客製化指標,例如移動平均線、相對強弱指標 (RSI) 和波動率過濾器。
您可以在這裡查看實際運行情況以及我的其他產品: https://www.mql5.com/en/users/mechanic/seller
請注意,我不會在 Telegram 上出售 EA 或任何設置,那是騙局。所有設定都可以在我的部落格上免費取得。
重要提示!購買後請立即聯繫我,以獲取使用說明和額外獎勵! 請注意,我不會在 Telegram 上出售 EA 或任何設置,那是騙局。所有設定都可以在我的部落格上免費取得。

Bermaui Bands (BB) 是一种技术分析工具,有助于在价格波动和趋势价格变动之间进行过滤。这个指标背后的想法可以在接下来的步骤中解释: 将标准偏差计算为一个在 0 到 100 之间移动的振荡器。我将其命名为 Bermaui Deviation 百分比 (BD %)。 如果“BD %”接近于零,则波动率处于极端状态。此外,如果“BD %”接近 100,则波动性非常低。 高波动性意味着趋势市场的可能性很大,而低波动性意味着横向或区间市场。 中线是简单移动平均线 (SMA),因为标准偏差是根据 SMA 计算的。 将“BD %”添加到计算中具有相同条数的简单移动平均线,以获得上伯毛伊乐队。 从计算中具有相同条数的简单移动平均线中减去“BD %”以获得下伯毛伊乐队。 重要信息
Bermaui Bands 用户手册: https://www.mql5.com/en/blogs/post/718688 Bermaui Bands Expert Advisor 示例 : https://www.mql5.com/en/blogs/post/731143
如何使用它 使用 Bermaui

Top Bottom Tracker 是一款基于复杂算法的指标,可分析市场趋势并检测趋势的高点和低点 / MT5 版本。
价格将逐步上升,直至达到 500 美元。下一个价格 --> $99
功能特点 无重绘 新数据到来时
该指标不会改变其数值
交易货币对
所有外汇货币对
时间框架
所有时间框架
参数 ==== 指标配置 ====
配置参数 // 40(值越高,发出的信号越少但越准确)
上水平值 // 80(上水平线的值)
下水平线值 // 20(下水平线值)
指标计算条数 // 3000(您希望指标计算多少条。数值 0 将计算所有条形图的指标)
==== 警报配置 ====
弹出警报 // true (在终端上发出警报)
电子邮件报警 // true (通过电子邮件报警)
警报时间间隔 // 10 (警报时间间隔,以分钟为单位)
警告 我只在 MQL5.com 上销售我的产品。如果有人联系您向您推销我的产品,那么他们就是骗子,只想要您的钱。
此外,如果您从外部网站购买我的产品,我向您保证,这些产品都是假冒版本,与正版产品效果不同。

精密指数振荡器(Pi-Osc)由Precision Trading Systems的Roger Medcalf开发
版本2经过精心重新编码,以在您的图表上加载速度非常快,还加入了一些其他技术改进,以提高体验。
Pi-Osc旨在提供准确的交易定时信号,旨在找到极端的耗尽点,这些点是市场被迫去触及,以清理每个人的止损单。
该产品解决了一个古老的问题,即知道极端点在哪里,这使得交易员的生活变得更加简单。
这是一个高度复杂的共识指标,与行业标准的振荡器相比,具有一些强大的区别。
它使用的一些特征包括需求指数、资金流动、RSI、随机指标、模式识别、成交量分析、标准偏差极端点以及不同长度上述各种变化的分歧。
乍一看,对于未经培训的人来说,它似乎与任何其他振荡器没有什么不同,但当与其他振荡器(如RSI或动量等)相对比时,这个指标的真正威力开始显现。
据我所知,没有其他振荡器可以频繁地精确指出顶部和底部,具有相同的定期效率。
精密指数振荡器由许多不同的数学方程组成,用于测量多个时间框架采样中的价格和成交量变动,从而高度准确地预测趋势可能发生转折的位置。
PTS Pi-Osc V2非

Universal Swing Arrows 是一种基于箭头的指标,旨在提供波段交易信号。它可用于任何交易对和任何交易时间范围。 箭头出现在当前 (0) 根蜡烛上。信号不要重绘! 该指标可用作独立交易系统或作为您个人交易策略的一部分。该指标的箭头不仅是一个信号,也是您可能的止损水平。该指标会自动为您计算最佳止损位,并在您的止损位准确绘制箭头。它使用保护性止损类型,为价格提供一些空间,以避免错误的止损触发。 该交易系统非常易于使用。您只需要选择交易对和交易时间范围即可。然后只需按照指示器信号操作即可。 购买后请与我联系。我将与您分享我的交易建议,并免费为您提供丰厚的红利指标! 祝您交易愉快,获利丰厚!感谢您的关注!

KURAMA GOLD SIGNAL PRO(MT4)— 7层过滤 · 自动止盈止损 · 质量评分 · 信号历史保存 | 完整的XAUUSD交易系统
实时不重绘。信号出现的瞬间,箭头、入场、止盈、止损当场锁定,之后绝不移动。你交易的就是这个实时信号。而且在v7.20中,每一个真正发出的信号都会自动保存,并在重启后精确还原。
购买者专属赠品 购买永久授权,即可免费获得 AI Zone Radar(价值$59)+ 完整PDF手册。在产品价格之外,额外附赠价值$59的赠品。购买后在MQL5上给我留言即可。 AI Zone Radar: https://www.mql5.com/en/market/product/175834
在黄金交易者社区中被实际使用,因精度与易用性而广受好评。
你的难题 —— 以及解决方案 黄金一天波动$30–$50。你知道机会就在那里。但这些情况是否似曾相识:
- 入场太早,价格逆行$10后才朝你的方

This indicator is unstoppable when combined with our other indicator called Support & Resistance . After purchase, send us a message and you will get it for FREE as a BONUS! Introducing Trend Punch , the revolutionary forex trend indicator that will transform the way you trade! Trend Punch is uniquely designed to provide precise buy and sell arrows during strong market trends, making your trading decisions clearer and more confident. Whether you're trading major currency pairs or exotic symb

TopBottom Checker 是确定价格底部和顶部的指标。该指标可用于任何货币对。该指标适用于从 M1 到 D1 的任何时间范围。 该指标可以用作独立的交易系统,也可以作为您使用的任何交易系统的一部分,因为该指标适用于对绝对任何策略都非常重要的市场方面。指标信号既可用于顺势入场,也可用于逆势反转,也可用于指示可能关闭未平仓头寸,即退出市场。该指标非常易于使用。您只需将指标添加到图表并根据您的需要遵循其信号。该工具可用于外汇交易和二元期权交易。 默认情况下,该指标可能会略微重新绘制其信号,因为进行分析以预测价格反转,试图找到形成此类条件的最早迹象。重绘是次要的,但可能。但我有办法将其减少到零!我向所有买家提供这种方法。 注意力!我将为每个买家提供我自己使用此指标的方法,这样可以消除信号的重绘,而不会延迟信号本身!我将教您如何使用该指标进行交易,并提供我自己的方法,该方法已在实践中证明是有效的。使用我的方法,您将对使用此交易指标充满信心。 购买后,请写信给我有关如何使用指标的提示和秘密,以及丰厚的奖金!

Volume Profile: multi-mode, multi-profile, drawn on the price chart The indicator draws a volume profile directly on the price chart, together with the Point of Control (POC) line, the Value Area (VAH and VAL) and optional peaks and valleys. Instead of reading volume in a separate bottom panel, the volume is shown at the price levels where it was traded, so price and volume can be read in one place. What the indicator displays POC (Point of Control) line : the price level with the highest traded

高级自定义加密货币外汇指标“自适应范围震荡指标”——MT4平台高效交易工具! ............................................................................................... - 该指标是新一代震荡指标——请查看图片了解使用方法。 - “自适应范围震荡指标”具有可调节的自适应超卖/超买区域和其他实用设置。 - 该震荡指标是寻找动态超卖/超买区域出场点的理想工具。 - 超卖区域:蓝线下方。 - 超买区域:黄线上方。 - 该指标适用于快速剥头皮交易和趋势策略,可用于检测价格回调的结束。 - 它比标准震荡指标更加精准。 - 该指标可用于任何时间周期。 - 内置PC和移动设备警报功能。 Click here to see high quality Trading Robots and Indicators! 这是仅在 MQL5 网站上提供的原创产品。

few free copies left
VOLURIS — Volume Profile 引擎
你已经知道怎么交易。你只是看不到你本来应该看到的东西。 这种感觉你以前一定经历过。
你进场。价格立刻反向走。你被止损扫掉。然后——就在下一刻——价格反转,并且准确地走向你原本判断的方向。你是对的。只是进早了。或者进晚了。或者两者都有。
你回头看图表,现在你看明白了。你的入场点上方正好有一个 Naked POC。上一交易时段的价值区域正好在价格停住的位置。VWAP 正在充当阻力,而你的图表上甚至没有它。市场背景已经把一切都告诉你了。你只是没有一个工具去读懂它。
这不是交易问题。这是信息问题。
VOLURIS 就是为了解决这个问题而存在。
什么是 VOLURIS
VOLURIS 不只是一个指标。它是一个为 MetaTrader 5 打造的完整 Volume Profile 决策工作区,从零开始设计,目的是让自主交易者在图表上、实时地、集中看到专业成交量交易者用来解读市场的关键信息。
不再需要运行五个不同的指标,然后在脑子里拼凑市场画面。不再需要猜价格是在价值区域内部还是外部
FREE
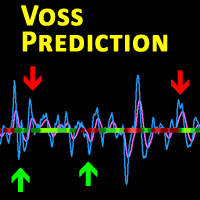
Description This is a modified version of the popular Voss Predictive Filter - A peek into the future by Dr. John Ehlers. It contains 2 lines - V-Line (blue) and F-Line (red), a trend indication and BUY/SELL signals.
Usage Buy Green dots indicate an up trend. Open a BUY position if the V-Line crosses the F-Line from below and an up trend is signaled (green dots) Close BUY position if V-Lines falls beneath F-Line again Sell Red dots indicate a down trend Open a sell position if V-Line falls

Prop Firm Sniper MT4 is a professional market structure indicator that automatically identifies high-probability BUY and SELL opportunities using BOS and CHoCH analysis.
Recommended Timeframes: For backtesting, use the indicator on M5 or M15 for Gold (XAUUSD), and M15 or H1 for more volatile Forex pairs such as GBPUSD, USDJPY, EURGBP , and similar markets.
CONTACT ME AFTER PURCHASE TO CLAIM YOUR FREE BONUSES!
Prop Firm Sniper is a professional market structure indicator designed t

## THE CHART, READ FOR YOU.
Chart reading is slow, and it is easy to get wrong. You need to know which highs and lows actually matter, which ones the market has already invalidated, and what the ones that remain are telling you. Miss a point and the whole read changes.
Cycle Finder Pro marks TRUE highs and lows, and nothing else.
A high is confirmed when two subsequent bars each take out the low beneath them. A low when two take out the high above. The bars need not be consecutive — the marke

免费获取此指标及 更多指标 ,请点击这里: 将指标转换为交易机器人(无需编程) 特别优惠 : ALL TOOLS ,每款仅 $35 ; 限时优惠 ! 新工具 将是 30 美元 为 第一周 或 前 3 次购买 ! MQL5 上的交易工具频道:加入我的 MQL5 频道以接收最新更新 多时间框架 & 多符号指南: 多时间框架 & 扫描仪用户指南 - 提供 12 种语言版本 请参阅 MT5 版本: Volumatic VIDyA MT5 Multi-Timeframe Scanner 请参阅 MT4 版本: Volumatic VIDyA MT4 Multi-Timeframe Scanner 查看更多产品: 所有产品 或 交易指标、特别优惠 & 新发布 Volumatic VIDyA Multi-Timeframe Scanner 将自适应趋势检测、基于 ATR 的波动带、枢轴流动性水平、定向成交量分析、多时间框架可视化和多交易品种扫描仪结合在一个综合指标中。 该指标的核心是使用 VIDyA - 可变指数动态平均 - 调整其平滑速度以适应当前的市

OrderFlow Absorption – 專業級MT4買賣差與吸收訊號指標 釋放真正訂單流分析的力量,OrderFlow Absorption 是MetaTrader 4上最強大的買賣差(Delta)直方圖與吸收訊號指標。專為想看清每一個價格波動背後真相的交易者設計,這個工具揭示了隱藏的買賣壓力與推動市場的吸收事件。 功能特色 買賣差直方圖視覺化: 以清晰的色彩直方圖即時顯示買方與賣方壓力。 吸收訊號偵測: 先進邏輯自動辨識多空吸收事件,及早預警潛在反轉。 圖表標記: 吸收訊號直接標示於主圖表,方便視覺辨識。 彈出式警報: 新吸收訊號出現時即時通知。 自訂門檻: 過濾弱訊號,專注高勝率機會。 資源管理: 高效運算,適用於大型圖表也能流暢運行。 全品種兼容: 適用於任何商品與週期,包括外匯、指數、商品等。 簡易整合: 參數簡單,快速上手與調整。 OrderFlow Absorption 的邏輯說明 OrderFlow Absorption 採用專利演算法,能在沒有完整Tick數據的情況下,估算每根K棒的買賣壓力(Delta)。它分析成交量、價格行為、K

Quantum Naked SMC Prime is a streamlined Smart Money Concepts indicator designed for traders who prefer a clean chart, structured market analysis and clear visual trade setups without unnecessary complexity. The indicator combines market structure, liquidity behavior, institutional zones and confirmation logic into a compact analytical framework. Instead of flooding the chart with technical indicators, Quantum Naked SMC Prime focuses on the core elements of price action and Smart Money Concepts

Trend Exhaustion Scanner Indicator As is well known, any long, steady movement increases the likelihood of a sharp reversal with each step. This indicator searches for narrow trends where movement occurs with minimal correction, running out of steam, and approaches the moment of reversal. The user simply sets a condition: the minimum number of consecutive candles without reversals, and the indicator on the information panel will display symbols, a timeframe, and a number of candles equal to or

Multi Anchor VWAP Pro MT4 – Pure Anchored VWAP | Adaptive σ-Bands | Smart Alerts Precision VWAP anchoring, purpose-built for MetaTrader 4. One-click anchors, dynamic σ-bands or %-bands and instant multi-channel alerts—ideal for scalpers, intraday and swing traders who need institutional-grade fair-value mapping. Public channel: CLICK HERE
Full User Guide – Need MT5? Click here WHY PROFESSIONAL TRADERS CHOOSE MULTI ANCHOR VWAP PRO VWAP is the institutional benchmark for fair value. This MT4

FORBEX PRO v17 Murrey Math • Market Profile • Volume Profile • Gann • Fibonacci • Auction Structure A complete market-analysis workspace for MetaTrader 4. FORBEX PRO v17 brings several analytical frameworks into one coordinated chart environment, allowing you to study price structure, value, volume, geometry, time and market behaviour without stacking multiple unrelated indicators on the chart. This can genuinely become the main analytical indicator on your MT4 workspace. It is not designed simp
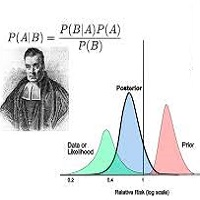
Bayesian methods can be effectively applied to predict price trends in financial markets, including Forex, stocks, and commodities. Here’s how Bayesian techniques can be used for trend prediction: 1. Bayesian Linear Regression Bayesian linear regression can be used to model the relationship between time and price. This method allows for the incorporation of prior beliefs about the trend and updates the trend as new data comes in. Example: Suppose you want to predict the price trend of a curren

Neuro Athena is an absolutely new way to get precise entry and exit trading signals. It uses the Fibonacci sequence as the basis for the calculation of its levels. With Neuro Athena you will always know when to open and close your trades with confidence. Message me and get Neuro Athena Assistant as a gift to automize your trading process! Why should you choose Neuro Athena? 1. Reliable Algorithm. Fibonacci sequence is not a new-age marketing slop that feels the Internet nowadays - it is one of
FREE
123456789101112131415161718192021222324252627282930313233343536373839404142434445464748495051525354555657585960616263646566676869707172737475767778798081828384858687888990919293949596979899100101102103104105106107108109110111112113114115116117118119120121122123124125126127128129130131132133134135136137138139140141142143144145146147148149150151152153154155156157158159160161162163164165166167168169170171172173174175176177
MetaTrader市场提供了一个方便,安全的购买MetaTrader平台应用程序的场所。直接从您的程序端免费下载EA交易和指标的试用版在测试策略中进行测试。
在不同模式下测试应用程序来监视性能和为您想要使用MQL5.community支付系统的产品进行付款。
