适用于MetaTrader 4的技术指标 - 34
As the suggested, with this indicator you are able to switch from one symbol or timeframe to another in the same single chart. So forget about opening tons of chart on your screen! It's not designed for ICT or SMC trader, but if you are that kind of trader you still can use it. Imagine you have a strategy containing various indicators and settings, on a single chart you can screen the entry opportunity then move to the next symbol or timeframe.
FREE
Recognizing trends is one of the most important analytical skills in trading. Not only technical traders, those who are fundamentally leaning to make the forex trend as the basis of analysis to determine entry trading. However, learning how to look at forex trends is not as simple as it seems. If you want signal accuracy to estimate the direction of the next price, then there are advanced methods in learning how to look at forex trends that you need to know. Strategy SIMPLE HOw to read trend mar
FREE

Buy and sell signals using the MACD histogram. The interface is simple and easy to understand. You can perzonalize the indicator in several ways according to its visual style or even more importantly, its setting of parameters to detect market signals. Using the Multiplier option in the menu you can increase the indicator period although it is recommended to use the default settings.
FREE

This indicator includes various types of moving averages. The indicator contains the following set of moving averages: CA (Cumulative Moving Average) MIN (Minimum for the period) MAX (Maximum for the period) SMA (Simple Moving Average) EMA (Exponential Moving Average) DMA (Double exponential moving average) TMA (Triple exponential moving average) LWMA (Linear Weighted Moving Average) SMM (Simple Moving Median) SMMA (Smoothed Moving Average) HMA (Hull Moving Average) NoLagMa The list of moving av
FREE

SmartStochasticMt4 is a universal indicator for making trading decisions. An indispensable tool for novice traders, as it has no settings and is ready to work after installation.
Advantages of the indicator:
1. Works with any trading symbol
2. Works on any time period
3. Has no configurable parameters
4. Provides a complete picture of the trading situation from different time periods
5. Not late
Working with the indicator
1. To set the indicator
2. To exclude from the time of the release of im
FREE

RSI Color and Notification Setting Usages :: 1. Set value Oversold and Overbought 2. Set period RSI 3. Set Color 4. Notify to Alert, Email and Mobile.
For Trading :: Forex and Binary option 1. When the color alarm occurs in the OVB area, do the preparation. To enter a Sell order 2. When the color alarm occurs in the OVS area, do the preparation. To enter a Buy order 3. When RSI is between OVB and OVS, consider another indicator to trade.
FREE

Altopium Trend is an indicator that identifies short-term trends. The signals it generates can be used to open long or short positions or can be integrated with other indicators/strategies. This is a trend indicator, be careful during narrow sideways phases. I recommend using it as a short-term trend indicator, complemented by other indicators that show the best times to enter the market.
Wait for the bar to close to confirm the signal.
FREE

Introducing MACD Jurik—an advanced indicator designed to enhance your forex trading strategy by integrating custom moving averages based on the Moving Average Convergence Divergence (MACD) with the MetaTrader 4 indicator, MACD.
Jurik moving averages are renowned for their accuracy and reliability in analyzing price movements in the forex market. They offer traders smoother representations of price action, reducing noise and providing clearer signals for identifying trends and potential reversa
FREE

Version History Date Version Changes 07/08/2022 1.00 Initial Release Description The Aroon indicator is a technical indicator that is used to identify trend changes in the price of an asset, as well as the strength of that trend. In essence, the indicator measures the time between highs and the time between lows over a time period. The idea is that strong uptrends will regularly see new highs, and strong downtrends will regularly see new lows. The indicator signals when this is happening, and
FREE
The Ergodic is an oscillator based on William Blau's True Strength Index, which is based on Momentum to which double smoothing has been applied. 100* EMA(EMA(Momentum) / EMA(EMA( |Momentum|)) The Ergodic adds a moving average to the TSI which will act as a Signal Line. This oscillator can be used to identify trend reversal zones, or trend continuation phases.
VERY USEFUL WHEN USED IN CONJUNCTION WITH THE CURRENCY INDEX.
L' Ergodic è un oscillatore basato sul True Strenght Index di William Bla
FREE

The Swaps Indicator allows to monitor the swap rates of desired instruments in one place. There are several ways to choose the instruments list for the indicator: Select instruments from Market Watch Select all instruments Select instruments from the manually adjusted list All the setings color settings are adjustable in the indicator: you can set color for headers, for symbol names, for positive and negative swaps. There is also an ability to adjust the distance between the rows, columns and st
FREE

The indicator allows you to trade binary options. The recommended time frame is М1 and the expiration time is 1,2,3 minutes. The indicator suitable for auto and manual trading. A possible signal is specified as a arrows above/under a candle. You should wait until the candle closes! Arrows are not re-painted Trade sessions: TOKYO section (Half-end) Currency pairs: USD/JPY Working time frame: M1 Expiration time: 1,2,3 minutes. The indicator also shows good results when using the martingale strateg
FREE

Supertrend Moving Average A combination of Supertrend and Moving Average to create a converging trade setup Input parameters: signal mode: set it to true if you want to plug it into STAT (Signal Tester and Trader) arrow shift: distance between fast EMA line to arrow on chart turn on moving average signal for converging setup supertrend period ATR multiplier Moving average period Averaging method Pricing You can find the best setting for 4 hour EURUSD on this video
FREE

Description I think, almost all traders dream about non-lagging MA. I have realized that dream in my indicator. It allows forecasting future MA values! The indicator can be used in four different ways: The first one - forecast for the desired amount of bars. Thus, you are able to evaluate future price behavior. The second one - generating non-lagging "averages". That can be implemented by moving MA back by the half of the averaging period and setting the forecast the necessary amount of bars ahe
FREE

TH3ENG CURRENCY STRENGTH SCANNER The best currency strength reader based on more than 4 excellent modes, based on Price action and Volume with various algorithms. This indicator reads all pairs data to measure and find the best results of all currencies and arrange it in a separated dashboard panel.
You can find the strongest currency and the weakest currency, then trade on them pair. NOT COPLICATED NOT REPAINTING NOT LAGING
Input Parameters
=== SYSTEM SETTING === Calc. Mode ==> Calculation m
FREE

FREE
ZigZag重绘检测器 本指标专为识别MetaTrader 4中ZigZag指标的重绘行为而设计。ZigZag指标虽然常用于识别趋势波段和重要转折点,但它具有“重绘”特性,即在未来行情发展后,先前已确认的高点或低点可能会被重新定位或修改,导致信号发生变化。 本工具通过在图表中绘制灰色箭头, 清晰标记ZigZag发生重绘的位置 ,让交易者一目了然地看到哪些高低点是后期修正的,而不是初始产生的。这种可视化方式有助于深入理解ZigZag的行为模式和潜在风险。 为什么它很重要:
重绘会使过去的交易信号看起来更准确,从而误导交易者对策略的信任和判断力,尤其在进行回测和信号评估时。通过使用ZigZag重绘检测器,您可以: 识别历史走势中的虚假信号 避免因重绘带来的交易陷阱 提高对技术分析指标的透明度和理解 优化策略回测的真实性和准确性 本指标适合任何希望更深入分析ZigZag行为的交易者,无论是手动交易者、量化策略开发者,还是对技术信号严谨性的研究者,都是一款不可或缺的辅助工具。
FREE

The BB Arrows MTF indicator is based on the Bollinger Bands indicator. Represents input signals in the form of arrows. All signals are generated on the current bar. In 2 modes, Signals are not redrawn (Exception of very sharp jumps)! All signals in MTF mode correspond to signals of the period specified in MTF. It is maximally simplified to use both for trading with only one indicator and for using the indicator as part of your trading systems. A feature of the indicator is that the indicator ti
FREE

该指示器基于renko,但其周期等于ATR指示器的周期。 XOATRHIST版本指示器,在图表上显示波段。更加信息化。 关闭波段以外的柱形,会形成x或者o , 这时候报警指示灯会提示 参数: §ATRPeriod - 用于计算ATR的步骤周期。§ 注意:指示器以收盘价格运作,因此需要考虑形成的柱形。 ------------------------------------------------------------------------ ------------------------------------------------------------------------ ------------------------------------------------------------------------
FREE

The Sextet is an MT4 indicator that displays 6 levels of Moving Averages, where the second is the moving average of the first, the third of the second, and so on. It gives a signal when all the moving average levels align in order. Get a Free Sextet EA, and read discussions about using The Sextet Indicator on Forex Factory:
The Sextet EA @ Forex Factory Check out the The Sextet Scalper Pro for a more elaborate scalping strategy also with Free EA . Key Features: Is a Moving Average of a Movin
FREE

Trends are like the "Saint Graal of traders": it can give you an higher win rate, a better risk to reward ration, an easier position management and so on...
But it is really hard to determine the trend with accuracy, avoiding fase signals, and with the right timing, in order to take massive movements. That's why I created the Trend Validator: a new and EASY tool that will make identifying trend and build new strategy a really easier work.
ANATOMY OF THE SOFTWARE
The indicator is composed by 3
FREE

Highly configurable CCI indicator. Features: Highly customizable alert functions (at levels, crosses, direction changes via email, push, sound, popup) Multi timeframe ability Color customization (at levels, crosses, direction changes) Linear interpolation and histogram mode options Works on strategy tester in multi timeframe mode (at weekend without ticks also) Adjustable Levels Parameters:
CCI Timeframe: You can set the current or a higher timeframes for CCI . CCI Bar Shift: you can set
FREE

This indicator displays the current SWAP values (for both buy and sell positions) of individual trading instruments directly in the chart.
It allows traders to quickly identify which symbols have positive or negative swaps, helping them make better decisions when choosing positions that may be more advantageous for long-term holding. ️ Indicator Settings Selection of Displayed Symbols The user can choose which instruments are displayed in the table:
• only currency pairs,
• all symbols from the
FREE

该指标的想法是以蜡烛的形式绘制 RSI,可以与价格图表进行比较以生成买入和卖出信号。该指标不是我的发明。几年前我在互联网上创立了它。我更新了代码,添加了警报功能,添加了 Bermaui Utilities 工具组。
该指标计算用于绘制烛台的所有价格的 RSI(开盘价、最高价、最低价和收盘价的 RSI)。它使用它们中最高的来绘制高灯芯的 RSI 蜡烛,使用它们中最低的来绘制低灯芯的 RSI 蜡烛。 RSI 蜡烛的主体位于高点和低点之间。如果开盘的 RSI 低于收盘的 RSI,则认为 RSI 蜡烛看涨。如果开盘的 RSI 高于收盘的 RSI,则 RSI 蜡烛被视为看跌。
如何使用它
您可以在 RSI 蜡烛指标上交易趋势线突破,这将引领价格图表上的趋势,因为动量引领价格。 您可以在 RSI 蜡烛指标上绘制任何形式的经典图表模式,并像使用原始 RSI 一样进行交易。 它可以用作经典的 RSI。如果它穿过超买 (70%),则卖出,如果它穿过超卖 (30%),则买入。 您可以使用 RSI 蜡烛图和价格图表之间的背离来确认您的交易信号。 RSI 蜡烛特点
它不会重新绘制或重新计算其结果。 它适用于加

Price Action Dashboard Pro - Professional Market Structure & Price Action for MT4 Concept: Ending the Search for the "Holy Grail" Many traders find themselves lost in a labyrinth of complex algorithms, eventually losing sight of the only truth that matters: "Price is King." Price Action Dashboard Pro is designed to lead you out of the endless cycle of searching for a "magic indicator" and bring you back to the core principles of the market— Dow Theory and Price Action . This is not a temporar

this indicator Construction on Gann angles and it,s very effective .you can use it as (Support and resistance)
it,s very successful and easy to use.if candle Cross through level thats mean price is going ti next level
but with on condition. The price cames from a previous level
There is a variable of angles for frames the best is 1h frame and stander variable.........
FREE
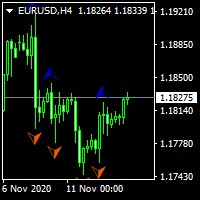
...................................................custom fractal............................................... .................................fractal is very help full to find waves and ............................... ...the defult fractal at meta trader dosent have input parameters and cant find any waves.. .............................................this is fractal with input......................................... ................................................for find any waves.......
FREE
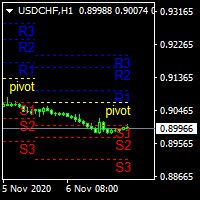
.................................if you need pivot point s levels............................... ............................this is a weekly pivot point level creator........................... ...it is for weekly pivots and show levels at times period d1 , H4 , H1 , M30 ............... .................................also shows levels for 3 last weeks.............................. ................can use it with other indicators and see important levels........
FREE

This indicator provides trading signals based on the polarity of the dynamical parameters of two digital signals. The dynamical parameters (momentum-acceleration) are derived by applying a high quality momentum oscillator, MTEMA LPD ( see Top Gun Oscillators ) to two digital signals. The MTEMA momentum oscillator is first applied to the price itself. Then, a rectification procedure is applied to the price based on the signals from the momentum oscillator yielding a rectified price signal. This s
FREE

Traders Dynamic Index (TDI) Signal Input parameters: signal mode: set it to true if you want to plug it into STAT (Signal Tester and Trader) arrow shift: distance between fast EMA line to arrow on chart middle band filter price line filter RSI period RSI price method Volatility period MA period 1 MA period 2 Averaging method You can find the best setting for 4 hour EURUSD on this video
FREE
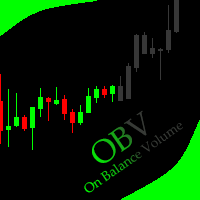
This indicator allows to hide OBV (on all MT4 timeframes) from a date define by the user with a vertical line (Alone) or a panel (with "Hidden Candles"). Indicator Inputs: Apply To Information on "On Balance Volume" indicator is available here: https://www.metatrader4.com/en/trading-platform/help/analytics/tech_indicators/on_balance_volume ************************************************************* Hey traders!! Give me your feeds! We are a community here and we have the same objective....
FREE

Cross Trend Lines indicator trend indicator of find. This indicator, an array of works by using a series of indicator and algorithm. Uses two lines to find trends. The intersection of this line means that the start of the trend. These lines are green, tend to rise. Red lines indicate the downward trend. Use of this indicator is easy to understand. This indicator on its own or you can use other indicators that are appropriate for the strategy.
Suggestions and Features Starts a new trend at the
FREE
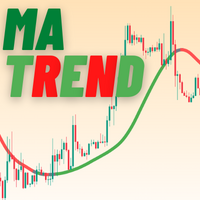
MATrend indicator makes the directional trend of the current market easily recognizable. Settings: MA Period : The amount of candles taken into consideration for the calculation of the moving average; MA Method : The method used for the calculation of the moving average. Selectable methods are: Simple averaging;
Exponential averaging;
Smoothed averaging;
Linear-weighed averaging; Usage: The color of the indcator will change based on the slope of the MA. Green : The indicator has a bullish sl
FREE

Bollinger Bands Alert Indicator – Your Edge in Volatile Markets! Free Gift from me, The Bollinger Bands Alert Indicator is a powerful tool designed to help traders spot potential breakout and reversal opportunities with precision. It monitors price action in real-time and alerts you when price crosses above or below the Bollinger Bands, making it ideal for volatility-based strategies, trend trading, or counter-trend setups. Whether you're a scalper, day trader, or swing trader — this indicato
FREE

MACD仪表盘面板 该指标可帮助您扫描Market Watch窗口中的交易品种并根据MACD过滤趋势。
移动平均线趋同散度(MACD)是一种趋势跟踪动量指标,它显示了证券价格的两个移动平均线之间的关系。通过从12个周期EMA减去26个周期的指数移动平均线(EMA)来计算MACD。
该计算的结果是MACD行。然后在MACD线上方绘制MACD的为期9天的EMA,称为“信号线”,它可以触发买入和卖出信号。当MACD越过信号线上方时,交易者可以买入该证券;当MACD越过信号线下方时,交易者可以卖出或做空该证券。移动平均趋同散度(MACD)指标可以用几种方法来解释,但更常见的方法是交叉,散度和快速上升/下降。
它显示了单个窗口中每个时间帧的MACD趋势。您也可以通过单击值来打开图表
FREE

(谷歌翻译) 该指标实现了由 John Welles Wilder Jr. 开发的原始“ Average True Range (ATR) ”,如他的书中所述—— New Concepts In Technical Trading Systems [1978] 。 它使用 Wilder 移动平均线 ,也称为 平滑移动平均线 (SMMA) ,而不是 简单移动平均线 (SMA) 用于 MetaTrader 的 内置 ATR 指标。 根据他书中的描述,应用的默认周期为 7,而不是 14。 (谷歌翻譯) 該指標實現了由 John Welles Wilder Jr. 開發的原始“ Average True Range (ATR) ”,如他的書中所述—— New Concepts In Technical Trading Systems [1978] 。 它使用 Wilder 移動平均線 ,也稱為 平滑移動平均線 (SMMA) ,而不是 簡單移動平均線 (SMA) 用於 MetaTrader 的 內置 ATR 指標。 根據他書中的描述,應用的默認週期為 7,而不是 14。 (Original te
FREE

Downloads missing data for all currency pairs available in market watch. Very useful for backtesting EAs and strategies and downloading all history at once instead of individually. This products downloads data for the Ultimate Sniper Dashboard and can work with any other products. The indicator will run until all the historical data for the selected currency pairs have been downloaded. The indicator has multiple options: 1. Download data for single pair 2. Download for current pair only 3. Downl
FREE

Ultimate Super Rejection Zones is a powerful MT4 indicator designed to detect accurate intraday reversal points using a combination of: Previous Day High & Low Midline equilibrium zone Rejection candle patterns Double-layer confirmation using two Stochastic filters Smart alert and arrow system Daily auto-reset filtering Optional trend filter using Moving Averages The indicator helps traders find high-probability reversal entries at premium and discount zones.
It automatically marks: ️ Sell Reje

This indicator is designed to detect the best divergences between price/MACD and price/RSI. MACD and RSI produce by far the best divergence signals therefore this indicator focus on those two divergences. This is the FREE version of the indicator: https://www.mql5.com/en/market/product/28375
Important Information How you can maximize the potential of the scanner, please read here: www.mql5.com/en/blogs/post/718074
The free version works only on EURUSD and GBPUSD! This indicator scans for you u
FREE

The Four Pillars: Your All-in-One Trading Powerhouse! Tired of juggling multiple indicators and missing out on perfect entries? The Four Pillars is the ultimate solution, merging four proven market analysis tools into one powerful, easy-to-use indicator. Get crystal-clear, high-conviction Buy and Sell signals directly on your chart, filtered for maximum accuracy. Stop guessing and start trading with confidence! Key Advantages & Features Precision Signals, Zero Clutter: This indicator combines t
FREE

Highly configurable Balance of Power (BOP) indicator.
Features: Highly customizable alert functions (at levels, crosses, direction changes via email, push, sound, popup) Multi timeframe ability Color customization (at levels, crosses, direction changes) Linear interpolation and histogram mode options Works on strategy tester in multi timeframe mode (at weekend without ticks also) Adjustable Levels Parameters:
BOP Timeframe: You can set the lower/higher timeframes for Balance of Power . BOP
FREE

Indicator showing the breakout after at least X candles of the same sign, followed by an opposite candle. PARAMETERS: BARS TO SHOW = Story of Indicators (0 = all bars) Consecutive Bars for Breakout = How many Bars of the same direction and after a Bar with opposite direction Minimu Point between H/L = To consider a bar valid, she must have a Minimun Hi/Lw value Minimu Point between O/C = To consider a bar valid, she must have a Minimun Open/Close value Graphics are self-explanatory
FREE

Идея индикатора очень проста и скорее всего пригодится тем, кто используют линейный график для технического анализа. Что-бы устранить "неровности" (-: линейного графика и был написан этот индикатор. Линия графика соединяет цены закрытия свечей, как и в классическом линейном графике, но игнорирует цены, которые шли в направлении линии и новый экстремум возникает только тогда, когда цена закрытия последней свечи явно ниже или выше предыдущего значения. Это облегчает визуальное восприятие при поиск
FREE

Introducing the Super Pivot and Fibo Indicator: Your Ultimate Trading Companion Are you ready to take your trading to the next level? The Super Pivot and Fibo Indicator is here to revolutionize your trading strategy. This powerful tool combines key elements such as pivot points, Fibonacci retracement and extension levels, high-low values, and Camarilla points to provide you with a comprehensive and accurate analysis of the market. Key Features: Pivot Points: Our indicator calculates daily, weekl
FREE

The indicator displays on a chart trading results. You can configure the color and font of displayed results, as well as filter trades based on the magic number. If multiple trades were closed within one bar of the current timeframe, the result is summed and output in one value.
Utility parameters Plot profit in - the format of output results: wither in deposit currency taking onto account commission and swap, or in points. Start from - start processing data at the specified time. Plot last dea
FREE

Wavetrend Oscillator Indicator — Version 1.0 The Wavetrend Oscillator is a momentum-based technical analysis tool. It is designed to highlight potential momentum shifts, areas that may be overbought or oversold, and the prevailing bias when confirmed by a higher timeframe filter. How it works WT1 and WT2 Lines : Crossovers between these lines are used to indicate changes in momentum. WT1 crossing above WT2 suggests bullish conditions. WT1 crossing below WT2 suggests bearish conditions. WT3 High
FREE

The Stochastic RSI (StochRSI) is a technical indicator that combines the characteristics of the Relative Strength Index (RSI) with the Stochastic Oscillator, resulting in a more sensitive tool that generates a higher number of trading signals. Developed by Tushar Chande and Stanley Kroll, the indicator was designed to overcome a perceived limitation of the traditional RSI: the low frequency of overbought and oversold levels activation (commonly 80 and 20), especially in less volatile assets. How
FREE
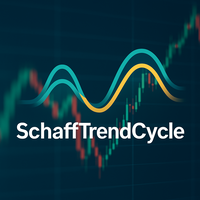
什麼是 Schaff Trend Cycle? Schaff Trend Cycle(STC)是一種振盪指標,用於及時捕捉市場趨勢的反轉。與傳統指標如移動平均線或MACD相比,STC 結合了循環週期與動能,可更清晰地辨識趨勢的開始與結束。 主要特點 明確的趨勢反轉信號:上升趨勢中週期線上升,下降趨勢中週期線下降。 在震盪行情中降低噪音:基於循環的平滑處理有助於過濾短期波動。 參數靈活可調:可通過調整週期與平滑參數來適配不同交易風格。 計算邏輯概覽 動能計算
根據設定週期內的價格變化,計算短期與長期動能。 循環平滑處理
對動能進行雙重平滑處理,提取循環成分。 標準化
將結果標準化到0至100之間,以振盪圖形式顯示。 信號產生
當指標線突破25或75時,產生買入/賣出信號。 輸入參數 CyclePeriods – 動能計算的週期。預設值:10 FastMA – 短期平滑移動平均。預設值:3 SlowMA – 長期平滑移動平均。預設值:3 OverboughtLevel – 超買區閾值。預設值:75 OversoldLevel – 超賣區閾值。預設值:25 如何安裝此指標 在 MQL
FREE

This indicator will show week and monthhigh low, very useful to understand the market sentiment. To trade within the range/ break out. Low- can act as support- can used for pull back or break out High- can act as resistance- can used for pull back or break out Breakout strategy refers to the day trading technique that provides traders with multiple opportunities to go either long or short . The main idea is to identify the trend in its most juicy state followed by a trending move.
FREE
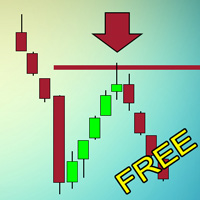
Индикатор, который ищет качественные точки входа в рынок и отображает их в виде стрелок. Действует по сложному алгоритму. Сначала ищет на графике специальные уровни, которые обязательно должны быть пробиты импульсом. Если цена возвращается к этому уровню в виде свечи с длинной тенью и маленьким телом и касается уровня только тенью - возникает точка входа. Не перерисовывается! Лучше всего выглядит и отрабатывает на Н1.
Может использоваться как: Индикатор уровней, где цена будет останавливат
FREE

Volatility under control. The indicator shows the optimal depth for setting goals within the day and on the average trend. It also builds pivot zones for the estimated correction depth. As an accompaniment, the key levels of the structure are displayed for several timeframes. Classical volatility indicators ATR & ADX on fixed timeframes are used for calculation. The calculation takes into account the spread, and if the market is slightly volatile, you will see a warning about the risk. You can c
FREE

The Scaled Awesome Oscillator (SAO) represents a refined adaptation of the Awesome Oscillator, aimed at establishing consistent benchmarks for identifying market edges. Unlike the standard Awesome Oscillator, which records the variation in pips across different commodities, the only unchanging reference point is the zero line. This limitation hampers investors and traders from pinpointing specific levels for trend reversals or continuations using the traditional Awesome Indicator, a creation of
FREE

This indicator helps you to scan symbols which are in the Market Watch window and filter out a trend according to RSI.
The relative strength index (RSI) is a technical indicator used in the analysis of financial markets. It is intended to chart the current and historical strength or weakness of a stock or market based on the closing prices of a recent trading period. The indicator should not be confused with relative strength. The RSI is classified as a momentum oscillator, measuring the veloci
FREE

5/35 Oscillator to be used with our Elliott Wave Indicator as part of the overall strategy on trading the 5th wave. The Elliott Wave Indicator Suite is designed around a simple but effective Swing Trading Strategy. The Indicator Suite is great for Stocks, Futures and Forex trading on multiple timeframes You can find the main Elliott Wave Indicator here https://www.mql5.com/en/market/product/44034
FREE

This is a tool to measure the velocity of the price. It's completely free, you can download and use. "Way: distance of price after one tick." "Speed: price velocity after one tick." p/s: The time for the price to jump 1 tick will not be fixed, you should know this. If Way > 0, the indicator will change color to Green If Way < 0, the indicator will change color to Red || I am a 3D artist and I love math and programming! ||
FREE

Its primary motive is to overlay horizontal lines spaced according to multiples of the Average True Range (ATR), centered on a reference price from defined periods such as trading sessions, candlestick counts, or 12-hour intervals. This facilitates the identification of potential support and resistance levels or expected price ranges. Additionally, it marks major forex trading sessions (Sydney, Tokyo, London, and New York) with arrows to provide contextual awareness of market hours, enhancing d
FREE

This creative simple indicator will provide a precise framework for market sentiment within technical analysis of different timeframes. For instance, for traders like me that uses "Mark Fisher" strategy regularly, this is a perfect indicator for having an insight to markets from short term to long term point of view, using Break points of candles' lows and highs and perfect to combine with "Price Action" . For more options and modifications you can also edit the low timeframe candles withi
FREE

Super Channels indicator is a channel indicator created by calculating support and resistance levels. It calculates by taking the average of support and resistance levels. After determining the number of candles, it takes the levels of the number of candles and creates an autonomous channel according to these levels. If you want to calculate how many candles, you must enter the number in the parameter section. Also, there are two types of modes in the indicator. The first is to calculate based o
FREE

Supertrend Moving Average A combination of Supertrend and Moving Average to create a converging trade setup Input parameters: signal mode: set it to true if you want to plug it into STAT (Signal Tester and Trader) arrow shift: distance between fast EMA line to arrow on chart turn on price line filter turn on moving average signal for converging setup k period d period s period averaging method Moving average period Averaging method upper level limit (Stochastic) lower level limit (Stochastic)
FREE

About Waddah Multimeter (free):
This product is based on the WAExplosion Indicator. It helps identify explosive market trends and potential trading opportunities. Check out the detailed product post here for scanner and multimeter both: https://www.mql5.com/en/blogs/post/758020
Please note that scanner is paid and multimeter is free.
Features: Waddah Trend Direction Trend Strength (above/below explosion line or deadzone) Trend Explosion Alert Alignment alerts Multi-timeframe Custom currency Mu
FREE

Sweep Trend 指标在图表上以矩形的形式根据指定的设置标记价格变动的波动部分。
设置说明 TrendPips - 过滤点值 TrendBars - 以柱数为单位的过滤值 signal_shift - 相对于当前柱向后移动指定数量的周期,对于信号 CountBars - 显示指标的柱数 Color_1 - 交替矩形的颜色之一 Color_2 - 矩形的第二种颜色 警报 - 显示包含用户数据的对话框。 文本 - 信号的自定义文本。 Send_Mail - 将电子邮件发送到“邮件”选项卡上的设置窗口中指定的地址。 主题 - 电子邮件标题。 Send_Notification - 向移动终端发送通知,其 MetaQuotes ID 在“通知”选项卡的设置窗口中指定。 对于开发者:该 指标有一个信号缓冲区,其值在显示矩形形成后等于1,其他情况下等于0。该指标的调用方式如下: double indicator_signals = iCustom( Symbol(), 0, "Sweep Trend",TrendPips,TrendBars,signal_shift, 0, 1); 建
FREE
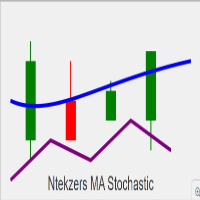
Please remember to leave a review for improvements thank you Overview of Key Functionalities: Buy Signal Conditions : The Stochastic Oscillator's main line crosses above the signal line. The closing price of the current candle is higher than the previous candle's close. The current closing price is above the EMA (Exponential Moving Average). The Stochastic value is below 50. When these conditions are met, a buy arrow is plotted, and alerts (audible or push notifications) are triggered. Sell Sign
FREE

This channel is based on the Hodrick-Prescott filter, which is a type of zero-lag digital filter. First, filtered Close price values are calculated. Then, a second filtering with a longer period is applied. This results in two arrays: HP and HPSlow. In the next step, the standard deviation of HP relative to HPSlow is computed, and a channel is constructed. The VHP channel PRT indicator displays the average spread value and the channel width relative to HPSlow (expressed as a percentage) at th
FREE

This indicator determine price volatility using correlation between Price and Time. WARNING: Not suitable for 1M timeframe, you would not see any lines in this frame!
How to Use:
More closer the indicator's value to 0, the price is considered more volatile. When reversal is started, the indicator's value would be rise or fall significantly. During a strong trend, the indicator's value would be closer to 1 or -1, depends on current trend. Entry Signal:
BUY SIGNAL: Indicator crosses 0.2 from bel
FREE

BillWill 该指标基于取自书中的材料:Bill Williams。交易混乱。最大化利润的专家技术。 每个柱形顶部的指标读数是根据开盘价和收盘价相对于柱形三分之一处的位置计算的。小节分为三个部分,小节的下三分之一是三号 (3),小节的中间三分之一是二号 (2),小节的上三分之一是一号 (1)。指标读数中的第一个数字是开盘价相对于柱的三分之一的位置,第二个数字是收盘价相对于柱的三分之一的位置。 每个柱形底部的指标读数计算为柱形中间相对于前一个柱形极值的位置。
指标读数定义 1-1 开盘价和收盘价位于柱线的上三分之一 2-2 开盘价和收盘价位于柱线的中间三分之一 3-3 开盘价和收盘价位于柱线的下三分之一 3-1 开盘价在柱的下三分之一处,收盘价在柱的上三分之一处 2-1 开盘价在柱的中间三分之一,收盘价在柱的上三分之一 3-2 开盘价在柱线的下三分之一处,收盘价在柱线的中间三分之一处 1-3 开盘价在柱的上三分之一,收盘价在柱的下三分之一 2-3 开盘价在柱的中间三分之一,收盘价在柱的下三分之一 1-2 开盘价在柱的上三分之一,收盘价在柱的中间三分之一 “+”(加号)标记中间高
FREE

TrendFinder VolumeI are Colored candlesticks showing the trend based on Volume and Slope of Trend
This indicator will give you the color change on the next bar on the confirmation candle and will never repaint Lime Green = Possible Buy (Volume up), Teal Green = Bullish Weak (Volume Decreasing), Red = Possible Sell (Volume up) , Orange = Bearish Weak (Volume Decreasing)
TrendFinder Volume is optimize to trade on any market and to be used trending and None trending markets. For best results use
FREE
Highly configurable Osma indicator.
Features: Highly customizable alert functions (at levels, crosses, direction changes via email, push, sound, popup) Multi timeframe ability Color customization (at levels, crosses, direction changes) Linear interpolation and histogram mode options Works on strategy tester in multi timeframe mode (at weekend without ticks also) Adjustable Levels Parameters:
Osma Timeframe: You can set the lower/higher timeframes for Osma. Osma Bar Shift: Y ou can set th
FREE
This indicator is free and shows you the trading volume on all timeframes. You can manage your open positions by time and volume by drawing a moving average based on the desired period, as well as adding multiple levels with a better understanding of the trading volume change.
But to fully use this indicator, you can visit the Utilities section of MQL5.com and download the "Forex Time Zones " Expert Advisor.
These two tools complement each other and help you make much better time management deci
FREE

YOU CAN NOW DOWNLOAD FREE VERSIONS OF OUR PAID INDICATORS . IT'S OUR WAY OF GIVING BACK TO THE COMMUNITY ! >>> GO HERE TO DOWNLOAD
V1 Scalper is an easy to use tool designed for trend scalping. It tries to spot good entry points in a major trend by using swing high and lows formed along the trend . This tool can be used on Fx Pairs , Indices , Commodities and stocks. Not often but in some signals , the arrow might repaint on the current candle so extra confirmation tools are advised for tr
FREE

Dynamic MA Trend Zone – Dynamic Moving Average Trend Zone
The Dynamic MA Trend Zone is a visually compelling indicator that dynamically tracks changes in market trends. By displaying moving averages on three different price levels (close, high, and low), it creates a color-coded trend zone that clearly indicates the trend’s direction and strength.
Features and Functions:
- Trend Direction Color Coding: The indicator automatically color-codes the trend zones based on whether the candle’s clos
FREE
MetaTrader市场提供了一个方便,安全的购买MetaTrader平台应用程序的场所。直接从您的程序端免费下载EA交易和指标的试用版在测试策略中进行测试。
在不同模式下测试应用程序来监视性能和为您想要使用MQL5.community支付系统的产品进行付款。
您错过了交易机会:
- 免费交易应用程序
- 8,000+信号可供复制
- 探索金融市场的经济新闻
注册
登录