 MetaTrader 5
 专家
专家
 指标
指标
 程序库
程序库
 实用工具
实用工具
 窗口小部件
窗口小部件
 规则
规则
适用于MetaTrader 4的技术指标 - 2
 下面列出的技术指标信号对MetaTrader 4平台的开仓交易和平仓交易起着至关重要的作用。
指标的本质就是一种交易品种的数学转换,旨在预测价格变化。
下面列出的技术指标信号对MetaTrader 4平台的开仓交易和平仓交易起着至关重要的作用。
指标的本质就是一种交易品种的数学转换,旨在预测价格变化。 
Dynamic Forex28 Navigator - 下一代外汇交易工具。 当前 49% 折扣。
Dynamic Forex28 Navigator 是我们长期流行的指标的演变,将三种功能合二为一: 高级货币强度 28 指标 (695 条评论)+ 高级货币 IMPULSE 带警报 (520 条评论)+ CS28 组合信号(奖励)。
有关指标的详细信息 https://www.mql5.com/en/blogs/post/758844
下一代强度指标提供什么? 您喜欢的原始指标的一切,现在通过新功能和更高的精度进行了增强。
主要特点: 专有货币强度公式。 所有时间范围内的平滑和准确的强度线。 非常适合识别趋势和精确进入。
动态市场斐波那契水平(市场斐波那契)。 此指标独有的独特功能。 斐波那契应用于货币强度,而不是价格图表。 适应实时市场活动以获得准确的反转区域。
实时市场动量。 第 9 行显示市场是活跃还是被动。 对于定时交易至关重要。
全面的警报和显示。 每种货币最强的买入和卖出动量。 28 对的双重动量买入和卖出。 超买/超卖警告外部范围和止损。 反转

一分钟黄金 是一种基于成交量-价格行为-趋势过滤的箭头入场信号,帮助交易者站在市场正确的一边并创造机会。 为什么选择一分钟黄金? TP-SL。 内置的止盈止损对象会随着信号显示在图表上,交易者可根据提示设置 TP 和 SL。逻辑包括两种方式:ATR 止盈止损和固定点止盈止损。 统计面板。 信息面板显示在设定历史周期内的胜负统计,展示当前胜率,并提供过去连胜/连败次数以及净利润。 高度可调。 默认设置已优化,但仍有几乎无限的周期和组合可供探索。指标基于 5 条交易规则,每条规则都有独立参数,影响信号质量与胜率。 不重绘。 与一些指标不同,我们的指标绝不重绘,箭头和功能始终保持真实可靠! ---------------------
FREE

All-in-One Trade Indicator (AOTI) 可自动计算 14 个货币对的每日目标价位,并在一个窗口中整合适用于各类交易品种的技术分析工具,包括用于识别趋势的 Double Channel、Price Channel、MA Bands、Climax Bars 检测器、斐波那契水平、支撑和阻力微观水平,以及箭头反转信号。适用于 MetaTrader 4 平台。 每日价位计算适用于 EURUSD、EURJPY、GBPUSD、USDCHF、EURGBP、EURCAD、EURAUD、AUDJPY、GBPAUD、GBPCAD、GBPCHF、GBPJPY、AUDUSD 和 USDJPY。所有其他模块均可用于任何交易品种。 购买后,请直接联系我以获取免费的 AOTI-EA-Assistant。这是一款辅助型 Expert Advisor(EA),可根据 AOTI 每日价位并按照 Simplest Level Strategy 自动开仓和管理已开仓头寸。该 Assistant 仅适用于指标可计算每日价位的货币对。 有关安装、GMT Offset 设置、加载所需历史数据以及使用指标

Super Signal – Skyblade Edition 專業級無重繪 / 無延遲趨勢信號系統,擁有卓越勝率 | 適用於 MT4 / MT5 在較低的時間週期上效果最佳,例如 1 分鐘、5 分鐘與 15 分鐘圖表。
核心特色: Super Signal – Skyblade Edition 是一套專為趨勢交易設計的智能信號系統。
其採用多重濾波邏輯,僅篩選出具有明確方向性、動能強勁且波動結構健康的走勢進場點。 本系統 不預測高點或低點 ,只有在同時滿足以下三項條件時才會觸發交易信號: 趨勢方向明確 動能持續增強 波動率結構穩定 此外,系統還結合市場流動性分析,以進一步提升信號的準確性與觸發時機。 信號特性: 所有箭頭信號皆為 100% 無重繪,無延遲 信號一旦出現即固定於圖表,不會閃爍或消失 提供圖表箭頭、資訊面板、彈出通知、聲音提示及推播訊息 支援 EA 呼叫(Buffer 輸出),可整合至自動化交易或信號跟單系統 提供預設參數模板,免調整即可使用,適合新手快速上手
總結: Super Signal – Skyblade Edition 是一款邏輯清晰、穩定高效的專業趨勢型

自动化艾略特波浪理论 (Automated Elliott Wave) 1. 自动数浪并减少主观偏见 (客观性) 通常,艾略特波浪的计数往往带有很强的“主观想象”或个人观点。该指标通过以下方式提供帮助: 寻找推动浪 (Impulse Wave 1-2-3-4-5): 使用严格的规则(例如:第3浪不能是最短的,第4浪不能与第1浪重叠),为您展示理论上正确的价格结构。 寻找调整浪 (Corrective Wave A-B-C): 帮助捕捉价格回调的时机,以便顺势再次入场。 2. 多层次分析 (Multi-Degree Analysis) 该指标不仅仅关注单一时间框架,而是同时分析3个深度的波浪级别,提供3D市场视图: 微浪 (Minor): 用于观察快速波动。 中浪 (Intermediate): 用于观察主要趋势。 主浪 (Primary): 用于观察市场大局。 优点: 您可以根据自己的交易风格开启或关闭每个级别的显示。 3. 寻找价格目标和入场点 (Targeting & Entry) 当系统发现完整的波浪时,它不仅会标记波浪,还会帮助制定交易计划: 斐波那契预测 (Fibonacc

免费获取此指标及 更多指标 ,请点击这里: 将指标转换为交易机器人(无需编程) 特别优惠 : ALL TOOLS ,每款仅 $35 ; 限时优惠 ! 新工具 将是 30 美元 为 第一周 或 前 3 次购买 ! MQL5 上的交易工具频道:加入我的 MQL5 频道以接收最新更新 多时间框架 & 多符号指南: 多时间框架 & 扫描仪用户指南 - 提供 12 种语言版本 请参阅 MT5 版本: Volumatic VIDyA MT5 Multi-Timeframe Scanner 请参阅 MT4 版本: Volumatic VIDyA MT4 Multi-Timeframe Scanner 查看更多产品: 所有产品 或 交易指标、特别优惠 & 新发布 Volumatic VIDyA Multi-Timeframe Scanner 将自适应趋势检测、基于 ATR 的波动带、枢轴流动性水平、定向成交量分析、多时间框架可视化和多交易品种扫描仪结合在一个综合指标中。 该指标的核心是使用 VIDyA - 可变指数动态平均 - 调整其平滑速度以适应当前的市

Liquidity Scalper System is a next-generation professional trading system that combines spectral market structure analysis, the dynamic Liquidity Spectrum liquidity heatmap, and an intelligent market imbalance assessment algorithm. The system continuously analyzes changes in price structure, identifies probable areas of limit and stop order concentration, detects potential liquidity pools, and evaluates the strength of breakout momentum. To achieve maximum accuracy, it additionally uses mul

Crypto_Forex 指标 HTF RSI 适用于 MT4 平台。 ....................................................... - RSI 本身是最佳且最受欢迎的震荡指标之一。HTF 表示 - 更高的时间框架。 - RSI 高于 70 时为超买区域,低于 30 时为超卖区域。 - RSI 提供有关看涨和看跌价格动量的信息。 - 该指标非常适合用于多时间框架交易系统,并可与价格行动入场或与其他指标结合使用。 - HTF RSI 指标允许您将更高时间框架的 RSI 指标附加到当前图表。 - 指标内置移动端和 PC 端警报。 .................................................... 点击这里查看高质量的交易机器人和指标! 这是仅在 MQL5 网站上提供的原创产品。

I have been trading for some time now and always find it a difficulty remembering the timing of the various market opening hours at the other part of the world (especially, when it comes to daylight saving), but could not find any decent indicator online that could help. And it is for this reason that gives birth to this indicator, which I have spent much time, effort and thinking. As many already know that opening of a certain marketplace, depending on which currency pair, has an impact on the

PRO Renko Arrow Based System for trading renko charts. 准确的信号交易任何外汇工具. 另外,我将免费提供系统的附加模块! PRO Renko系统是RENKO图表上高度准确的交易系统。该系统是通用的。 该交易系统可应用于各种交易工具。 该系统有效地中和了所谓的市场噪音,打开了获得准确反转信号的通道。 该指标易于使用,只有一个参数负责产生信号。 您可以很容易地使算法适应您感兴趣的交易工具和renko酒吧的大小。 我很乐意通过提供任何咨询支持来帮助所有客户有效地使用该指标。 祝您交易成功!购买后,立即写信给我! 我将与您分享我的建议和我的renko发电机。 另外,我将免费提供系统的附加模块!

Crystal Volume Profile Auto POC (MT4) — 自动POC成交量剖面指标 概述
Crystal Volume Profile Auto POC 是一款轻量化、性能优化的 MetaTrader 4 指标。它通过可视化成交量分布来帮助交易者识别市场关键价位,并自动标记成交量最大的价格水平 (POC)。该工具揭示了隐藏的支撑/阻力区域、机构交易活动和累积/分配区域。 另有 MT5 版本: Crystal Volume Profile Auto POC (MT5) 。 主要功能 自动POC检测 动态成交量分布 (可见范围或自定义区间) 固定剖面选项用于详细分析 灵活设置直方图大小、颜色和线条样式 每根K线实时更新 内置按钮:Reset VP 和 Hide VP 自动适配浅色/深色主题 为什么使用本指标? 快速识别累积与分配区域 找到高成交量突破/反转区 跟踪机构资金活动 将POC用作精确进出场的参考 提高反转与延续策略的准确性 使用方法 (MT4) 将指标加载到图表 点击 Reset VP 生成剖面 使用 Hide VP 开关显示 拖动垂直线设定分析区间 观
FREE
Non-Repainting Indicator dont; s forget this;s work well stronger trend fast markert lower time frame How to trade with SL Scalping Arrow * this system trend trading system we trade 15M chart using day tp,if you want identify Accumulation Distribution (H4) i am reccomend my SL Currency Strength Meter 28 Pair monthy weekly strenght you can easy filter best rank symbol list weekly monthy * we dont;s trade trend change time waiting trade next day pullback * if you want golden entry find. SL Cur
This indicator is designed to make reviews of many charts on different timescales quicker, and easier to do. Track Time and Price across multiple charts Change Symbol on one chart and all other charts of the same symbol will be changed too. Easy to use, quick to master The indicator allows you to identify the price and time where the mouse pointer is on the current chart, across all other charts open on the same Symbol. This allows you to quickly see information on multiple charts whereas normal

DELTA FUSION PRO 10.0 是一款专为 MetaTrader 设计的专业指标,旨在实时分析订单流 (Order Flow) 和机构压力(Ask/Bid 价差)。 主要特点 智能自动调校:根据市场(外汇、加密货币、股指、大宗商品、股票、期货)、时间框架和波动率 (ATR) 自动进行校准。 核心功能: NetDelta 与累积 Delta:通过 EMA 平滑跟踪方向性压力。 价格/成交量背离:检测常规/隐藏背离(分为 Strong/Medium/Weak 级别),并提供无重绘 (No-Repaint) 信号。 矢量不平衡与注入成交量 (Imbalance & Infusion Volume):识别成交量失衡和异常高压 spike(机构高潮)。 POC 与 Delta 分析图 (Delta Profile):精准定位具有最高激进成交量集中的价格水平。 VWAP Delta:基于激进成交量计算的成交量加权平均价。 交互式面板: UCP:可在图表上直接通过拖放 (drag-and-drop) 方式控制所有功能的开启/关闭。 情绪与多时间框架 (Sentiment & MTF):

MTF Candle Panel displays real multi-timeframe candlesticks in a compact side panel on your chart, allowing you to instantly see price action from higher and lower timeframes without switching charts . Each timeframe is shown in its own row with properly scaled candles, so you get an accurate visual of structure, direction, and momentum at a glance. MT5 Version - https://www.mql5.com/en/market/product/163706/ Join To Learn Market Depth - https://www.mql5.com/en/channels/suvashishfx How it wor

ZBubbles Delta — Professional Volume Indicator for MT4
See volume the way institutions see it. Trade where smart money enters.
ZBubbles Delta is an advanced volume analysis indicator for MetaTrader 4, combining statistical anomaly detection, ADX trend filtering, and built-in binary options statistics with Martingale tracking.
Unlike standard volume histograms, ZBubbles Delta draws dynamic colored bubbles directly on price action, showing where institutional volume entered and how strong the

概述 OrderBlock Zone是一款先进的MetaTrader 4指标,能够自动识别并可视化市场中的机构交易区域(Order Blocks)。通过追踪大型机构(银行、对冲基金)留下的交易痕迹,该指标可确定潜在的支撑位与阻力位。
核心功能 自动订单区块识别 分形分析:通过36周期(可自定义)分形分析确定强劲转折点 牛熊区域:绿色箭头标记上涨订单区块,红色箭头标记下跌订单区块 吞没形态支持:识别吞没蜡烛形态,生成更强信号 可视化工具 自动水平线:为每个订单区块绘制上下边界线 彩色区域:多头(绿色)与空头(红色)区域清晰区分 吞没高亮:用蓝/橙色矩形突出显示吞没形态 简洁界面:网格自动关闭,图表向左滑动以优化显示效果 可自定义参数 分形周期:调整灵敏度(默认:36) 线段长度:设定OrderBlock层级延伸距离 颜色选项:可自定义多头/空头颜色 线条样式:可调整粗细与样式(虚线、实线等) 警报系统(可选) 声音警报 弹出通知 推送通知(移动端) 电子邮件警报 智能区域管理 自动清理:已突破或失效的OrderBlock自动删除 触碰检测:价格触及区域时线条变粗并发出警报 动态
FREE
Good News ! Advanced Currency Meter is more awesome now ! If you have been a fan of the free version of Advanced Currency Meter then I will implore you not to be discourage because you will soon find that the new paid version is worth every dime. Unlike the free version the new paid version of Advanced Currency Meter now has a newly added panel called the “% Daily Range” . Why A Paid Version Now? We believe you like good things and many who has used Advanced Currency Meter over the years will te

BTMM State Engine Pro by G-Labs — Beat The Market Maker indicator for MetaTrader 4. Asian session range, London and New York kill zones, level progression (L1/L2/L3), peak formation detection (PFH/PFL), entry signals, and a multi-pair scanner from one chart.
Stop scanning charts one pair at a time. The State Engine tracks the BTMM daily cycle automatically — Asian box, room boundaries, level blocks, peak formations, and filtered entries — while the scanner dashboard shows level, peak status,

We don’t want to become boring, but the US dollar is the most important currency for all traders, and not just in Forex. Trading without a clear view of the US dollar is like driving in fog. Sooner or later you are going to crash – it’s just a question of when. That’s why at Quantum we have developed two US dollar indices. The first is the Quantum DXY, and the second is the Quantum USDX. So what’s the difference? Well, the reason we created the Quantum USDX is that many Forex traders believe tha

该指标检查不同时期分形的价格结构,以确定市场中可能的反转点,从而为已经具有基本或技术估值模型的仓位交易者提供时机。与它的弟弟 Reversal Fractals不同 ,该指标不会因为所选时期而错过反转,并且会以之字形方式找到反转分形,而忽略那些没有足够动量来引发持续价格波动的反转。 [ 安装指南 | 更新指南 | 故障排除 | 常见问题 | 所有产品 ] 转折点可以开始长期趋势 指示器不重涂
它实现了各种警报 可自定义的颜色和尺寸 该指示符是无功或滞后信号,因为分形是奇数个条形的地层,是中间地带中最高或最低的条形,并且指示符在分形中的所有条形都闭合时绘制。但是,具有预先设定的方向偏差的交易者会发现该指标非常有用,可以提早进入切入点。 该指标既不是下探信号指标,也不是完整的交易系统。请不要这样评价或审查它。
输入参数 最小分形数:分形上的最小条形数。必须为奇数,例如3、5、7、9、11、13,... 最大分形:分形上的最大条形数量。必须为奇数,例如3、5、7、9、11、13 ...
最大历史柱数:指标加载时评估的过去柱数。
颜色:自定义箭头和线条的颜色和大小。 警报:启用或禁用各

Multi-Confluence Reversal Alert | RSI + Heikin Ashi + Divergence + Key Levels | SL/TP Lines | No Repaint Overview Confluence Reversal Alert is a professional-grade reversal detection indicator for MetaTrader 4. It combines five powerful trading concepts into a single, clean alert system — giving you high-probability reversal signals with automatically drawn Entry, Stop Loss, and Take Profit levels directly on your chart. Designed for traders who use VSA (Volume Spread Analysis) , price action ,

True Signal FX 是一款适用于 MetaTrader 4 的多时间框架交易指标,旨在直接在图表上提供完整的交易分析方案。 该指标不仅提供单一的方向信号,还将市场分析、信号确认以及交易水平计算整合到同一个工作界面中。当检测到交易方案时,交易者可以同时看到交易方向、入场价格(Entry)、止损(Stop Loss)和止盈(Take Profit),以及当前信号评分和市场状态信息。 True Signal FX 适用于希望围绕明确交易方案进行决策的交易者,无需针对每一个潜在交易机会手动比较多个技术指标并单独计算交易水平。 True Signal FX 不会自动执行交易。指标负责提供分析结果和交易方案,最终是否开仓以及订单执行由交易者自行决定。 工作原理 True Signal FX 会在多个选定的时间框架上分析市场,并分别计算买入(BUY)和卖出(SELL)评分。 默认配置使用 M5、M15、M30、H1 和 H4,最多可以同时配置 5 个分析时间框架。 此外,指标使用独立的触发时间框架(Trigger Timeframe)来确定新的交易方案何时满足激活条件。默认触发时间框架为

Arrow Micro Scalper 是一款专为剥头皮和短期交易而设计的指标,可集成到任何图表和金融工具(货币、加密货币、股票、金属)中。
在她的工作中,她使用波浪分析和趋势方向过滤器。建议在从 M1 到 H4 的时间范围内使用。
如何使用指标。
该指标包含 2 个用于更改设置的外部参数,其余参数已默认配置。 大箭头表示趋势方向的变化,蓝色箭头表示下降趋势的开始,粉红色箭头表示上升趋势的开始。 “ Only trending direction ”参数启用和禁用使用内部趋势的模式,提供使用您自己的趋势或不使用趋势的机会,并且还启用/禁用仅根据趋势显示趋势箭头和信号箭头。 小信号箭头,该指标最重要的对象,粉色代表“买入”交易,蓝色代表“卖出”交易。 “ Smoothing ”参数决定信号箭头出现的时间,操作范围为 7 到 25,为时间范围 M1-M5 选择大值,为 M15-H1 选择中值,为 H4 - D1 选择小值。 趋势箭头和开始信号箭头有警报。 指标不会重新绘制。

The elite (V3) multi-indicator suite from JoaquinTrading specifically geared towards Forex & binary options, including regulated exchanges such Nadex, Cantor Exchange, and other binary option brokers.
The Probability Tool Suite Elite will provide the given win/loss outcome probabilities of up to 10 strike levels, a specific expiration duration, based on a combination of up to 16 indicators, rules, or conditions and derivative behavior (i.e. expiry, touch, touch & retrace). Using this indicato

Elliott Wave Trend was designed for the scientific wave counting. This tool focuses to get rid of the vagueness of the classic Elliott Wave Counting using the guideline from the template and pattern approach. In doing so, firstly Elliott Wave Trend offers the template for your wave counting. Secondly, it offers Wave Structural Score to assist to identify accurate wave formation. It offers both impulse wave Structural Score and corrective wave Structure Score. Structural Score is the rating to sh
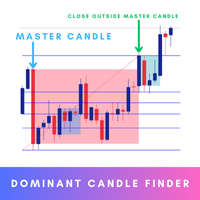
Dominant Candle Finder is a significant candlestick on a price chart that stands out due to its size, volume, or price movement compared to surrounding candles. It often indicates strong buying or selling pressure and can be used to identify potential reversal points, breakouts, or continuations in the market. Dominant candles can serve as key indicators for traders to make informed decisions, providing insights into market sentiment and potential future price movements. MT5 Version - https:

Auto Chart Patterns This indicator is comprehensively designed to elevate technical chart analysis, making it systematic and highly accurate. It offers the following outstanding advantages: Automated Pattern Recognition: It can comprehensively detect key classic chart patterns, including Channels, Wedges, and Triangles. This saves time spent on manual drawing and is highly beneficial for finding trend-following breakout entries, especially in highly volatile and fast-moving markets or assets. Mu
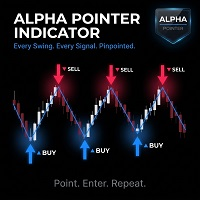
Alpha Pointer 指标是一款适用于 MetaTrader 4 的非重绘自适应趋势指标。它将基于动量的 CCI 选择器与价格上下方的 ATR 偏移通道相结合,生成一条单一趋势线:在多头阶段只向上台阶式推进,在空头阶段只向下台阶式推进。当锁定方向为上涨时,这条线为薄荷绿色,当方向为下跌时则为红色,从而可以立即直观地识别当前主导趋势。方向变化会通过在可配置回溯窗口内的摆动极值处绘制向上或向下箭头加以标记,并通过一个由 3 种事件和 4 个通道组成的警报系统,使该指标开箱即用、可直接用于交易。 查看 MT4 版本链接: Alpha Pointer MT5 查看更多产品: 所有产 品 想查看实盘示例和新工具,请访问我的个人主页并发送好友请求,以免错过更新!
工作原理 Trend Magic 引擎 在每一根确认收盘的 K 线上,指标会先计算真实波幅(True Range),然后对 TR 按 ATR 周期(默认:5)做简单移动平均,以得到自适应距离,并据此构建两条候选通道:上轨为 High + ATR × 系数,下轨为 Low − ATR × 系数。所选价格源(默认:收盘价,周期
FREE

Volume Footprint Analysis is a precision-engineered, volume-based indicator that transforms raw market volume into an intuitive, color-coded signal system. Built on concepts from Volume Spread Analysis (VSA) and Smart Money principles, this tool removes the guesswork from volume interpretation and gives traders clear, actionable insights on when to buy or sell — on any timeframe and across any trading instrument. MT5 Version - https://www.mql5.com/en/market/product/138565/ Join To Learn Mark

Miraculous 指标 – 100% 不重绘的外汇和二元期权工具,基于江恩九方图 这个视频介绍的 Miraculous 指标 是一款专为外汇和二元期权交易者开发的高精度、强大交易工具。该指标的独特之处在于它建立在传奇的 江恩九方图 和 江恩振动法则 之上,使其成为现代交易中可用的最精确预测工具之一。 Miraculous 指标 完全不重绘 ,这意味着它的信号在 K 线收盘后不会改变或消失——你看到的就是你得到的。这为交易者提供了可靠且一致的基础,让他们能够自信地进出场交易。 主要特点: 基于江恩九方图和江恩理论构建 100% 不重绘的信号系统 适用于所有时间周期(M1、M5、H1、H4、日线、周线) 适用于外汇和二元期权交易 清晰的买卖信号,准确率高 可用于剥头皮、日内交易或波段交易 兼容大多数 MT4 平台 这款工具旨在帮助初学者和专业交易者做出更好、更明智的决策。无论您是交易货币、指数还是二元期权,Miraculous 指标都将为您在市场中提供所需的优势。

Change In State Delivery (CISD) Indicator - ICT Concepts 停止猜测市场反转,开始利用价格行为中真正的算法转变进行交易。 Change In State Delivery (CISD) 指标是一款高级图表工具,专为使用 Inner Circle Trader (ICT) 和 Smart Money Concepts (SMC) 的交易者精心设计。 该工具是您精确定位做市商何时将交付方向从买方转向卖方(反之亦然)所需的决定性优势。通过自动化最强大的 ICT 概念之一,该指标完全消除了您图表分析中的情绪、主观性和猜测。 CISD 在 ICT 概念中的力量: 在算法交易理论中,当底层市场算法改变其程序时,就会发生 Change in State Delivery。它不仅仅是标准的支撑或阻力突破;它是主导的机构订单流发生反转的准确时刻。 当特定的反向蜡烛被位移 (displacement) 破坏和突破时,价格交付的状态就会改变。该指标自动识别这些确切的起始蜡烛,绘制高度精确的 CISD 基线,并严格等待真实的实体突破以确认机构的转变。一旦确

"M1 scalping signal" 是为 M1 时间周期设计的抢帽交易指标。该指标在图表上显示箭头,指示价格反转点。红色箭头表示价格反转为卖出位置,而绿色箭头表示价格反转为买入位置。可以在所有货币对上使用。 优点: 无重绘: 指标不会在历史数据上重绘信号,确保分析的稳定性。 易于使用: 它易于配置,并在图表上可视化重要的反转点。 支持各种时间周期: 可以在任何时间周期上使用,从分钟图到日图。 该指标是识别图表上价格反转点的强大工具,使其成为希望提高交易决策准确性的交易者不可或缺的助手。 指标设置: ExtDepth: 分析深度(柱线数)。 ExtDeviation: 确认极值所需的价格偏差。 ExtBackstep: 排除错误信号的回溯步长。

厌倦了绘制支撑线和阻力线? 支撑阻力 是一个多时间指标,可以自动检测并绘制图表中的支撑线和阻力线,并具有非常有趣的变化:随着时间的推移测试价格水平及其重要性的提高,线变得越来越粗。 [ 安装指南 | 更新指南 | 故障排除 | 常见问题 | 所有产品 ] 一夜之间增强您的技术分析 无需浏览图表即可检测重要的价格水平 一目了然地识别所有价格水平的相对优势 每次交易最多可节省半小时的绘图线 指标显示所有价格水平的期限 指示器不重涂 过去和现在的价格水平因接近程度而崩溃,并根据当前的市场行为进行了调整。在动作发生的地方绘制了线条,而不一定在峰值处绘制了线条。 价格水平随着时间的推移而被拒绝,变得越来越暗 定期清除不重要的价格水平以避免噪音 可自定义的时间范围选择和崩溃因子 它实现了电子邮件/声音/推送警报的突破
输入参数 指标设置:指标将从当前时间段读取价格,但您可以选择另一个。例如,您可以在H4图表中显示D1支撑线和阻力线。您还可以使用 价格水平密度 参数选择在图表上显示多少价格水平。
颜色设置:根据重要性输入所需的支撑线和阻力线颜色。
标签设置:(可选)可以在指示器中显示用于

**按照书中所教的方式交易波浪,而不是凭猜测。**
该指标自动读取价格结构,标注艾略特推动浪(1-2-3-4-5)和调整浪(A-B-C),并向您展示 下一浪最可能的走向,以及书中所指出的交易位置。它直接基于 A.J. 弗罗斯特与罗伯特·普莱切特 所著的《艾略特波浪原理——市场行为的关键》,并忠实于原著:四条不可违背的波浪规则被 100% 严格执行,因此不符合艾略特规则的数浪永远不会被绘制。
**您在图表上看到的内容** - **已完成的波浪** —— 完整的推动浪 1-2-3-4-5(以及 A-B-C 调整浪),以清晰的带标签 线段绘制。 - **接下来的预期** —— 下一浪的投影线,指向阴影的 **斐波那契目标区** ,让您始终知道价格 “应该”前往何处。 - **基于书中的交易设置** —— 买入/卖出的 **入场** 、 **止损** 以及两个 **止盈** 价位,并实时 显示 **风险回报比** 。 - **可移动的信息面板** —— 数浪方向、置信度百分比、当前交易设置,以及依据书中给出的 周期与品种适用性自动提示。

Smart Reversal Signal is a professional indicator for the MetaTrader 4 platform; it has been developed by a group of professional traders. This indicator is designed for Forex and binary options trading. By purchasing this indicator, you will receive: Excellent indicator signals. Free product support. Regular updates. Various notification options: alert, push, emails. You can use it on any financial instrument (Forex, CFD, options) and timeframe.
Indicator Parameters Perod - indicator calculat

Apollo SR Master 是一款支撑/阻力指标,其特殊功能使利用支撑/阻力区域进行交易更加便捷可靠。该指标通过检测局部价格顶部和底部,实时计算支撑/阻力区域,没有任何时间延迟。为了确认新形成的支撑/阻力区域,该指标会显示特殊信号,表明该支撑/阻力区域可以作为实际的卖出或买入信号。在这种情况下,支撑/阻力区域的强度会增强,因此从该区域进行交易的成功率也会更高。这正是该指标的核心理念。 SR区域也使止损和止盈的操作更加便捷。根据信号方向,可以将SR区域上方或下方的空间用作止损位。此外,相对的SR区域也可以用作潜在的止盈区域。 我还免费向所有 Apollo SR Master 指标的用户提供我的“Apollo 价格行为系统”指标。这两个指标结合使用将帮助您找到更好的入场点。 购买后请联系我,即可免费获得交易指导和超棒的额外指标!

目前40%的折扣
任何新手或专家交易者的最佳解决方案!
这个指标是一个独特的、高质量的、可负担得起的交易工具,因为我们纳入了一些专有的功能和一个新的公式。只需一个图表,你就可以读出28个外汇对的货币强度!想象一下,你的交易将如何得到改善,因为你的交易是在你的手中进行的。想象一下,你的交易将如何改善,因为你能够准确地确定新趋势或剥头皮机会的触发点?
用户手册:点击这里 https://www.mql5.com/en/blogs/post/697384
这是第一本,原版的! 不要买一个毫无价值的崇拜者的克隆品。
特别的 子窗口中的箭头显示强劲的货币势头GAP将指导你的交易! 当基础货币或报价货币处于超卖/超买区域(外盘斐波那契水平)时,在个人图表的主窗口中出现警告信号。 当货币力量从外围区间回落时,回撤/反转警报。 十字星模式的特别警报
可选择多个时间框架,以快速查看趋势! 货币强度线在所有的时间框架中都非常平稳,当使用较高的时间框架来识别总体趋势,然后使用较短的时间框架来确定精确的入口时,效果非常好。你可以根据自己的意愿选择任何时间框架。每个时间框架都由其自身进行了优化。

SMC Visual Indicator – 像机构资金一样交易 大多数交易者花费数小时分析市场结构、流动性区域、公允价值缺口(FVG)以及潜在反转机会。当分析完成时,市场往往已经发生了主要波动。 SMC Visual Indicator v6 为您完成这一切。 基于先进的 Smart Money Concepts(SMC)和 ICT 交易理念开发,该指标能够自动识别机构资金活动的重要区域。 打开图表,立即看到: Fair Value Gaps(FVG) Break of Structure(BOS) Change of Character(CHoCH) 买方流动性(BSL) 卖方流动性(SSL) AMD 周期(吸筹、操纵、派发) 所有信息以清晰、专业的方式呈现。 不再猜测,真正理解市场 市场并非随机波动。 机构资金需要流动性来执行大额订单,而这些行为会在图表上留下痕迹。 SMC Visual Indicator v6 帮助您在主要行情启动之前发现这些线索。 当大多数交易者依赖滞后指标时,您将能够观察到价格背后的真实市场结构。 智能分析面板 指标实时整合市场信

Heiken Ashi Pro is a more advanced version than the default Heiken Ashi version of Metatrader 4. Features: Automatic change width when zooming ON / OFF button to display candles or not Options for changing colors The Heikin-Ashi technique is used by technical traders to identify a given trend more easily. Because the Heikin-Ashi technique smooths price information over two periods, it makes trends, price patterns, and reversal points easier to spot. Candles on a traditional candlestick chart fre

Reversal Master 帮助你判断当前价格的运行方向,并在图表上找出潜在的反转点。它专为那些在下单前想更清楚地看懂行情的交易者而设计。你可以把它当作独立工具使用,也可以作为现成交易系统的补充,或者作为开发自有策略的基础模块。 为了定位反转点,Reversal Master 会同时评估多个市场条件,因为综合分析比任何单一因素都能给出更完整的画面。指标会分析 Price Action 形态、成交量、品种的平均波动幅度以及超买/超卖水平,然后标出可能正在形成反转的位置。 购买后请直接联系我,我会提供带示例的详细说明,以及在你自己的 EA 中正确调用该指标的方法。 主要功能 自动识别图表上潜在的趋势反转点。 两种内置工作模式:Mode-1(经典算法)和 Mode-2(更新的反转识别算法)。 内置统计:显示历史中每笔仓位的潜在结果(Mode-2 下的 Show Statistic 模式)。 内置过滤器,帮助滤除市场噪音,减少假入场。 信号不重绘:每个信号严格在K线收盘时生成,不会消失,之后也不会重新计算。 可配置信号箭头:多种箭头类型、尺寸,以及独立的 Buy/Sell 颜色。 灵活的提
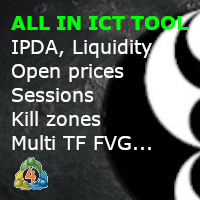
ICT Template Indicator visualizes and automatically updates all important ICT elements for Scalpers, Day and Swing traders. It allows you too keep your chart clean and bring any elements by just one click to the side buttons. Thanks to mobile notifications on external liquidity levels, you will not miss any opportunity and you don't have to sit behind the screens whole day. Each element has fully customizable colours, width, line types, max timeframe to be shown etc... so you can really tweak y

Fibolopes (converted from Envelopes) Indicator is based on the Fibonacci sequence. The input parameter FiboNumPeriod is responsible for the number in the integer sequence (0, 1, 1, 2, 3, 5. 8 13, 34, 55, 89...) The indicator will calculate the Main Yellow dot line and 2 bands as a +/- Deviation to it. This indicator is calculating a ZigZag (Aqua line) which combine with Fibolopes together form a system signals for Open (Z crossing Fibolopes) a new position and Close (Z crossing Fibolopes in oppo

A simple Approach to Elliot waves patterns Signal generated on trend continuation when breaking the "5" level or on corrective direction after 1-5 waves detected 1-5 labeled points arrows used for signal UP/DOWN direction Chaotic patterns in Blue are drawn all times until a 1-5 Elliot wave pattern detected 1-5 Red pattern in Bull Market : UP arrow in BULL trend continuation OR DOWN arrow as a reversal DOWN direction as pattern correction 1-5 Green pattern in Bear Market :DOWN arrow in BEAR tr
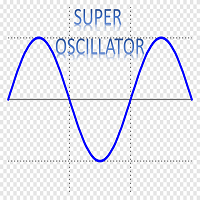
Super Oscillator , is a powerful indicator that vibrates along with the market, resulting in a very useful tool to improve and decide your trading.
You can download the demo and test it yourself.
In a versatile indicator that in a single graph shows us information about four different aspects of the market
1) 4 operational zones. The indicator divides the screen into 4 zones that allows us to properly assess the moment of the market. a) Pullback Buy Trend. If the indicator is above 80, it
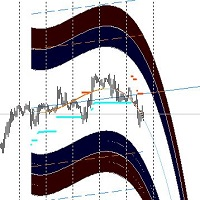
The forex market, like nature, moves in cycles — oscillating between peaks and troughs, bullish runs and bearish retreats. But what if you had a compass to chart these cycles and anticipate every turn? Austin Market Levels Indicator is crafted to be that compass, designed meticulously to decode market cycles and pinpoint profit opportunities.
---
Mastering Market Cycles
The secret to consistent forex trading success often lies in understanding the underlying patterns. Austin Market Le

Structure Pulse SMC Structure Pulse SMC is a multifunctional indicator for MetaTrader 4 that combines market structure, liquidity, trend, and volume analysis in one visual system. It helps traders assess current market conditions faster, identify potential entry points, and plan trade management levels in advance. Instead of using multiple separate indicators and manually drawn lines, Structure Pulse SMC creates a complete market picture directly on the chart: structural direction, key level bre
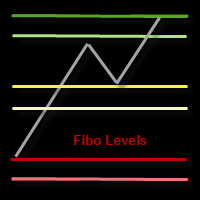
This indicator draws the Fibonacci -38.2, -17, 38.2, 61.8, 117, 138 levels for the last closed H1, H4, Daily, Weekly and Monthly candle.
Features Automatic display of the most important Fibonacci levels.
Parameters TimeFrame: Choose which timeframe you want Fibonacci levels to be based on.
SetLabels: Visible/invisible Fibonacci level labels.
Labels Position : Position of Fibonacci level labels (Right - Left - Middle).
FontSize: Font size of Fibonacci level labels. c38: Color of level 38.2%.

Auto Elliott Engine The Auto Elliott Engine is a tool designed for MetaTrader 4 that automates the identification, decomposition, and projection of price structures based on the Elliott Wave Theory. Powered by a pattern-recognition engine, this indicator processes price action to identify market configurations, translating data into structured scenarios. Key Features Multi-Degree Recognition: Analyzes price action across multiple fractal levels. From higher degrees, such as Supercycle or Cycle,

After your purchase, feel free to contact me for more details on how to receive a bonus indicator called VFI, which pairs perfectly with Easy Breakout for enhanced confluence!
Easy Breakout is a powerful price action trading system built on one of the most popular and widely trusted strategies among traders: the Breakout strategy ! This indicator delivers crystal-clear Buy and Sell signals based on breakouts from key support and resistance zones. Unlike typical breakout indicators, it levera
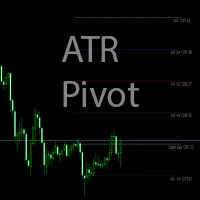
The indicator calculates the levels by ATR daily range using the equations: 1AR = Open + ATR -1AS = Open - ATR AR 1/2 = Open + (ATR / 2) AS -1/2 = Open - (ATR / 2) AR 1/4 = Open + (ATR / 4) AS -1/4 = Open - (ATR / 4) AR 3/4 = Open + ((ATR*3) / 4) AS -3/4 = Open - ((ATR*3) / 4) AR 2 = Open + (ATR*2) AS -2 = Open - (ATR*2) Parameters Period ATR - ATR period
Shift time - shift by time for Open Color opening of day - Open line color
Color 1AR, -1AS - 1AR, -1AS line color
Color AR 1/2, AS -1/2 - AR 1

BlueDigitsFx 官方生态系统入口 获取基础设施更新、交易资源、产品发布信息以及 BlueDigitsFx 官方生态系统访问权限。 Telegram 生态系统
官方网站
MT5 版本 BlueDigitsFx Easy 123 System —— 强大的 MT4 反转与突破识别系统 一体化无重绘交易系统,专为识别市场反转与突破而设计 —— 适合重视市场结构、清晰信号以及确认型交易流程的交易者。 BlueDigitsFx Easy 123 System 是一款可视化 MT4 指标,并带有提醒功能,可帮助交易者轻松识别市场结构变化、突破以及趋势反转。 该指标遵循结构化的“123”交易模型: 步骤 1 :通过大箭头识别潜在衰竭区域中的新高或新低。 步骤 2 :发出市场结构突破信号,确认潜在趋势反转。 步骤 3 :通过小箭头和支撑/阻力点提供入场确认。 注意 :大箭头在K线收盘前可能会重绘,因为它会根据实时市场结构变化进行调整。
小箭头一旦出现后则为 100% 无重绘信号。 功能特点 大箭头:识别强烈的市场结构变化及潜在反转机会。 小箭头:100% 无重绘趋势信号。 支撑与阻力点

成為突破者,隨著價格反轉,市場結構會改變利潤。
訂單突破者指示器可以識別趨勢或價格走勢何時接近枯竭並準備好逆轉。它會提醒您市場結構的變化,通常會在發生逆轉或重大回調時發生。
該指標使用專有計算來確定突破和價格動能。每當在可能的耗盡點附近形成新的高點時,指標就會繪製最後一個生成該高點的順序塊。然後,它將隨價格移動隨價格跟隨定單。然後,當價格轉向相反方向並突破該訂單塊時,它會提醒您,從而創建新的市場結構並開始趨勢或重大回調的可能逆轉。
訂單塊是在創建高/低之前的最後一個相反的彩色蠟燭,並且當價格跌破這些關鍵區域以下時,這表明趨勢可能會發生短期或長期反轉。
特徵 提醒您關鍵耗盡點的市場結構變化 價格接近耗盡水平時自動提取訂單塊 在一個方向繼續移動時,在價格後面跟踪定單,以提醒您最佳的反轉輸入 將顏色更改為純色塊,以顯示何時發生市場結構中斷。 適用於所有交易品種和時間範圍 內置集成的彈出窗口和電子郵件警報 策略和如何與定單破壞者指標進行交易 當斷路器塊發生時,您有兩個選擇。
看左邊!我們正在尋求供應/需求或支撐/阻力位嗎?市場結構轉變(逆轉)通常發生在價格重新測試舊水平或在該支撐或

RFI LEVELS PRO 可识别反转结构以及关键的价格回归区域,这些区域可能出现大型市场参与者的活跃行为。 指标可以帮助您识别新趋势的形成、寻找潜在入场点,并提前控制风险和利润目标。 MT5 版本 — 与 TREND LINES PRO 配合使用时,可充分发挥指标的功能。 指标显示内容: 在新趋势开始阶段激活的反转结构和反转水平。 沿已识别趋势方向的潜在入场点。 可视化的 TAKE PROFIT 和 STOP LOSS 水平。 基础最低风险收益比为 RR 1:2 。 随着行情发展,Stop Loss 可根据智能逻辑进行动态调整。 趋势分析 RFI LEVELS PRO 可以根据以下两个指标的数据生成反转结构: TREND LINES PRO — 用于识别全局趋势反转。 TREND PRO — 用于识别更快速的趋势反转。 SCANNER 扫描器 内置扫描器实时运行,可帮助快速发现当前活跃的交易机会。 多时间周期品种过滤。 搜索当前激活的反转结构。 显示 LOGIC AI 信号触发后的结果。 显示当日信号已产生盈利的交易品种列表 — RB 按钮。 支持交易终端提醒。 支持向移动

现在优惠 30%! 任何新手或专业交易者的最佳解决方案! 该指标是一款独特、高质量、且价格合理的交易工具,因为我们已经整合了许多专有功能和新公式。 依据此更新,您将能够显示双重时间帧区域。 您不仅可以显示一个较高的时间帧,还可以同时显示图表时间帧,加上更高的时间帧:显示嵌套时区。 供需双方所有交易者都会喜欢它。 :)
重要信息披露 高级供需的最大潜力,请访问 https://www.mql5.com/zh/blogs/post/720245 想象您的交易如何得以改善,是因为您能够精准定位入场或目标位吗? 构建于新的底层算法,它可以更轻松地识别出买卖双方之间的潜在失衡。 这是因为它以图形方式展示供需最强劲区域,及其过去的表现(显示旧区域)。 这些功能旨在帮助您更轻松地发现最佳入场区域和价位。 现在您可以针对您的交易品种和时间帧来优化和编辑区域强度! 高级供需指标适用于所有产品和时间帧。 它是一个新的公式,非常新的功能是两个区域强度函数可由用户输入进行调整! 这在交易中是一大优势。 当您学习如何使用专有功能,例如带有价格游离最小 X 因子的区域强度时,您能够判断该区域强劲与否。 供需

Introduction Excessive Momentum Indicator is the momentum indicator to measure the excessive momentum directly from raw price series. Hence, this is an extended price action and pattern trading. Excessive Momentum Indicator was originally developed by Young Ho Seo. This indicator demonstrates the concept of Equilibrium Fractal Wave and Practical Application at the same time. Excessive Momentum detects the market anomaly. Excessive momentum will give us a lot of clue about potential reversal and

本工具属于 ICT / 智能资金工具套件的一部分。它与我的其他 ICT/SMC 指标——时段 Kill Zones 和这款 Market Structure 工具——配合使用效果最佳,两者均提供 MT4 和 MT5 版本。将时段时机与市场结构结合可获得共振入场,欢迎在我的卖家主页查找完整套件。
Market Structure Pro 是一款基于 ICT 方法论的智能资金概念(SMC)指标。它自动识别市场结构和机构价位区域,并提供完整的缓冲区接口供 EA 集成。
市场结构。指标识别内部结构和摆动结构,标记结构突破(BOS)和性质转变(CHoCH),并为每种结构类型提供独立的多头和空头过滤器。它区分强弱高低点,并将等高点和等低点(EQH/EQL)标记为流动性价位。
订单块。内部订单块和摆动订单块会自动追踪缓解情况。提供两种显示模式:当前结构模式会将订单块延伸至被突破为止,固定长度模式则显示设定数量的K线。每个订单块可显示可选中线,并可应用基于 ATR 或区间的波动率过滤器。
公允价值缺口(FVG)。位移过滤器仅标记由高于平均动能的K线所形成的缺口,符合 ICT 对真实失衡的定义
FREE

Presenting one-of-a-kind Gann Indicator for XAUUSD
IQ Gold Gann Levels is a non-repainting, precision tool designed exclusively for XAUUSD intraday trading. It uses W.D. Gann’s square root method to plot real-time support and resistance levels, helping traders spot high-probability entries with confidence and clarity. William Delbert Gann (W.D. Gann) was an exceptional market analyst whose trading technique was based on a complex blend of mathematics, geometry, astrology, and ancient calculation

Introduction to EFW Analytics EFW Analytics was designed to accomplish the statement "We trade because there are regularities in the financial market". EFW Analytics is a set of tools designed to maximize your trading performance by capturing the repeating fractal geometry, known as the fifth regularity in the financial market. The functionality of EFW Analytics consists of three parts. Firstly, Equilibrium Fractal Wave Index is an exploratory tool to support your trading logic to choose which r
Candle Timer Countdown 显示当前柱线关闭并形成新柱线之前的剩余时间。 它可以用于时间管理。
MT5版本在这里 !
功能亮点 跟踪服务器时间而不是本地时间 可配置的文本颜色和字体大小 符号每日变化的可选可视化 优化以减少 CPU 使用率
输入参数
显示每日变化:真/假 文本字体大小 文字颜色
如果您仍有疑问,请通过直接消息与我联系: https://www.mql5.com/zh/users/robsjunqueira/
如果可能,请留下您的评论和评论,以帮助向社区传播信息。 还可以了解我们的其他指标和专家顾问。 我有几种有用的指标和专家顾问。 如果您有任何建议,请随时提出建议,这样我才能改进产品,使持续改进永无止境。
FREE

如果你象这个项目一样,就有5个饥饿审查。 平均价格与总额相比
一段时间内贸易。 这是按平均价格计算的。
a 股票是贸易点。 西非经货联经常被用作一个企业。
旨在尽可能被动的投资者的贸易基准
执行。 有了这一指标,你将能够利用万国宫: 目前日。 目前周。 目前 Month。 目前配额。 目前年。 或: 前一日。 前一星期。 曾任Month。 曾任。 曾任一年。
FREE

Oversold and Overbought Candles, Trendlines, and BUY-SELL arrows in the single Indicator. Built from 8 default MT4 Indicators. Stochastic,RSI,SAR,CCI,RVI,DeMarker,WPR and MA. It is " NON REPAINT " indicator. All buffers do not repaint. Double Trendline buffers that can also be used to identify sideway market and support resistance area. Any timeframes and any currency pairs.
Parameters: Show Trend . TRUE/FALSE to show trendlines on the chart Follow Trend. If TRUE , Dapitrend will show only

Fibo Scalp - Complete Multi-Timeframe MT4 Indicator Guide
Welcome to Fibo Scalp , a powerful multi-timeframe analytical tool designed natively for the MetaTrader 4 terminal. This indicator automates the tedious process of finding high-probability trend reversals and continuations by mapping out fractal-based swings and pulling Fibonacci retracements—all without you having to draw a single line. Fibo Scalp runs completely in the background across multiple timeframes simultaneously, pushing alert

Ace Supply Demand Zone Indicator The concept of supply demand relies on the quantity mismatching between buying and selling volumes in the financial market. Supply and demand zone can provide the good entry and exit. A zone is easier to trade than a line. The supply demand zone can provide the detailed trading plan and the risk management. Its ability to predict market direction is high. There are two distinctive points about Ace Supply Demand Zone Indicator. Ace Supply Demand Zone indicator was

SMC 全能版:机构市场结构与流动性分析 SMC (Smart Money Concept) 智能货币概念指标 是一款专为自动化价格行为分析而设计的综合工具。该指标能够实时标注内部和波段市场结构、高概率订单块(Order Blocks)以及流动性区域,助您告别繁琐的手动绘图。 通过识别机构参与者可能下达订单的位置,该指标可帮助您发现更精准的入场点(POI),优化您的交易决策。 核心交易优势: 自动化绘图: 立即识别 BOS 和 CHoCH,消除主观判断偏差。 流动性追踪: 自动标注相等高低点(EQH/EQL),识别潜在的扫损区域。 失衡区探测: 发现公允价值缺口(FVG),寻找市场失衡后的回补机会。 供需分析: 自动绘制牛市和熊市订单块,支持自定义显示深度。 溢价与折价区域: 始终明确当前价位处于相对范围的折价区还是溢价区。 主要功能: 实时结构分析: 完整标注内部和波段结构(BOS/CHoCH)。 订单块 (Order Blocks): 探测最新订单块,支持设置显示数量。 公允价值缺口 (FVG): 高亮显示失衡区,具备“自动阈值”功能以过滤噪音。 多时段 (MTF) 高低点: 显示
FREE
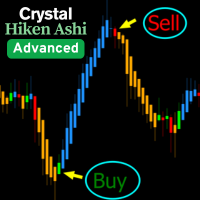
Crystal Heikin Ashi – 高级可视化 Heikin Ashi (MT4 版本) 概述 Crystal Heikin Ashi for MetaTrader 4 是一款专业级别的 Heikin Ashi 指标,为价格行为交易者、剥头皮交易者和分析师提供清晰的图表可视化。
此 MT4 版本专注于纯净的 Heikin Ashi 蜡烛与智能样式,同时保持轻量化和高速性能。 提示: 趋势着色和高级动能检测仅在 MT5 版本提供:
MT5 版本 → https://www.mql5.com/en/market/product/142042 主要功能 (MT4) 原生 Heikin Ashi 蜡烛。 可自定义多头/空头颜色。 可隐藏默认蜡烛。 支持浅色/深色主题。 高速计算,适合长周期历史。 清晰显示价格走势和反转。 参数 蜡烛样式:标准。 图表主题:浅色/深色。 适合人群 价格行为交易者。 剥头皮交易者。 希望在 MT4 使用简洁 Heikin Ashi 图表的交易者。 风险提示 该指标仅为技术可视化工具,不提供投资建议,也不能保证盈利。请在模拟账户测试后再用于真实交易,并做好风
FREE

限时折扣价! 仅售 149 美元! 购买后请联系我以获取奖励的 ORB Seeker EA 和个人优化设置文件。
自信地捕捉干净利落的比赛片段! ORB Seeker 是一款专业的开盘区间突破 (ORB) 指标,专为追求准确性、简洁性、灵活性和清晰图表结构的交易者而设计。 它能自动绘制任何交易品种的盘前或自定义交易时段区间,然后给出清晰的突破信号,包括入场点、止损点、止盈点以及可选的50%部分止盈位。所有数据均实时计算并直接显示在图表上。 您可以选择交易伦敦开盘、纽约交易时段、亚洲交易时段,或者您自定义的交易时段。ORB Seeker 会根据您选择的交易时段自动调整,让您精准掌握市场波动范围、突破位和交易位的位置。 每次购买均免费赠送 ORB Seeker EA 智能交易系统。该 EA 系统读取指标的突破信号并可自动下单,您可以选择手动交易,也可以让 EA 系统根据指标的信号逻辑自动处理入场。 为什么选择 ORB Seeker 支持多个交易时段 - 您可以自行设置伦敦、纽约、亚洲或自定义交易时段的盘前交易时间和交易时段。 完整的突破视觉效果 - 交易最高点和最低点线、范围框、突

或者 ( BD% ) 这是一个波动率指数,以百分比而不是点来衡量波动率。 BD% 的想法是根据在 0% 和 100% 之间移动的经典标准偏差 (CSD) 创建一个索引。
您可以使用 BD% 来比较同一证券在不同时间段或不同时间范围内的波动率。此外,您可以使用 BD% 以百分比而非点数来比较不同市场中不同证券之间的波动率。
如何使用“BD%”
如果 BD% 低于 90%,然后向上越过该水平,则表明价格可能在区间内波动。 如果 BD% 高于 90%,然后向下穿过该水平,并且价格已经高于其简单移动平均线,则这是新的上升趋势开始的迹象。随着 BD% 进一步下行,波动性和趋势强度正在增加。当 BD% 为 0% 时,这意味着波动率处于最高值。 如果 BD% 高于 90%,然后向下穿过该水平,并且价格已经低于其简单移动平均线,则这是新的下降趋势开始的迹象。随着 BD% 进一步下行,波动性和趋势强度正在增加。当 BD% 为 0% 时,这意味着波动率处于最高值。
要了解有关 BD% 的更多信息,请从此处阅读用户手册: https://www.mql5.com/en/blogs/post/718

Smart FVG 指标 MT4 – MetaTrader 4 高级公平价值缺口检测 Smart FVG 指标为 MetaTrader 4 提供专业的公平价值缺口(Fair Value Gap,FVG)检测、监控和告警功能,所有信息都直接显示在图表上。它将基于 ATR 的过滤与结构感知逻辑相结合,帮助你去除噪音、适应流动性,并只保留最关键的不平衡区域,从而做出更加精确的交易决策。
主要优势 精准的 FVG 检测:识别真正的市场低效,而不仅仅是简单的 K 线价格跳空。 基于 ATR 的自适应精度:根据不同市场与周期自动过滤低质量信号。 实时有效性跟踪:当价格填补或突破缺口时,相关区域会被自动延伸、调整或删除。 高度可视化与自定义:可根据任何模板自定义颜色、线型和填充样式。 实用告警功能:对新出现、被填补或被突破的 FVG 提供实时通知。 性能优化:轻量化设计,适合多品种、多周期同时扫描。
工作原理 将指标加载到任意 MT4 品种与时间周期图表上。 算法会扫描历史与实时 K 线,标出当前有效的 FVG 区域。 ATR 逻辑会根据当前波动率和流动性动态调整检测条件。 当价格完全回补缺口
FREE

Update: Push to mobile notification is now added as optinal in the settings. Most traders fail to generate profit because of the lack of so-called filters and scanners. If you want to win at trading you need a solid system and also a filtering tool for some or all of your entry criteria. It is impossible to follow 24 currency pairs, all the indices, stocks and commodities without a filtering tool. Imagine you can get an email any time CCI crosses bellow 100 and 0 when the price is bellow MA5 an
您知道为什么MetaTrader市场是出售交易策略和技术指标的最佳场所吗?不需要广告或软件保护,没有支付的麻烦。一切都在MetaTrader市场提供。
