适用于MetaTrader 4的技术指标 - 82
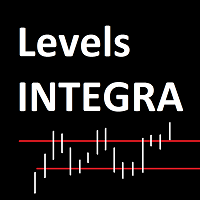
Levels_KEY_Integra - это алгоритм глубокого сканирования рынка и вычленения Ключевых ценовых уровней.
Параметры HISTORY_D1 - Глубина сканирования на Дневном графике. Levels_D1 - Цвет уровней D1. Levels_W1 - Цвет уровней W1. Leave_Mark - "Оставить след". Возможность сохранения рисунка после удаления индикатора. Важные замечания: Проверять индикатор-сканер в тестере не имеет смысла. Резу
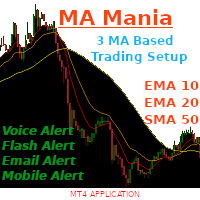
The Indicator includes three of the most prominent moving averages indicators. These are : Ten Period Exponential Moving Average Twenty Period Exponential Moving Average Fifty Period Simple Moving Average This is one of my favourite trend follow setup that is solely based on these three moving averages. The indicator has the following abilities: It can notify you through voice alerts when price touches any of the moving averages . For example if price touches Fifty Period Simple Moving Average t

This is a trend indicator with some filters. If you use this tool as it is written in the recommendation. Trading recommendations 1 It is worth opening a deal while receiving a signal (The blue dot indicates that it is possible to open an order for Buy. The red dot indicates that it is possible to open an order for Sell) 2 Set Take Profit at 40 pips or 4 points 3 Stoploss is not installed in its place, we exit on the opposite signal if the transaction was unprofitable
It is important to need a
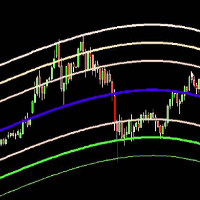
Belkhayate Gravity Center MT4 The Belkhayate center of gravity indicator is best used to confirm major turning points, and distinguish price extremes. Generally if price reaches the upper or lower levels one should expect a turn around coming soon, or at least a pull back towards the centre line if there is a strong trend. The upper and lower levels are red and green lines.
Our indicator use the same parameters as the well known trader M.Mostafa Belkhayate the inventor of the indicator, allow th
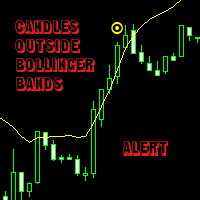
This indicator allows you not loosing any important moment of the market, at the same time that you dont need to be in front of the chart watching that moment to come.
You just set the patterns up, and then the indicator will bring the signal and alert to call your attention.
Its possible to be alerted when volativity comes without watching the charts like a crazy.
You can set it up and follow the trend, when trend gets power. (Eg. A big period and a small deviation number could call attenti

Данная панель упростит работу тем, кто использует в своей торговле горизонтальные уровни. Панель дает возможность быстро переключатся по инструментам, при этом в несколько кликов устанавливать уровни на графиках и взаимодействовать с ними. Имеется гибкая настройка оповещения. Одно из преимуществ данного продукта, показывать вид пробития уровня, это ложный пробой или закрепление за уровнем.
Настройки
Market_Watch - При (true) выводит инструменты из списка панели "Обзор рынка", при (false) инструм

V O L A T I L I T Y W A T C H E R A highly powerful Market Volatility Detector. It gives current situation of market technical sentiment.
V E R Y I M P O R T A N T Once the tool detects and alerts you, you have to act on it right away for more precision of entries. Once the recommended pair to trade is gone, wait for the next recommendation. If your MT4 is newly installed, there's no sufficient data yet for all 28 pairs that the tool monitors. You have to
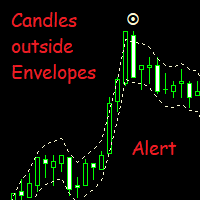
This indicator allows you not loosing any important moment of the market, at the same time that you dont need to be in front of the chart watching that moment to come.
You just set the patterns up, and then the indicator will bring the signal and alert to call your attention.
Its possible to be alerted when volativity comes without watching the charts like a crazy.
You can set it up and follow the trend, when trend gets power. (Eg. A big period and a small deviation number could call attent
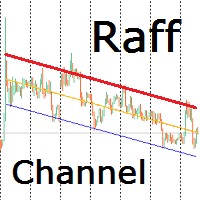
Индикатор строит канал Раффа на основе линейной регрессии. Красная линия тренда может использоваться для принятия решения о покупке или продаже внутрь канала при подходе цены к ней. Настройками можно задать ширину канала по коэффициенту отклонения от базовой линии или по максимальному и минимальному экстремуму. Так же можно включить продолжение канала вправо от текущих цен. Индикатор канала регрессии Раффа – удобный инструмент, значительно облегчающий работу современного трейдера. Он может быть

I developed a special algorithm indicator
Indicator EXACTLY-SR-LEVELS looks for confluence of at least two combination algorithm levels (day+week,day+mont,day+year, week+month, week+year,month+year)
LEVELS ARE NOT REDRAWN IF THE NEW HIGH / LOW INDICATOR IS CALCULATING NEW LEVELY AND DRAWS IN THE GRAPH
On a new low/high day - the S/R day is recalculed. On a new low/high week - the S/R week is a recalculed On a new low/high month - the S/R month is a recalculed On a new low/high year - the S/R

This is a Currency Strength Meter Indicator. Build in different calculation methode that show very smooth index. It prevent for minor trend strengtness in case for decreasing fake signal. I'll explain about the parameters below : suffix : Additional quote after name of currency,should be added. (i.e. EURUSD.c, suffix is .c ) TF1 : First Coloum Type of Timeframe. TF2 : Second Coloum Type of Timeframe. TF3 : Thirth Coloum Type of Timefra

Trading Binary ? No problem, Scorpion Binary custom indicator helps you spot the entry points to the binary options (call / put).
Indicator Inputs : - Signal arrow distance from the candle (in pips) - Signal arrow size (from 1 to 5) - call / put put signal color - Window pop up alert - Email alert - Push notifications
Recommended Settings : - Timeframe : M1, M5, and M15 - Expiry time : 3 candles (3 minutes for M1, 15 minutes for M5, 45 minutes for M15)
For any suggestion, issues, or question.

MA CROSSES PRO MT4 是一個移動平均線交叉箭頭指標。指標參數有直觀的名稱,每行單獨配置。指示器可以通過顯示箭頭、發出聲音信號、向移動終端和電子郵件發送通知來發出信號。
指標不會重繪 僅在蠟燭收盤時發出信號 非常適合剝頭皮 適用於任何貨幣對和任何時間範圍 時間越長,信號越好 作為任何交易策略的附加組件兼容。
選項:
FASTER_MA - 快速移動週期; FASTER_MA_METHOD - 快速移動平均法; FASTER_MA_PRICE - 使用價格; FASTER_MA_SHIFT - 移位; SLOWER_MA - 緩慢移動週期; SLOWER_MA_METHOD - 緩慢移動平均法; SLOWER_MA_PRICE - 使用價格; SLOWER_MA_SHIFT - 移位; ALERT - 顯示一個對話框; PUSH_NOTIFICATIONS - 向移動終端發送通知; SEND_MAIL - 發送電子郵件;
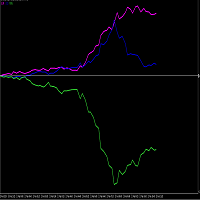
PLEASE NOTE THAT LIKE MANY SUCH INDICATORS ON THIS MARKET, THIS INDICATOR WILL NOT WORK AS A DEMO DOWNLOAD FOR STRATEGY TESTER. Therefore the 1 month option at the lowest cost allowed of $10 is available for you to test. One of the better ways to trade is to analyze individual currencies rather than currency pairs. This is impossible with standard chart indicators on MT4. This currency strength meter allows one to trade the USDMXN or EURMXN. Each currency (not pair) is measured constantly ag

SYMBOL POWER based on inputted 5 time frames and Compared to 20 Other Symbols !! Great Indicator YOU DON'T HAVE TO SHIFT ON ALL TIME FRAMES FOR EACH CURRENCY PAIR TO CONCLUDE ITS TREND AND ITS POWER YOU HAVE IT ALL IN ONE TABLE , 20 CURRENCY PAIR WITH 5 TIME FRAMES ALSO , COMPARE BETWEEN CURRENCIES STRENGTH AND ALERTS THE STRONGER /WEAKER PAIR BASED ON 5 TIMEFRAMES CALCULATIONS ALEERTS enable /disable using 5 time frames M5 M30 H1 H4 and D1 ( latest version You SELECT you own 5 timeframes from

外汇市场时间指标,包含 悉尼,东京,伦敦,纽约 4个市场时间 考虑了服务器夏令时切换,以及各市场的夏令时切换 input int InpServerTimeZoneNoDSTOffset =2; 非夏令时服务器时间GMT偏移 input ENUM_DST_ZONE InpServerDSTChangeRule = DST_ZONE_US; //服务器端夏令时切换规则 按照纽约还是欧洲 input int InpBackDays=100; // 最多绘制天数,出于性能考虑 input bool InpShowTextLabel=true; // 显示文本标签 哪个市场,当前波动点数 input color InpTextColor=clrWhite; // 标签文本颜色 input int InpTextFontSize=8; //标签文本字号 input bool InpFillBack=false; //方框背景色是否填充 input ENUM_LINE_STYLE InpLineStyle=STYLE_DOT; // 方框线样式
input bool

The intelligent algorithm of the Trend Detects indicator shows the points of potential market reversal. Strategy for trend trading, filtering market noise and all the necessary functions built into one tool! The system itself shows in the form of arrows when to buy and when to sell. Uses only one parameter for settings. Simple, visual and effective trend detection.
Most often, a good trend is visible on the price chart visually. But an experienced trader must clearly understand the current bal

The Signal Envelopes indicator uses the robust filtering method based on: (1) the moving median Buff0 = <Median> = (Max {x} + Min {x}) / 2 and (2) the averaging algorithm developed by the author Buff1 = <(<Median> ) ^ (- 3)> * (<Median>) ^ 4 based on the moving median. The Signal Envelopes indicator allows you to most accurately and with the minimum possible delay set the beginning of a new trend. The Signal Envelopes indicator can be used both for trading according to scalpe

This Indicator is made on the behalf of traders to trade inside the Gann angles. The indicator has the inside function of auto adjusting the chart window zooming in/out when the terminal is connected to the internet and new Tick come to draw the angles on the proper way of price and time. The angle would be not drawn until the suitable zooming is not achieved upon tick by tick.
The starting value of angle drawn is calculated the Zigzag indicator. The zigzag can be adjusted through the back-cand

The "Pyramids trend line" is a trading and a Filtering tool too, it is based on a combination of important indicators in one tool. We programmed a dashboard that helps you know the current direction for each time frame, to avoid wasting time searching for it. We also put a percentage of the trend to know its current strength (using all time frames).
The advantages of this indicator: It is easy to know the trend in all time frame. It is easy to know the strength of the trend. It gives you the

Automatic redrawing of Trend Supports and resistances levels and Possible Wedge pattern formation to indicate price breaking of Rising Wedge (signal SELL) or price breaking of falling Wedge (signal BUY) Very simple and smart indicator ALERTS AND MOBILE NOTIFICATIONS availavle !!! you can edit the calculation bars of the bars count for formation of the trend lines and the initial shift from current price Smaller values for bars /shift inputs when using Higher Time frames (D1-H4) and the reverse

MARCH BONUS FOR FIRST 10 BUYER AT THE PRICE OF 30$, PRICE WILL INCREASE AFTER BACK TO 70$ BY 17TH MARCH 2020
ABOUT THE INDICATOR the indicator identify early trend reversal it can be use by any type of trader; scalper, day trader, swing trader it works for all timeframe IT SEND NOTIFICATION DOWN TO YOUR MOBILE PHONE
HOW TO USE ? take trade when the BLUE OR RED BOOM REVERSAL INDICATOR PAINTS
MY STRATEGY FOR SCALPER BUY: look for Blue boom reversal indicator on 15Mins or 30Mins Timeframe and re

In the financial world, risk management is the process of identification, analysis and acceptance of uncertainty in investment decisions. Essentially, risk management occurs when an investor or fund manager analyzes and attempts to quantify the potential for losses in an investment, such as a moral hazard, and then takes the appropriate action given his investment objectives and risk tolerance. This tool should be the success key before you lost your capitals due to the unawareness of market beh

GOOD LUCK Please contact me The indicator allows you to trade binary options. The recommended time frame is М1 and the expiration time is 2, 3, 5 minutes. The indicator suitable for Auto and Manual trading. A possible signal is specified as a arrows above/under a candle. You should wait until the candle closes! Arrows are not re-painted Trade sessions: Any Currency pairs: Any Working time frame: M1,M5 Expiration time: 1,2,3,4, 5, 10, 15 minute With auto trading with Bot, buffer

The basis of the indicator is based on my trading strategy, according to which I trade daily. I automated my system so that it would learn on the market independently. The indicator will not show transactions on the history of the chart, since all calculations of the trading system are in real time.
Differences from other indicators:
Real time calculations Dynamic Take Profits Dynamic Signals Trend Signals Ideal for beginners Any Currency Pair Any TimeFrame Suitable for scalping
To enter
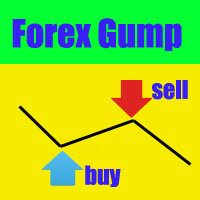
SETTINGS OF SLOW MA MA period is the averaging Period for calculation MA shift is Shift of the indicator concerning the schedule. Averaging method - Averaging method. Price type - The used price. SETTINGS OF FAST MA MA period is the averaging Period for calculation MA shift is Shift of the indicator concerning the schedule. Averaging method - Averaging method. Price type - The used price. OTHER SETTINGS Arrow indent, points - An arrow space from MA. Turn on the Alert? - to include/switch off
Market Volatility Why Use Volatility Indicators For Options? Binary options traders can profit from volatility indicators more than traders of conventional assets. There are two main reasons for this statement:
Some Trades Win On Volatility Alone Traders of conventional assets are unable to win a trade on volatility alone. Stock traders, for example, can use volatility indicators as one factor in the decision-making process, but volatility indicators say little about whether an asset’s price wi
Market XVolatility / is an indicator that analyzes and visualizes momentum and price strength. The MXV is a confirmation indicator that analyzes buying and selling pressure by looking at price movements and whether volume is falling or rising. Therefore, the MXV is used by trend-following traders who want to know if a trend is strong enough to enter and by counter-trend traders who look to fade trends. RED color in up
A red color means that there is indecision in the market and that price

This indicator is specially made for binary options trading. The indicator works well with seven currency pairs. EURUSD, AUDCAD, GBPUSD, AUDUSD, EURGBP, EURJPY, NZDUSD. The indicator works with online daily quotes on mt4 as well as offline OTC quotes for weekend trading. Provided your options broker offer OTC facility for weekend trading. It is profitable with or without martingale. But more profitable with martingale of 6 steps maximum. It work on 1 minute, 5 minutes, 15 minutes and 30 minutes

The indicator does not use predictions. It merely shows what range the price is in.
However, it does a good job with chart markings and mapping current trade preferences.
It can act as an independent tool of medium and long-term urgent trade, and together with oscillators it is possible to build a good scalper system. Important! The signal is 0 bar - does not repaint! Indicator parameters:
Zone Range (Pips) - size of zone in pips excluding the number of characters;
Line or Histogram Width -

覆盖98%价格区间的通道指标,是您投资分析的利器。 肯特纳通道Keltner Channels是一种反映股票价格运动趋势和波动性的价格通道。它与著名的布林线Bollinger Band有一定的相似性,但计算方法不同。 肯特纳通道(KC)是一个移动平均通道,由叁条线组合而成(上通道、中通道及下通道)。若股价於边界出现不沉常的波动,即表示买卖机会。肯特纳通道是基于平均真实波幅原理而形成的指标,对价格波动反应灵敏,它可以取代布林线或百分比通道作为判市的新工具。 肯特纳通道是由两根围绕线性加权移动平均线波动的环带组成的,其中线性加权均线的参数通道是20。价格突破带状的上轨和下轨时,通常会产生做多或做空的交易信号,指标的发明人是Chester Keltner,由Linda Raschke再度优化改进,她采用10单位的线性加权均线来计算平均真实波幅(ATR)。 肯特纳通道Keltner Channels的构成: 一个简单的Keltner Channels含有三条线:中线,上轨和下轨。 中线是EMA(20),价格的20日EMA均线。 上轨=中线+2*A

Dual Super Trend Channel - Индикатор канала, целью которого является нахождение правильных уровней поддержки и сопротивления. За основу при разработке индикатора брались положения Теории Ганна. Прекрасно подходит как для начинающих, так и для профессиональных трейдеров. Рекомендуемый таймфрейм - H1, H4, D1. Рекомендуемые валютные пары: Мультивалютный. Работает как на 4-х, так и на 5-и значных котировках.

Multi Strategies Single Combined Select from up to 6 Strategies solo or Combine different strategies for signal generation (Combining more than 2 strategies may LIMIT a lot the number of signals)! ALL inputs and Strategies selection From Chart !!! Also Inputs editing from Chart !!! Push your strategy bottom (one strategy) OR Combine signal from as may strategies (up to 6) : Selected and enabled strategies will be in GREEN !!! 1- BUY SELL areas 2- Support resistance break signal 3- Elliot wave

FxChanelPro FxChannelPro - the top channel indicator - time-tested, is a complete trading system. The indicator algorithm forms an extended trading channel (blue lines), as well as trading signals in the form of arrows. The down arrow (red) is a signal to sell or close a previously open buy position, the up arrow (green) is a signal to buy or close an earlier open sell position. The indicator also forms intermediate lines of goals. In the upper left corner, the indicator displays approximate est

Oversold and Overbought Candles, Trendlines, and BUY-SELL arrows in the single Indicator. Built from 8 default MT4 Indicators. Stochastic,RSI,SAR,CCI,RVI,DeMarker,WPR and MA. It is " NON REPAINT " indicator. All buffers do not repaint. Double Trendline buffers that can also be used to identify sideway market and support resistance area. Any timeframes and any currency pairs.
Parameters: Show Trend . TRUE/FALSE to show trendlines on the chart Follow Trend. If TRUE , Dapitrend will show only

BeST_Hull MAs Directional Strategy is a Metatrader Indicator based on the corresponding Hull Moving Average.It timely locates the most likely points for Entering the Market as well as the most suitable Exit points and can be used either as a standalone Trading System or as an add-on to any Trading System for finding/confirming the most appropriate Entry or Exit points. This indicator does use only the directional slope and its turning points of Hull MAs to locate the Entry/Exit points while it a
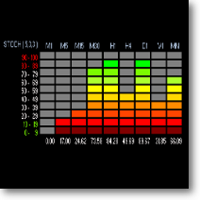
Benefits: A new and innovative way of looking across multiple timeframes and multiple indicators on any chart. Provides instant multi-timeframe analysis of any market. i.e. forex currency pairs, cryptocurrency pairs, commodities, etc. It offers precise indications across multiple timeframes of volatility as measured by RSI, ADX and STOCH within one chart. Helps you determine high probability trading setups. See example strategy in comments. Can see bullish/bearish volatility building across mult
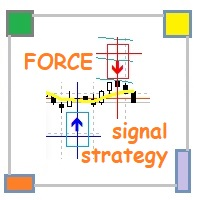
В данной системе за основу взят индикатор Force Index . Система: определяет наиболее выгодные точки входа в рынок с использованием «короткого» STOPLOSSa , анализирует три индикатора : Force Index , Moving Average и Bolinger Bands, является составным индикатором с генерацией сигналов для входа в рынок, позволяет выбрать вариант анализа данных трех индикаторов, так же есть возможность изменения параметров для перенастройки. Индикатор Force Index (FI) или индекс относительной силы Force Relative I

Buy Sell Zones Simple indicator for BUY / Sell Zones moving Buy and Sell zones : Closest zone is wide and clear : Red for Sell zone , Green for Buy zone >>> old far zones are in bold lines :::BUY Zones (GREEN) appear only in UP Trend and disappear in DOWN Trend :::SELL Zones (RED) appear only in DOWN Trend and disappear in UP Trend input parameters ::: index bars : bars range for zone calculation levels : number of zones Up move/Down move arrows mail and message Alerts !! used on any symbol u

新的外汇指标 Turn Indi 是希望“手动”进行交易的交易者的助手。 该指标信号的准确性达到85-90%,使其成为日内交易必不可少的工具。 Turn Indi 通过关联几个内置的过滤器和价格走势来发现市场趋势的可能变化点,这使得可以在趋势和主要走势的修正上进行交易。 该指标与交易者不断互动,对从 M1 到 MN 的所有价格变化做出即时反应,而不受时间限制。 消息窗口和声音伴奏可以接收相关信息。 极其简单的界面和最少的参数数量,使得即使没有经验的交易者也可以方便地使用 Turn Indi 指标。
Telegram: https://t.me/realforexrobots
推荐建议 经纪人-任何。 帐户类型-任何。 时间范围-用户的选择。 终端-MetaTrader4。 参量 TimeFrame – 指标将在其上寻找可能进入市场的切入点的时间范围。 无论图表的当前时间段如何,都将在用户指定的时间段内执行搜索。 Indent for Arrow in Points – 从绘制图形对象的价格(向上和向下)缩进(以磅为单位)。 ShowAlerts – 如果为“ true”,则外汇指示

Sentinel Power follow trend. Color change trend changed.
Works in USDTRY/EURTRY/GOLD/SILVER/EURUSD/EURJPY/GBPUSD/EURGBP/GBPJPY/AUDJPY/AUDUSD/AUDCAD/US500/JP225 and all pairs
Best timeframes 5M/15M/1H/4H/DAILY
Signal on close of a bar.
DOES NOT repaint. DOES NOT repaint. DOES NOT repaint. DOES NOT repaint.
DOES NOT recalculate. DOES NOT recalculate. DOES NOT recalculate. DOES NOT recalculate Settings EmailOn : true/false PushNotificationOn : true/false SoundOn : true/false

Roller Coaster
Perfect for trading Stocks, Futures, Commodities and Currencies The Roller Coaster is a Stochastic MACD Cross with Special EMA Points of Control for both Long and Short Trades.
Our algorithm works everything out behind the scenes, keeping your chart clean. Read more about the inner workings here ==> https://www.mql5.com/en/blogs/post/734074
With the lease of our indicator, you will have access to:
Entry Price Stop Loss Price Trade Management using Stochastic/MACD Cross Traili

ABOUT THE INDICATOR
IT IS A NON REPAINT INDICATOR the indicator identify early trend reversal it can be use by any type of trader; scalper, day trader, swing trader it works for all timeframe IT SEND NOTIFICATION DOWN TO YOUR MOBILE PHONE HOW TO USE ? take trade when the BLUE OR RED ELEOJO REVERSAL INDICATOR PAINTS MY STRATEGY FOR SCALPER BUY: look for Blue Eleojo reversal indicator on 15Mins or 30Mins Timeframe and return to 1Mins timeframe, take trades when the Blue Eleojo reversal indi

The Trend Agil e indicator tracks the market trend with very high reliability. Sharp price fluctuations, as well as noise around averaged prices, are ignored. All intersection points will be ideal points at which the direction of the trend changes. Signal points, places where color changes, can be used as points of potential market reversal. This development can be used both for long-term trading, and for piping on small periods. The indiuctor algorithm implements a variety of technical analysis

This indicator gives signals about a trend change, shows successful signals. High probability of a successful trend, it can be used with an optimal risk to profit ratio. The indicator does not redraw and does not lag, it can be used both for pipsing in small periods and for long-term trading. The indicator algorithm works using open prices, and you can work with a zero bar. It works on all currency pairs and on all timeframes.

Introducing the trend indicator! Ready trading system. The principle of the indicator is to automatically determine the current state of the market when placed on a chart. The indicator analyzes market dynamics for pivot points. Shows the favorable moments of entering the market in stripes. It can be used as a channel indicator or level indicator! This indicator allows you to analyze historical data, and on their basis display instructions to the trader on further actions. To find out how to det

Transition indicator can track a steady price movement in a certain direction. In this case, the movement itself can be downward, upward or sideways, when the market movement does not have a pronounced focus. The indicator works on the basis of two moving average as well as an oscillator. Using the signal search algorithm, the indicator generates signals in the form of arrows.
Trading based on trend indicators is the simplest and often the most effective. If you correctly determine the beginni

Global Trend Indicator, shows the signals for entry. Displays both entry points and the trend itself. Shows statistically calculated moments for entering the market with arrows. When using the indicator, the risk factor can be optimally distributed.
Settings:
Uses all one parameter for settings. Choosing a parameter, it is necessary to visually resemble it so that the appropriate graph has a projection of extremes.
Parameters:
Length - the number of bars for calculating the indicator.
Use

DYJ Alligator 信号源基于 Alligator 指示器。它可以用于任何货币对和时间框架。
蓝线(Alligator‘s Jaw)是用于构建图表的时间段的平衡线(13期平滑移动平均线,向未来移动8条);
红线(鳄鱼的牙齿)是低一级(8期平滑移动平均线,向未来移动5条)的价值时间框架的平衡线;
绿线(Alligator's Lips)是价值时间段的平衡线,再低一级(5期平滑移动平均线,向未来移动3条)。
市场进入条件
BUY: Lips#1 > Teeth#1 and Teeth#1 > Jaws#1
SELL: Lips#1 < Teeth#1 and Teeth#1 < Jaws#1 该指标的入场信号,则是趋势转折点。
该指标使用模拟交易技术, 指标为你提供评价开盘信号和收盘信号整体盈利。 你用哪种评估模式交易都很方便。 当你选择最大利润模型评估模型时, 建议您使用跟踪止损功能。 这样可以最大程度的跟踪趋势利润。 当您选择反向信号关闭评估模式时, 建议你耐心等待反信号出现,然后关闭仓位。 这个可以一直等趋势真正结束并盈利。 如果您需要自动化跟

Trend Lines Signal This Indicator provides Buy/Sell Signal based on calculations on Higher frame (Trend) and Lower frame(Entry signals) * You should select the higher and lower frame for indicator calculations * You select the Trend line colors as you prefer * Enable or disable Alerts! Trend lines UP/Down are drawn when a trend is detected Wait for small arrows for entry : *Normally an UP arrow in an UP Trend is a BUY signal : ---you Close the BUY position IF a Reverse DOWN Trend signal appear
PLEASE NOTE THAT LIKE MANY SUCH INDICATORS ON THIS MARKET, THIS INDICATOR WILL NOT WORK AS A DEMO DOWNLOAD FOR STRATEGY TESTER. Therefore the 1 month option at the lowest cost allowed of $10 is available for you to test.
One of the better ways to trade is to analyse individual currencies rather than currency pairs. This is impossible with standard chart indicators on MT4. This currency strength meter measures the strength of the ZAR using the most important ZAR pairs in the market, namely, A

The principle of this indicator is very simple: detecting the trend with Moving Average, then monitoring the return point of graph by using the crossing of Stochastic Oscillator and finally predicting BUY and SELL signal with arrows, alerts and notifications. The parameters are fixed and automatically calculated on each time frame. Example: If you install indicator on EURUSD, timeframe M5: the indicator will detect the main trend with the Moving Average on this timeframe (for example the Moving
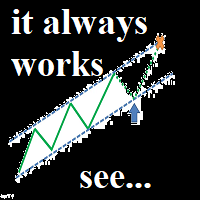
My new system... This is not a regular channel. Who is it for: - For people who want to understand the market. Tested and used in the real market (I use and not just encodes)
Important !!! The system requires thinking.
Only for real traders. If you are looking for a holy grail - please don't bother me.
Is it possible? Trading has never been so easy. A combination of fibonacci and an intelligent channel plus levels of support and resistance. Setting out a channel is now very easy. Chan
The indicator is a mathematical analog of a two-level RC (resistor-capacitor) filter. On the chart (default colors), the red line is the standard terminal Moving Average, the values of which are filtered by the first level filter (yellow line) and then by the second level filter (blue line). Moving Average sets the preliminary smoothing of the price series.
The indicator has the ability to use the sticking together of any combination of its own charts among themselves, if they are at a dist

Trend Ex is an author’s indicator of which you will not find anywhere else. This indicator allows you to find the most likely points of a trend reversal, a trend indicator for the MetaTrader 4 trading platform. A simple but effective system for determining the forex trend. From the screenshots you can see for yourself the accuracy of this tool. It works on all currency pairs, stocks, raw materials, cryptocurrencies.
An alert system (alert, email notifications) will help to monitor several trad

Closing average This is a completely new indicator in technical analysis. It is based solely on mathematical calculation. about signals It’s worth going into a buy transaction when the price has crossed the indicator line from bottom to top and it is under the price it is worth entering a deal on sell when the price is below the indicator line
This author’s development, he doesn’t use any indicators of technical analysis in his analysis.
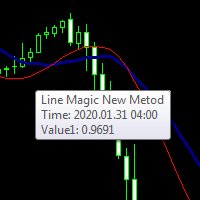
Line Magic New Metod similar to the usual Moving Average but not so This tool has a completely different data calculation algorithm. you can see this by comparing them it is recommended to use this indicator with the Moving Average since when combining these two tools they compensate for most of the shortcomings of themselves apply as shown in the screenshots
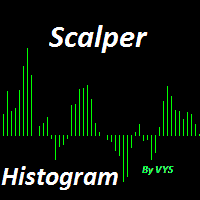
designed for scalping (pipsing on time frames up to H 1) enter the buy transaction when the host program crossed the zero line from the bottom up enter the sell deal when the histogram crossed the zero line from top to bottom recommended to be paired with other tools such as bollinger bands, macd, moving average recommendations for installing stop loss and take profit take profit set at 20-30 pips stop loss is not set for a minus trade closing on the opposite signal

Trend indicator with calculation of dynamic levels and signaling their intersection.
Description of input parameters:
StepTF = true; - Calculation of the indicator by closing the bar (true) or by each tick (false)
BarsCount = 300; - Number of settlement bars
Price = PRICE_CLOSE; - Type of price used
TimeFrame = PERIOD_CURRENT; - Estimated timeframe
TrendPeriod = 9; - Trend calculation period
TrendDeviations = 4.9; - coefficient of deviation
PeriodTrendSmooth = 1; - Trend smoothing perio

Trend DI is an auxiliary tool for technical analysis that helps determine the exact direction of a trend: either an upward or downward movement of the price of a trading instrument. Although the Trend DI indicator is a bit late, it still generates the most reliable signals that a trader can safely navigate.
The Trend DI indicator smooths price fluctuations during signal formation by averaging data. This gives the trader the opportunity to visually determine which trend will be present in a par

The Trend ZVD Trend Indicator is important for identifying trends in financial markets. However, this indicator works equally well during consolidation periods. The Trend ZVD trend indicator indicates the direction in which the asset of your choice can move.
The Trend ZVD trend indicator copes with the main task of trading: to find the entry point to the market at the time the trend is created and the exit point at the time it is completed. A trend in trade is the steady movement of quotes in

The indicator automatically adjusts itself to any trading instrument and determines basic market conditions, such as: Flet, Trend, Overbought and Oversold Works on all timeframes, all currency pairs, metals and cryptov currencies
Can be used when working with binary options
Distinctive features It's not redrawn; Fast filtering of basic market conditions; Easy and clear settings; Works on all timeframes and all symbols; Suitable for trading currencies, metals, options and crypt currencies (Bit

All in One Forex Dashboard is a multitimeframe and multicurrency screener with external data inupt.
You can filter your signal by multiple information to find trend or potential inversion on 28 currency cross.
The first group of indicator is a Trend indicator . It's based on average price and allow you to konw if you are in trend or not in all major timeframes.
Single timeframe is colored according to the information founded, while it remains gray when the price is in an accumulation or di

The Garuda Empire - Binary Options Experience the epitome of trading synthesis where the time-honored Ichimoku methodology seamlessly intertwines with revered Western indicators. It's a harmonious blend—Europe shaking hands with Japan, a true testament to the power of global financial collaboration. With years of dedicated observation and analysis, I've come to one conclusion: Mastery is achieved through specialization. My journey with the EURJPY has been transformative, leading to the birth of
Most accurate BUY/SELL indicator on this market.
It works based on the result of multiple EMAs, with some specific averaging and algorithm . Output of an EMA is the input for another EMA.
Works on Forex, Commodities, Indicies, Stocks, Crypto, ... on all timeframes (but recommend 1H or 4H) and on every brooker.
If you want this and all my other products for FREE , create account here and then write me and I will send you all my actual and future product for FREE + VIP on my http://discord.
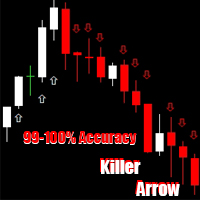
️ Trader's & Investors ️
Are you really tensed how do Buy / Sell ? Are you want daily minimum pips to settlement your desired target ? Are you want daily basis profit ? Are you want to beat the market ?
️ Then "Killer Arrow" help you out ️ "Killer Arrow" able to give you daily basis profit ️ You able to beat the market in every day basis
Usage System
Follow our rules to use this indicator! ️ Use only volatile currency pair. ️ Use GBP related

RSI multitimeframe is a simple but useful indicator that allow you to know the status of RSI in all time frame, from 5 minute to monthly. In input you can insert your preferred setting which will be applied to the whole indicator. A green histogram is shown, if the value is greater than 50. A red histogram appears instead if the value is less than 50. If you click on timeframe label you can change timeframe on selected chart. You will discover how important it is to understand the strength of th

Stochastic multitimeframe is a simple but useful indicator that allow you to know the status of Stochastic in all time frame, from 5 minute to monthly. In input you can insert your preferred setting which will be applied to the whole indicator. A green histogram is shown, if the value is greater than 50. A red histogram appears instead if the value is less than 50. If you click on timeframe label you can change timeframe on selected chart. You will discover how important it is to understand the
Analyzer is a multiple indicator multi timeframe that allow you to know the status of RSI , Stochastic and ADX in all time frame, from 5 minute to monthly. In input you can insert your preferred setting which will be applied to the whole indicator. Trade with this indicator is very simple. You can follow the trend or find the best opportunity for reversal. A green histogram is shown when the indicator report a bullish tendency. A red histogram appears whether the indicators indicate a bearish te
您知道为什么MetaTrader市场是出售交易策略和技术指标的最佳场所吗?不需要广告或软件保护,没有支付的麻烦。一切都在MetaTrader市场提供。
您错过了交易机会:
- 免费交易应用程序
- 8,000+信号可供复制
- 探索金融市场的经济新闻
注册
登录