适用于MetaTrader 4的技术指标 - 146

Entry Maker (Full) – 基于时间的信号生成器,带SL/TP和蜡烛过滤功能
适用于所有时间周期和交易品种。
无重绘,界面简洁,完全掌控基于时间的入场信号。 主要功能
– 设定精确的入场时间(小时和分钟)并在图表上显示买/卖箭头
– 灵活的止损/止盈设置(点数)
– SL触发后可自动调整SL/TP
– 可选基于S1、R1等支撑/阻力的止盈逻辑
– 可启用绿色蜡烛确认买入
– 附加止损箭头追踪额外风险 工作原理
在你设定的时间生成买卖箭头,帮助你制定清晰可复现的交易策略。
当止损触发时,可自动切换备用SL/TP或支撑阻力TP,提高适应能力。 输入设置
– 开启/关闭买入或卖出箭头
– 自定义SL/TP点数
– SL触发后的新TP/SL
– 支撑阻力止盈选项
– 绿色蜡烛过滤功能
– 附加止损箭头和偏移值 兼容性
– 适用于所有时间周期和交易品种
– 不重绘
– 即插即用,轻松视觉交易
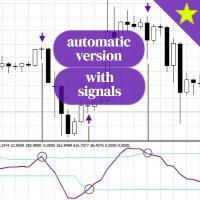
This is an advanced version of my RSI Cyclic indicator. The other version is already a very powerful tool but it requires a manual change of the dominant cycle each time it is used and it is not obvious or easy to do and it does not offer signals. This version uses a Fast Fourier Transform (FFT) to automatically detect the current dominant cycle and uses it as new input for the indicator each tick which dynamically updates the chart. It can be used without the signals simply looking at the color

这段代码是一个用于 MetaTrader 4 (MT4) 平台的MQL4指标脚本,主要功能是在图表上实时显示以下信息: 当前K线的剩余时间 (格式为 X分Y秒 )。 本地时间 (格式为 HH:MM:SS )。 代码的主要组成部分包括: 初始化函数 OnInit : 创建文本对象用于显示时间和剩余时间。 计算并打印本地时间与服务器时间的差异。 初始化定时器,每1秒触发一次 OnTimer 。 反初始化函数 OnDeinit : 删除文本对象。 销毁定时器。 计算函数 OnCalculate : 计算当前K线的剩余时间。 获取本地时间并格式化。 更新文本对象的内容和位置,确保显示信息实时更新。 定时器函数 OnTimer : 每1秒调用一次 OnCalculate ,强制更新时间显示。 辅助函数 FormatRemainingTime : 将剩余时间(秒)格式化为 X分Y秒 的字符串。

Contact me through this email address to download the FREE strategy PDF for this indicator tharindu999lakmal@gmail.com
Download MT5 version here -- >> https://www.mql5.com/en/market/product/119467
Introduction The "VIP Buy Sell Signals MT" is designed to provide BUY and SELL trade signals based on the current market conditions. A Trading Strategy (Chee sheet) has been provided for this trading indicator. (Read the description). This indicator has time tuned e ntry signals . so

Tired of being on the wrong side of the trend? MT4 ROADS puts the power of the Moving Average Channel in your hands. Dynamically plots buy and sell zones using a custom moving average Clearly identifies the current market trend for more confident trading Fully customizable settings to optimize performance for your strategy Visual signal potential trend changes before they happen The MT4 ROADS indicator is your personal market navigator, guiding you through the unpredictable ebb and flow of volat

Linear Trend Predictor — 结合切入点和方向支撑线的趋势指标。按照突破高/低价通道的原理运作。该指标算法过滤市场噪音,考虑波动性和市场动态。
指示器功能
使用平滑方法,显示市场趋势和开立买入或卖出订单的切入点。 适合通过分析任何时间范围内的图表来确定短期和长期的市场走势。 输入参数可适应任何市场和时间范围,允许交易者独立定制指标。 设定的指示信号不会消失,也不会重新绘制——它是在蜡烛收盘时确定的。 几种类型的通知以箭头组合。 该指标既可以作为独立的交易系统使用,也可以作为其他交易系统的补充。 可供任何经验水平的交易者使用。
主要参数
Volatility Smoothing Level - 指标的主要参数,允许您配置指标以实现舒适的操作。
它的数字范围是 1 到 100,从而增加了您可以获得更长趋势运动的平滑度。
通过少量的数字,您可以获得短期走势并快速退出交易。
使用指标进行交易的时刻:
红线和箭头表示下降趋势和卖出开盘信号。止损应根据前一个上分形来设置。 黄线和箭头表示上升趋势和买入开盘信号。止损应根据前一个下分形来设置。
推荐这款分时均线指标程序!它在主窗口直观展示实时价格与 30 分钟、60 分钟、120 分钟均线,助您精准把握日内趋势。参数可灵活调整,支持多种均线类型,适配不同交易风格。代码优化高效,避免重复计算,运行流畅。清晰的多色线条与标签设计,让价格与均线的关系一目了然,助力您快速捕捉交易信号。简洁实用的设计,是日内交易者分析行情的得力工具,值得一试。配合MACD及HAM买卖提示能对交易有质的提升。 1. 指标显示设置 借助 #property 指令对指标的显示属性加以设置: #property indicator_chart_window :保证指标在交易图表的主窗口显示。 #property indicator_buffers 4 :设定指标运用 4 个数据缓冲区,分别用来存储实时价格以及 3 种不同周期的均线数据。 #property indicator_colorX :为不同的线条设定颜色,例如价格线是蓝色,30 分钟均线是红色,60 分钟均线是绿色,120 分钟均线是紫色。 2. 输入参数设置 提供了几个可调节的输入参数,用户能够依据自身需求进行修改: MAPeriod1 、

Receive notifications for multi-trendline or single trendline breakout. Yes! You heard us right! You will be notified the moment price crosses any and all the timeframe trendlines that you have chosen. 1. ADDING MULTIPLE OR SINGLE TRENDLINES IN THE SAME DIRECTION To trigger a stronger trading opportunity you can require that price breaks one or more trend lines of different timeframes in the same direction. To do this navigate to the timeframe for which you want to add a trendline and click
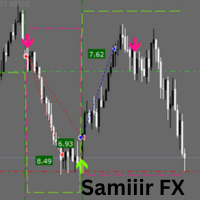
Samiiir FX:您的终极 MT4 精准盈利交易伴侣 使用 Samiiir FX 这款高级 MT4 指标提升您的交易水平。该指标旨在为外汇、商品和指数提供清晰、可操作的买入和卖出信号。Samiiir FX 专为追求精准和可靠性的交易者而打造,结合了先进的市场分析、直观的可视化效果和强大的风险管理工具。无论您是寻求快速盈利的剥头皮交易者、追求稳定性的日内交易者,还是着眼于更大波动的波段交易者,Samiiir FX 都是您交易工具箱的完美补充。 Samiiir FX 不仅仅是一个指标,它是一个完整的交易解决方案,让您能够自信且有条不紊地进行交易。其独特之处在于: 清晰且可操作的信号: 通过直接在图表上绘制的绿色向上箭头(买入信号)和粉色向下箭头(卖出信号),立即发现高概率的交易设置。 内置风险管理: 自动显示止盈 (TP) 和止损 (SL) 水平作为虚线,帮助您轻松管理风险并最大化回报。 高度可定制: 通过可调节的信号灵敏度、风险回报率和止损水平设置,根据您独特的交易风格定制指标。 适用于多种市场: 专为在多种工具上运行而设计,包括 XAU/USD、EUR/USD 和
1. 结构清晰,模块化设计 代码通过注释和函数划分,将不同功能模块(如初始化、EMA 计算、信号检测)分离,逻辑层次分明,易于阅读和维护。 核心功能(如计算最大值、平均值、平均偏差、检查均线汇聚)被封装为独立函数( GetMaxMin 、 CalculateAverage 、 CheckConvergence 等),减少了代码冗余,提高了可重用性。 2. 参数化配置,灵活性高 所有周期参数( P1 到 P7 )和偏差范围( Deviation )均通过 input 关键字定义,用户可在 MT4 界面自由调整,适应不同交易策略和市场环境。 这种设计使得指标具有高度灵活性,无需修改代码即可适配多种交易场景。 3. 多条件信号判断,提高准确性 信号检测不仅基于均线汇聚(通过平均偏差与平均值的比例判断),还结合了均线方向(向上或向下)以及关键均线的穿越条件(如上穿 / 下穿 60 日均线)。 多条件过滤机制减少了单一条件可能产生的误信号,提升了交易信号的可靠性。 4. 效率优化 使用 IndicatorCounted() 函数优化计算过程,避免重复处理已计算的 K 线,提高了指
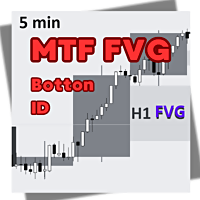
简要介绍 FVG mtf btn:
“ FVG mtf btn ”指标是一种技术分析工具,用于识别和显示图表上的公允价值缺口 ( FVG )。 FVG 是价格不平衡的区域,市场快速波动,在价格水平之间留下缺口,这些缺口尚未经过市场充分测试。此类缺口通常成为交易者感兴趣的领域,因为价格往往会返回这些区域以“填补”它们,然后再继续波动。
该指标支持多时间范围 ( MTF ) 分析,允许您在较低时间范围图表(例如 M15)上显示较高时间范围(例如 H1、H4)的 FVG 。它提供三种操作模式:
**扩展模式 (MODE_EXTENDED)**:FVG 向右延伸,直到价格测试缺口或满足用户定义的条件。 **原始模式 (MODE_ORIGINAL)**:FVG 在蜡烛之间形成缺口的位置显示为静态矩形。 **关闭模式**:所有 FVG 显示均已禁用。图表很干净。 该指标还提供视觉自定义、通知和过滤选项,使其更加用户友好并适应不同的交易策略。
有关 FVG mtf btn 的更多信息:
FVG 是价格行为交易中的一个关键概念,尤其是在智能货币概念 ( SMC ) 和内圈交易者 ( ICT
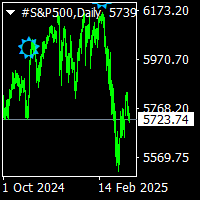
Star arrows indicator is no repaint arrow sindicator. it is sutable for experienced trader and beginners. it work all timeframe and all pairs. easy to to use.gives star arrows top and bottoms. if arrow up the price that is sell signals. if arrows below prices it is buy signal. cnt is bars back number and settled default 1000. it can be raised acording to charts bar numbers.

The presented indicator is the author's implementation of the Double Smoothed Stochastic oscillator developed by William Blau and Walter Bressert. The calculation of values is in many ways similar to the calculation of the classic stochastic oscillator. The indicator takes into account the location of the current price relative to local highs/lows. The indicator gives signals about changing its direction and/or about entering/exiting the overbought/oversold zone. The signal is given after the

波浪同步器是波浪分析的可视化指标。结合蜡烛图运动序列并构建定向波浪,与市场一起产生同步运动。
每个波浪的开始都以信号箭头开始,还有警报。
该指标永远不会重绘或移动先前历史记录上的箭头。
信号箭头出现在蜡烛图的收盘价。
适用于任何交易工具和时间框架。
易于使用和配置,仅包含 2 个输入参数:选择与所选参数一起使用的时间框架和计算 MA 线的方法。
推荐的参数可以移动 1-2 个周期。
红色箭头方向用于购买交易资产。
蓝色箭头方向用于出售交易资产。 ----------------------------------------------------------------------------------------------

Direct Scalping MT4 shows the most SUPER SUPER SUPER EARLY opportunity to scalp the market. Do entry as early as possible, as soon as the first sign appears. It plays sound alert so that you can wait the moment while do something else. Remember to cut loss below the '' area. Yes, it is not stop loss but cut loss (exit on candle close).
Made for M1 timeframe, but higher is good too.
My new favorite setup: M3 using 8 indicators with different parameters: 11, 18, 25, 32, 39, 46, 53, and 60. Comb

Pro Period Separators For MetaTrader 4 The built-in period separators feature doesn’t allow users to specify the time period, so you can use this indicator to create advanced period separators, you can add daily, weekly, monthly, yearly separators on any time frame. Default Inputs DAILY SEPARATOR SETTINGS show daily separators = Yes hour of the separators = 04 minute of the separators = 00 color of the separators = Silver width of the separators = 1 style of the separators = STYLE_DOT WEEKLY_SE

"PACIFIC BREAKOUT" — Catch a Wave of Profit on Breakouts of Sessions! Are You Tired Of Missing Key Breakouts?
Manual calculation of levels, dozens of indicators and missed signals will be a thing of the past! What Does Pacific Breakout Do? This is your personal analytical robot that: The pulse accumulation range of the Pacific session is automatically determined (1:00 GMT+3 Sydney). - We analyze the second candle after the market opens, because the extended spread does not giv
Upgrade your charts instantly. Smart Round Levels draws powerful .00 and .50 round-number zones automatically on any forex pair — including JPY pairs like USDJPY — and features a dynamic live price tracker that follows price in real time. Features: • Automatic round-number detection (.00 & .50) • Auto-adjusts for JPY and non-JPY pairs • Perfect precision with customizable spacing & scale • Fully customizable colors, line widths, font sizes • Real-time yellow price label tha

TRADE HELPER: Multi-Timeframe Trading Assistant TRADE HELPER is a comprehensive multi-timeframe trading assistant designed to enhance your trading decisions by providing real-time analysis across multiple timeframes. This powerful indicator combines RSI analysis, trend strength evaluation, and advanced signal generation to help traders identify high-probability trading opportunities. Key Features Multi-Timeframe RSI Analysis Displays RSI values across seven timeframes (M1, M5, M15, M30, H1, H4,

Smart Daily Levels – Extended Highs & Lows from Past Days
Never lose sight of market structure again. Smart Daily Levels automatically draws horizontal lines at the high and low of each day — and extends them forever to the right side of your chart.
Perfect for traders who use: • Support & resistance • Breakout traps • Liquidity zones • Smart Money / price action strategies Core Features • Daily high & low lines from the past X days (default: 10) • Lines start at each day’s open an
Signal Quality Dashboard – Trade Like a Pro Tired of the BS and unreliable signals? It’s time to break free from mediocre systems. The Signal Quality Dashboard is built exclusively for renegade traders who demand real, actionable data. This isn’t your average trading robot—it's a no-nonsense, MQL5-powered solution that combines RSI, MACD, Bollinger Bands, ADX, Volume, and Price Action into one ultra-intelligent dashboard. What It Does:
• Real-Time Signal Scoring: It crunches multiple indicator

Scalper Elite Dashboard – The Ultimate Precision Entry Indicator (MT4) Version: 1.00
Type: Non-Repainting Multi-Logic Signal System
Platform: MetaTrader 4
Dashboard-based, No External API, Lightning Fast Execution What is Scalper Elite Dashboard? Scalper Elite Dashboard is a high-frequency, non-repainting trading indicator designed specifically for scalping, intraday, and short-term swing trading. It combines 6 powerful technical analysis components into a single ultra-visual and inte
Big Picture Range Assistant – Daily, Weekly & Monthly Range Lines
Master multi-timeframe context in one glance. The Big Picture Range Assistant indicator overlays your chart with dynamic historical high/low levels from the daily , weekly , and monthly timeframes — using progressively darker shades to show how recent or distant each range is.
Perfect for: • Reversal traders • Range traders • Smart Money / SMC strategies • Swing and position traders who rely on big-pictur

Full Functionality of the MT4
"TWR MTF BREAKOUT" INDICATOR
FOR APP SOURCE CODE: t.me/KingRennie
APP SOURCE CODE WORKS FOR MT4 AND MT5
FEE =$1500 The MT4 " TWR MTF BREAKOUT " INDICATOR is a comprehensive trading tool designed to help traders make informed decisions by utilizing Fibonacci levels, time-based analysis, and demarcating major trading sessions. This INDICATOR is ideal for both novice and experienced traders who want to enhance their trading strategies with advanced technical anal

The presented indicator sets dynamic support/resistance levels on the price chart. The indicator is easy to use and can be useful for both beginners and professional traders. The middle line of the indicator (Central level) helps to identify the current trend: If the closing price is above the central line - the trend is ascending. If the closing price is below the central line - the trend is descending. The presented indicator allows implementing another version of the trading strategy, which w

A digital candlestick chart displays custom-colored candles on a black background. The chart features: • Green candles representing bullish momentum • Red candles showing bearish momentum • Orange candles signalling neutral or conflicting signals
We have attached images of our settings on our charts, in addition to this, make sure the chart is displaying the line chart (alt + 3).
高低点追踪器 是任何重视精确度和清晰度来识别关键价格水平的交易者必不可少的指标。此工具专为使用机构策略(如 ICT(内部交易者) 、 BTMM(银行交易做市商) 和 SMC(智能货币概念)) 的交易者而设计,通过将重要的 高点和低点 直接绘制到当前图表上,简化了多时间框架分析。无论您是剥头皮交易、日内交易还是波段交易,此指标都可让您即时访问主要支撑位和阻力位,而无需不断切换图表。
谁需要这个指标? 此工具非常适合以下交易者: 对于低时间范围条目使用更高的时间范围偏差(例如 ICT 和 SMC)。 需要确定止损追踪和陷阱设置的流动性区域。 依靠关键支撑/阻力位来下订单。 当价格触及机构水平时需要实时警报。 在 1m/5m 图表上交易时,优先考虑多时间框架精度。
它为什么重要?
主要时间范围内的高点和低点通常充当磁性价格区,吸引大量市场活动。这些水平通常是机构订单堆积的地方,形成推动价格大幅波动的流动性池。做市商经常瞄准这些区域来寻找止损点或启动趋势逆转,为精明的资金交易者创造了理想的设置。此外,突破和重新测试通常发生在这些价格点附近,提供高概率的进入机会。通过在从 M5

Moving MinMax is a custom trend indicator that helps you easily identify the current market direction , reversals , and high-probability trade setups . This tool uses a unique calculation method that measures price pressure from both buyers and sellers, helping you see who is in control and when the market is likely to change direction. Unlike basic oscillators or moving averages, this indicator computes trend likelihoods using a distribution-based exponential model applied over a moving price w
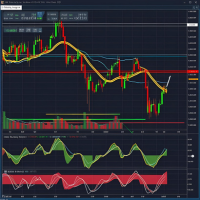
How to Use this indicator-: 1. Trend-Following Strategy Objective : Enter trades in the direction of the trend when the Net Score and Signal Line confirm a strong trend. Identify the Trend : Look at the Net Score in the separate window: If the Net Score is above 0 and rising, the trend is bullish. If the Net Score is below 0 and falling, the trend is bearish. Confirm with the LazyLine on the main chart: Green LazyLine indicates an uptrend. Red LazyLine indicates a downtrend. Entry : Buy (Long)

Overview:
"TrendLine Alerts" is a dynamic, multi-functional trading tool designed to monitor and alert traders in real-time when price action touches or breaks critical technical levels. Built for precision, it seamlessly tracks trendlines, horizontal support/resistance, vertical time-based lines, and equidistant channels , ensuring you never miss a key market movement. Whether you’re scalping, swing trading, or managing long-term positions, this indicator acts as your 24/7 market sentinel. K
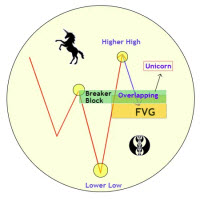
Unicorn Model ICT Indicator — Smart Trading with Precision The Unicorn Model ICT Indicator is a powerful and intelligent tool designed for traders who follow Smart Money Concepts (SMC) and Inner Circle Trader (ICT) methodologies. This indicator simplifies complex price action by visually identifying key market structures and providing high-probability trade setups. Key Features: A Bullish Unicorn Pattern A Lower Low (LL), followed by a Higher High (HH) A Fair Value Gap (FVG), overla
Fs_mod стрелочный индикатор, указатель направления тренда. Индикатор НЕ перерисовывает и не изменяет свои показания, стрелки появляются по закрытию бара и остаются на своих местах. При появлении стрелки дает несколько типов оповещений. Индикатор предназначен для использования на следующих финансовых инструментах: - Forex - индексы - акции. Рекомендуется использовать на таймфреймах не ниже 15 мин


Multi Stochastic Display – The Ultimate MTF Trade Scanner for Forex & Crypto Multi Stochastic Display is a powerful multi-timeframe trading tool that gives you a professional edge in analyzing market momentum. Designed for both Forex and Crypto traders, this clean and modern indicator visually presents BUY and SELL signals across 9 timeframes (from M1 to Monthly) for over 25 instruments. Its intuitive panel automatically ranks all instruments based on their strongest stochastic trend – whethe

多时间框架 K 线 指标是一款强大的可视化工具,旨在帮助交易者将较低时间框架的分析与较高时间框架的结构相结合。该指标可直接在当前图表上绘制所选较高时间框架(1 小时、4 小时、1 天等)的 K 线图,让您无需切换图表即可更清晰地了解整体市场走势。
谁需要这个指标? 此工具非常适合: 智能货币概念 (SMC) / ICT 交易者依赖较高的时间框架偏差,同时在较低的时间框架上执行交易。 黄牛和日内交易者希望与每日或时段的动量保持同步。 想要快速浏览 HTF 结构同时在较小图表上细化条目的波段交易者。
无论您交易的是价格行为、供需还是趋势跟踪系统,该指标都能确保您的入场得到更高时间范围的强度支持。
策略改进 多时间框架蜡烛图有助于改善: 方向偏差确认——与主导趋势或市场结构保持一致。 精炼入场点——确定最佳入场区域(例如,5M 图上的看涨日线图内)。 假突破过滤——仅按照 HTF 蜡烛的方向进行交易,以避免陷阱。 HTF 流动性意识——从更高的时间范围内发现潜在的灯芯和反应区。
主要特点: 选择任意更高的时间范围进行覆盖。 自定义蜡烛颜色、边框和填充设置。 将 MTF 蜡烛显示在常
Supply demand zone with added Alerting system. Why this supply demand indicator is different? Zones are not traditional zones. these are KIRI zones. these are high probability zones where market reacts no matter how much. Most people including me have been missed out of trade because we somehow got distracted. no worries, i have added an alert to our zones now. (Metatrader doesn't show alerts in strategy tester) Most people dont know when to enter the market when it comes to zone based trading.

PinBar Hunter – Smart Pin Bar Indicator with Built-in Control Panel and Signal Filters PinBar Hunter is a powerful tool for technical traders that automatically detects classic Pin Bar patterns (reversal candles) on the chart.
It’s designed for price action strategies, candlestick analysis, and trading around key support/resistance levels. Indicator Features: Detects classic Pin Bars (reversal candlestick patterns)
Works on any timeframe and instrument
Suitable for trend-following an
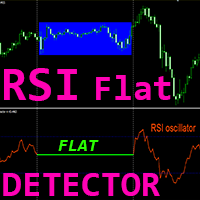
Crypto_Forex 指标“RSI 平缓探测器”是一款高效的交易辅助工具!无需重绘。 我推荐您使用这款适用于 MT4 的出色指标来升级您的交易方法。
- 指标在图表上显示价格平缓区域。它具有“平缓敏感度”参数,用于平缓检测。 - “RSI 平缓探测器”可用于价格行动入场确认,或与其他指标结合使用。 - 您可以将其用于趋势跟踪系统,以检测平缓区域并避免在该区域交易。 - 您可以将其用于反转剥头皮交易 - 从平缓区域进行反转交易。 - 有很多机会可以使用“RSI 平缓探测器”替代标准 RSI 振荡指标。 - RSI 本身是最受欢迎的交易振荡指标之一。它对于背离检测非常有用。 - 非常适合在强超买区域(高于 70)进行卖出交易,在强超卖区域(低于 30)进行买入交易。
点击这里查看高质量的交易机器人和指标! 这是仅在 MQL5 网站上提供的原创产品。
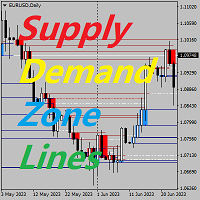
供求区关键价指标 背景 系统自动搜索 K 线中的供求区域,并画出实时的关键价格线,交易者可以根据价格交易线进行交易。 主要特点 系统是自动搜索 K 线中的供求区域的,系统同时会画出实时的关键价格线,交易者可以根据价格交易线进行交易。所以使用供求区策略的交易员无需再耗费时间去寻找标识供求区域,而可以关注在价格对供求区域以及关键价格的反应,制定适合自己的交易策略。 然而供求区策略本身就是一个在震荡时期更加有效的策略,所以当市场呈现强大趋势的时候,应当小心使用,或者按顺应趋势的方向使用指标提供的建议。 范围 ShowZones :是否显示供求区域 DrawLines: 是否显示关键价格 SupplyZoneLineColor: 供给区价格线颜色 DemandZoneLineColor: 需求区价格线颜色 PenatratedLineColor: 被击穿价格线颜色 执行 只需将指标附加到图表上即可。 请给我您宝贵的意见,让我改进指标。 如有问题,联系微信 imlizard

Tento jedinečný indikátor vám ukazuje rozsah, v ktorom sa pohybujú maloobchodní klienti. Spravidla, ak sa cena udržiava na priemernej úrovni, neskôr dosiahne vrchol a potom sa vráti na opačnú stranu. Indikátor je vhodný pre všetky grafy s možnosťou nastavenia pákového efektu, teda ak zoberieme do úvahy, že retailoví klienti sa pohybujú na trhu s pákovým efektom 500 až 100 páka. Indikátor je vhodný pre väčšie časové rámce H1,H4... s väčšími pákami 100,50,25 ale aj pre malé grafy M5,M15 s pákami

产品名称 A arca 主要功能 自动识别关键区间
A arca可自动检测并标示支撑和阻力水平,帮助交易者更轻松地发现潜在的买卖点。 清晰的买卖信号
提供清晰的买入和卖出标记,帮助交易者定义进出场的最佳时机,提高交易决策的效率。 多周期分析
整合不同周期(如M5, M15, H1等)的图表数据,有助于从多角度洞察市场趋势,提高分析的准确度。 可自定义且易于使用的界面
允许用户根据个人需求和策略定制颜色、线条及水平,让技术分析环境更加个性化。 风险管理工具
通过识别可能出现的反转区域,A arca帮助交易者更轻松地设置止损与止盈,提升风险管理的有效性。 主要优势 决策更迅速、更准确
自动识别关键区域,减少手动分析的时间,提高决策速度与自信度。 节省时间和精力
清晰直观的可视化信号,让交易者可将更多精力投入策略和风险控制,而非纠结于繁琐的图表分析。 提升交易成功率
多周期分析与精准信号结合,能有效提高交易成功率并增强整体绩效。 兼容多种交易风格
无论是日内交易、剥头皮交易还是波段交易,A arca都能满足不同投资者的需求。 与众不同之处 智能化自动分析
采用高级算法自动
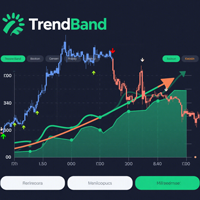
TrendBand Navigator Pro —— 永不重绘的多周期趋势交易系统,独创的多维趋势带算法,为您提供清晰的箭头信号
大箭头定方向 小箭头抓买卖
核心优势 智能过滤噪音 :融合波动率自适应技术,有效规避虚假突破,仅在趋势动能强劲时触发箭头信号 多时间框架兼容 :无论日内短线或波段交易,自动适配1分钟至月线图,满足不同策略需求 视觉化K线图表 :双色K线,辅助判断趋势延续性 零延迟箭头信号 :提前标注潜在反转点,双色箭头醒目提示多空转换
交易策略 第一步:双重验证开仓 1. 大箭头定趋势 - 等待趋势启动信号(彩色趋势带+大箭头) 2. 小箭头抓时机 - 当同方向小箭头出现时立即进场 第二步:智能分批离场 • 保守策略 :反向箭头出现时全仓平仓 • 激进策略 :盈利20-30点后平半仓,剩余仓位带移动止损直至趋势反转

The indicator is based on the calculation of liquidity on the market and thus shows where the market can most likely turn.. It shows the places of liquidity where the price will reach sooner or later... The indicator can be set to several types of liquidity and therefore can display several levels on the graph.. It is a unique tool that can help you very well in your trading The indicator is suitable for currency pairs with the most liquidity (Forex,EURUSD,GBPUSD...) The indicator is suitable fo

Gold Strength Index Pro (GSI Pro) is an indicator designed to analyze gold's strength across multiple currency pairs. It aggregates weighted price data from 7 XAU pairs (e.g., XAUUSD, XAUEUR) over a user-defined lookback period, calculating a composite strength value.
Key features include: Color-Coded Histogram : Displays bullish (green) and bearish (red) - momentum based on a threshold zone (±0.2 default). Smoothed Lines : A gold-colored EMA (SmoothPeriod) reduces noise, while a DodgerBlue s

The Quasimodo Pattern Indicator is no more difficult than the Head and Shoulders. Still, only a few traders know about it, and some even confuse one with the other. However, this is not a reason to avoid this tool in your forex trading strategy. Features: Automatic Detection: The indicator automatically scans for valid QM patterns across any timeframe, reducing the need for manual chart analysis. Visual Highlights: Clear and customizable on-chart drawing of shoulders, heads, and breako

The trend indicator processes each bar of the chart and displays signal arrow on it. In the default display settings: red arrow - sell signal blue arrow - buy signal If the arrows are missing on some bars, this means that the algorithm has not identified a consensus on the signal on this bar. The indicator does not have any technical settings for the algorithm. The process of finding a consensus is fully automated.
For ease of visualization on charts, user settings allow you to set the size of

MTRade is a professional arrow indicator based on the classic Parabolic SAR algorithm. It automatically detects the moments of trend direction change and displays clear signal arrows on the chart: up (buy) and down (sell).
Basis: original Parabolic SAR algorithm with full adaptation for visual display by arrows;
Signals: up arrow — possible up reversal (buy); down arrow — possible down reversal (sell);
No redrawing: signals are recorded only after a confirmed reversal, excluding "jumps" and

iMRPHN: Supertrend & Swing Reversal Indicator A trading indicator that integrates Supertrend zone detection with swing-based entry logic. Designed for traders who apply both trend-following and counter-trend approaches. The indicator works across multiple timeframes and offers several helpful visual and alert-based features. Key Features: Automatic identification of swing high and swing low levels Automatic Fibonacci retracement Supertrend reversal zone visualization in real-time Highlights are

Ultimate Trend Rider
Ride the markets with confidence — your all‑in‑one trend‑capturing powerhouse.
Key Features & Benefits Adaptive Multi‑Filter Engine
Combines Supertrend, ADX, ATR volatility, and volume filters to ensure you enter only the strongest, most reliable trends. Multi‑Candle Confirmation
Eliminate “false start” signals: require multiple consecutive closes above/below your trend line before triggering an entry. Customizable Take‑Profit Alerts
Three levels of RSI‑based “TP” mar
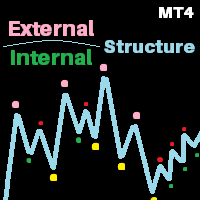
Here is the V3 of perfect market structure. Whats new? Coded based on ICT rules. No more trend confusions...-- Added labels to show current trend No more timeframe juggling and missing out important points, -- Now You can add indicator multiple times to mark multi timeframe market structure on the same chart window( 1D market structure on 4H or may be 4H market structure on 15 min timeframe and more.....) No more waiting in large range as sometimes market makes huge ranges and starts making im
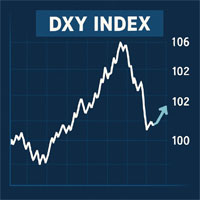
DXY Index indicator to help predict USD effect to your trade. DXY Index will help to see the power of USD.
For example if you trade XAUUSD and the DXY Index weaker, it could be the XAU will be bullish.
The same if DXY Index getting stronger, it could be that XAU will be bearish. I hope this indicator will help many trader to have better position to trade. Use this indicator wisely.

Core Drift Index: Your Reliable Guide in the World of Trading Core Drift Index is an innovative trend indicator designed for precise detection of market directions and reversal points . This powerful tool enables traders to optimize their investments , minimize risk, and maximize profit. Key Features and Benefits Intuitive Trend Detection Core Drift Index clearly shows trend direction, helping traders make timely entry and exit decisions. High Probability of Success With its high accuracy
Warp Range Sensor: The Color of Your Trend Warp Range Sensor is a trend direction indicator that visually displays the current market condition by coloring bars red and blue based on trend direction. What Does Warp Range Sensor Do? Identifies the Current Trend Direction Blue bars indicate an uptrend Red bars signal a downtrend Universal Application
Compatible with all currency pairs and timeframes , from short-term scalping to long-term trading. Powered by Market Context & Historical Data
W
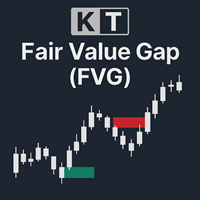
KT Fair Value Gap(FVG)用于识别并高亮显示市场中暂时性的价格不平衡区域。这些缺口通常作为价格延续的潜在区域,有时也可能成为价格反转的起点(也称为反向FVG)。 多头FVG: 以绿色方框显示,这些缺口通常是支撑区,价格可能从此恢复上涨。一旦被回补,也可能成为潜在的反转点。 空头FVG: 以红色方框显示,这些缺口是阻力区,价格可能从此继续下跌。与多头缺口类似,回补后也可能发生趋势反转。
功能特色 简洁清晰的设计: 该指标专为清楚显示FVG区域而设计,帮助交易者专注于关键信息,避免图表混乱。 可视化仪表盘: 屏幕上的小面板可快速显示已回补与未回补FVG的百分比,帮助您快速洞察市场结构。 高度可定制: 可自由调整FVG的阈值水平、已/未回补缺口的可见性,还可以根据个人风格自定义颜色与线条粗细。 即时提醒: 每当检测到新的FVG时,您将立刻收到通知,确保不错过任何潜在交易机会。
什么是已回补的FVG
当一根K线收盘价低于FVG区域下边界时,多头FVG被视为已回补。 当K线收盘价高于FVG区域上边界时,空头FVG被视为已回补。
什么是未回补的FVG
只要没有K线收盘在其下

The Great Oracle – Your Guide to Consistent Trend Trading Success
The Great Oracle is a powerful trend-following indicator designed for traders who seek precision in their entries and exits. Whether you’re navigating trending markets or spotting opportunities in ranging conditions, The Great Oracle provides you with accurate signals and a second chance to join strong market trends. It’s the ultimate tool for traders who want to maximize profits while keeping risks manageable.
Key Features:
•
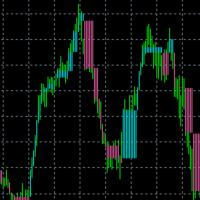
When there is no position, when changing the color, you can consider opening an order. With the fluctuation of the market, when the current color changes again, you need to close the position and leave. Suitable for different cycles, the trading rules are simple and require friends to explore on their own.
I hope friends who use this indicator can make a lot of money, rolling bigger and bigger like a snowball. thank you!
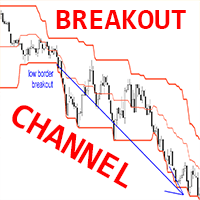
Crypto_Forex MT4 突破通道指标,无需重绘。
- 该指标可作为基于高/低突破的完整交易系统使用。 - 它只有一个参数 - HYSTORY DEPTH,它反映了指标考虑的 K 线数量。 - HYSTORY DEPTH 参数的推荐值:时间范围:D1 - 20(一个月)、H4 - 30(一周)、H1 - 24(一天)。 - 突破通道由三条线组成:高边界 - 最近 N 个(HYSTORY DEPTH 参数)K 线的最高价格,低边界 - 最近 N 个(HYSTORY DEPTH 参数)K 线的最低价格,以及中线。 - 指标可与其他指标/价格行为模式结合使用。 - 突破通道指标的使用示例请参见图片。
点击这里查看高质量的交易机器人和指标! 这是仅在 MQL5 网站上提供的原创产品。

这个指标是为 激进的 scalping 和 快速进入二元期权 设计的 ,它会在 每根蜡烛图 上生成信号,帮助你随时了解市场的动向。
加入 Happy Scalping 频道: MQL5
不重绘 :当前蜡烛的信号在 实时 生成,这意味着它可以在蜡烛形成过程中发生变化,具体取决于价格是上涨还是下跌,与前一根蜡烛的收盘价相比。
但是,一旦蜡烛 关闭 ,信号的颜色就会 完全固定 。它不会变化、消失或移动。 你看到的就是最终的信号。
为什么这样设计?
因为许多 scalper 重视即时获得信号,特别是在 价格突破或剧烈波动 时,他们可以在价格波动的同一秒钟内抓住这些快速的点数。
另一方面,也有一些交易者更喜欢等待 蜡烛收盘后的确认 ,他们也可以完美使用这个指标。
这两种方法都是有效的 ,该系统可以适应这两种风格。
重要提示: 查看视频,了解如何在实时市场中操作, 如何入场交易,何时交易,何时最好避免交易 。
该指标非常强大 ,但和任何工具一样, 理解其逻辑非常重要 ,才能最大化利用它。 如果有任何疑问,请随时联系我。我会帮你解答。

Crypto_Forex MT4 指标“ RSI SPEED ”——卓越的预测工具,无需重绘。
- 该指标基于物理方程计算。RSI SPEED 是 RSI 本身的一阶导数。 - RSI SPEED 非常适合顺着主趋势方向进行剥头皮交易。 - 建议结合合适的趋势指标使用,例如 HTF MA(如图所示)。 - RSI SPEED 指标显示 RSI 本身方向变化的速度——它非常敏感。 - 建议将 RSI SPEED 指标用于动量交易策略:如果 RSI SPEED 指标的值小于 0:价格动量下降;如果 RSI SPEED 指标的值大于 0:价格动量上升。 - 指标内置移动端和 PC 端警报。 ................................................... 点击这里查看高质量的交易机器人和指标! 这是仅在 MQL5 网站上提供的原创产品。
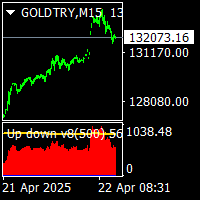
Up down v8 indicator is no repaint counter trend indicator . it try to find market up down points. it works all timeframes and all pairs. suitable for beginner and experienced trader. there is wave and c values to set defaults. minimum processed value cnt can be equal to wave value. traders can change them suitable up down points on different time frames. indicator use moving averages histograms and volatilty trigger. when red histogram is over volatility level that is tops. . when blue histogr

Convenient Dashboard for Moving Average Crossover Trading Strategy . On the panel, numbers display how many candles ago a signal occurred. The number 0 means the signal is on the current candle (it may disappear if the crossover does not hold). The number 1 means the signal was on the previous candle (arrows remain, as moving averages have confirmed the crossover). Moving averages can optionally be added, but the indicator works without them. Advantages of the indicator : Automa
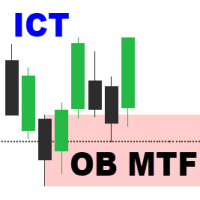
Order Block Multi Timeframe The Order Block Multi Timeframe is a powerful tool for Smart Money Concept (SMC) traders, combining high-accuracy Order Block detection with real-time Break of Structure (BOS) and Change of Character (CHoCH) analysis across multiple timeframes. Smart Money Insight, Multi-Timeframe Precision This indicator automatically identifies institutional Order Blocks —key price zones where large players have entered the market—and plots them directly on your ch

伦敦交易时段突破策略指标 专为遵循 ICT(内部交易者) 和 智能货币概念(SMC)的 交易者设计,专注于伦敦交易时段内基于交易时段的 流动性追逐、杀伤区 和 做市商行为 。该工具捕捉格林威治标准 时间00:00 至 07:00 之间的最高价位和最低价位,这通常被称为 伦敦杀伤区 或 做市商区间 。它可以帮助交易者识别机构活动和波动性激增最常出现的潜在突破区域。
该指标以清晰的图形直观地突出显示 交易时段、价格区间、公允价值缺口 (FVG) 和 突破水平 。它支持分析 流动性波动、区间盘整 和 价格突然上涨等 伦敦交易时段的核心行为。通过与流动性区域和市场结构变化保持一致,交易者可以更好地了解价格可能上涨或反转的位置。
时段高/低线和突破信号提供了一个清晰的框架,用于识别基于市场结构、突破阻力、流动性空缺和不平衡区域的设置。此策略对于那些在亚洲时段寻找区间形成并等待价格在伦敦开盘时突破或扫荡区间的交易者尤其有用。交易者可以通过观察流动性的看涨或看跌波动以及对关键机构价格水平的反应来预测市场走势。
此工具非常适合:
使用智能货币概念(SMC)的交易者 ICT战略追随者 伦敦交易时

纽约区间指标 是一款基于交易时段的分析工具,专为运用 ICT(内部交易者) 概念、智能货币交易 和 机构价格行为方法的 交易者而开发。该指标专为纽约交易时段设计,捕捉格林威治标准时间(GMT) 12:00 至 14:00 之间的价格区间,这一关键时段与 伦敦收盘价 和 纽约开盘价 重叠。它能够识别 交易时段的最高价和最低价 ,检测 公允价值缺口(FVG) ,并突出显示潜在的 流动性扫荡区域 ,帮助交易者精准分析 做市商行为、交易时段区间突破 和 回撤机会 。
该策略专注于理解 纽约杀戮区 与 伦敦纽约交易时段 重叠 期间发生的 市场结构转变 以及 累积或分布模式 。该指标提供了一个结构化的可视化框架,用于使用 智能货币概念 解读图表,例如 结构突破(BOS)、市场结构转变(MSS)、位移蜡烛图、不平衡区域 和 流动性空缺 。该工具允许交易者分析 交易区间、 等待 流动性抢占 并监控 FVG的填充反应 ,使其非常适合 回撤入场、后期突破 和 反转设置 。
该指标适合那些希望利用 纽约交易时段 常见的高波动性和机构交易量的交易者。它支持分析 外汇交易周期 内的 价格走势 ,尤其

GoldStrike Momentum Trend Indicator - The Ultimate Forex Trading Tool Description: Introducing the GoldStrike Momentum Trend Indicator , a powerful and intuitive tool designed for traders seeking precision in their Forex strategies. Using a combination of momentum analysis and the RSI (Relative Strength Index) , this indicator provides buy and sell signals that help you identify optimal entry and exit points, improving your trading decisions. Perfect For: Day traders who need quick, precise sign

ICT伦敦开盘杀戮区指标 是一款基于 “智能货币” 的交易工具,专为遵循 ICT、SMC (智能货币概念) 等机构概念以及 基于流动性的市场结构策略的 外汇交易者设计。该指标重点关注伦敦开盘杀戮区,具体为格林威治标准 时间06:00 至 08:00 。由于亚洲交易时段和伦敦市场开盘之间的流动性重叠,该时段以波动性和价格错位而闻名。
此时间窗口通常充当高概率设置的 触发区 ,做市商在此触发流动性追寻。该指标会自动 标记“杀伤区”范围 ,并 识别前一交易日高点和低点的震荡 ,尤其是 亚洲交易日的震荡范围 。这些流动性震荡是许多ICT入场模型的关键组成部分。该工具可帮助用户分析价格在震荡后是否达到了 溢价 区或 折价区 ,从而更容易与 MSS(市场结构转变)、 结构突破 和 FVG(公允价值缺口) 等入场模式进行匹配。
该工具使用清晰定义的 时间框、区间高/低水平 以及 符号标记 来可视化交易时段,这些标记指示价格是否将流动性推高至区间上方或下方。这在根据 交易时段时间、流动性突袭 和 价格拒绝 识别交易机会时提供了高度的清晰度。FVG 区域检测 功能的加入进一步支持了那些在关

IMPULSE HUNTER Impulse Hunter 是一款动态交易指标,专为监控全球最活跃交易时段的价格波动而设计—— 亚洲 、 伦敦 和 纽约 ,并在 动量突破关键水平 时进行高亮显示。与其依赖猜测,交易者将获得 清晰的可视结构 : 基于交易时段的突破区域 、 分阶段的止盈目标 和 适应性止损水平 ,可根据每个货币对自动调整。 加入我们的频道: 了解新功能、优化和独家发布: https://www.mql5.com/en/channels/forexnewadvisor
快速联系,请通过 MQL5 用户名联系我: forexnewadvisor 工作原理 每个交易时段开始时: 指标会绘制一个参考框,捕捉该时段初始范围的最高点和最低点。 突破行为: 当价格向上或向下突破该框时,表示一个潜在新动能的开始。 进出场区域: Impulse Hunter 会标记可能的入场区域,并显示预设的出场点:TP1、TP2、TP3 和 SL。 视觉自适应: 指标会根据图表背景颜色自动调整,以确保清晰度,即使在深色模式下也是如此。 自动止损逻辑: 若启用,止损水平会根据所交易的货币对自动设置。 为
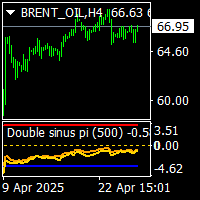
on back test use date.and not set too much back date. double sinus waves pi indicator is no repaint moving average and levels indicator. it works all timeframes and all pairs. it is combined with sinus wave and smoothed sinus wave indicator. and indexed to pi number over bought and oversell levels. it is easy to to use and suitable for experienced traders and beginners. cnt value has been set to 1000 bars.it can be increased acording to charts bar numbers. minimum cnt value mast be higher than
One of the advantages of the Arrow Tracker indicator is its vivid visual representation: Histogram Display: Situated beneath the main price chart, the indicator showcases a histogram. This allows for easy identification of market trends. Color-Coded Bars: Uptrends are demarcated with blue bars, whereas downtrends are depicted with pink bars. This differentiation assists traders in swiftly gauging the market’s directional momentum. Signalling Peaks and Bottoms: The histogram employs yellow

Индикатор нейтральной свечи — это инструмент технического анализа, который автоматически определяет зоны нейтральных свечей (neutral candlestick), появляющихся на ценовом графике. Эти зоны, как правило, указывают на неопределённость среди участников рынка и помогают заранее определить возможное направление дальнейшего движения цены. Основные функции: Определяет зоны, где появляются нейтральные свечи. Показывает вероятность движения цены вверх или вниз от этих зон. Помогает трейдеру более точн
MetaTrader市场是您可以下载免费模拟自动交易,用历史数据进行测试和优化的唯一商店。
阅读应用程序的概述和其他客户的评论,直接下载程序到您的程序端并且在购买之前测试一个自动交易。只有在MetaTrader市场可以完全免费测试应用程序。
您错过了交易机会:
- 免费交易应用程序
- 8,000+信号可供复制
- 探索金融市场的经济新闻
注册
登录