适用于MetaTrader 4的技术指标 - 15

Introduction Harmonic Patterns are best used to predict potential turning point. Traditionally, Harmonic Pattern was identified manually connecting peaks and troughs points in the chart. Manual harmonic pattern detection is painfully tedious and not suitable for everyone. You are often exposed under subjective pattern identification with manual pattern detection. To avoid these limitations, Harmonic Pattern Plus was designed to automate your harmonic pattern detection process. The functionality

CS ATR FIBO CHANNELS MULTI TIMEFRAME
Additional tool to trade with Cycle Sniper Indicator.
Cycle Sniper : https://www.mql5.com/en/market/product/51950 Indicator Draws Channels based on: - Cycle Sniper Price and Moving Averages - ATR Deviations - Fibonacci Retracement and Extensions
Features: - Multi TimeFrame - Full alert and Notification options. - Simple Settings - Finds the trend change or extreme reversals.
Inputs: - Arrow Mode: ATR Levels or Median Line If Median Line is selected ind

The ACB Trade Filter indicator provides a solution for filtering out the low probability trading setups in a trading strategy. The indicator uses a sophisticated filtration algorithm based on the market sentiment and trend.
Applications Works great with our indicator " ACB Breakout Arrows ". Filter out low probability signals from any indicator. Avoid overtrading and minimize the losses. Trade in the direction of market sentiment and trend. Avoid the choppiness in the market.
How to use Only L
- Real price is 80$ - 60% Discount (It is 30$ now) - It is enabled for 1 purchase. Contact me for extra bonus tool, instruction or any questions! - Non-repaint, No lag - I just sell my products in Elif Kaya Profile, any other websites are stolen old versions, So no any new updates or support. - Lifetime update free
Introduction Smart Money Concepts (SMC) strategy was initially popularized the Inner Circle Trading (ICT) method which is claimed to be the evolved version of the SMC. Essenti

Trend Lines Cross This indicator will alert you on any cross of a Trendline. You can draw up to two trend lines and form a channel, a pennant , a triangle or a simple trend and when the price crosses either trend line the indicator will provide you with alerts that you define plus an up or down arrow when the cross happened. How to: Draw the 1st trendline and name it tl1. Draw the 2nd trendline and name it tl2. Select which type of alerts you would like in the indicator properties and you a
FREE

See RSI values turned into colored candles
This indicator provides both colored candles and a colored moving average. 6 drawaing styles are provided to allow customization of the color coding.
Applying coding to the chart may help in conceptualizing price trend and impulse movements defined through RSI values.
Features - optional colored candles - optional colored ma - 6 draw styles; RSI slope RSI above/below overbought/oversold levels RSI above/below level 50 RSI above/below it's moving average
FREE

Smart Fibo Zones are powerful, auto-generated Fibonacci Retracements that are anchored to key market structure shifts . These zones serve as critical Supply and Demand levels, guiding you to identify potential price reactions and confirm market direction. Fibonacci calculations, widely used by professional traders, can be complex when it comes to identifying highs and lows. However, Smart Fibo Zones simplify this process by automatically highlighting order blocks and key zones, complete with St

Crypto_Forex 指标“分形趋势线”适用于 MT4。
- 此指标非常适合使用突破图形分析的交易者!!! - “分形趋势线”显示图形上升趋势(紫色)和下降趋势(红色)线。 - 上升趋势和下降趋势线建立在 2 个最接近的对应分形上。 - 指标有几个参数负责趋势线的颜色和宽度。 - 指标内置移动和 PC 突破警报。 ....................................................................................................................... 点击这里查看高质量的交易机器人和指标! 这是仅在此 MQL5 网站上提供的原创产品。
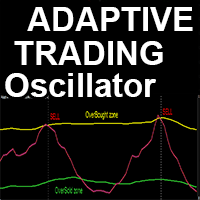
高级自定义加密货币外汇指标“自适应交易震荡指标”——MT4平台的高效辅助交易工具!
- 该指标是新一代震荡指标——请查看图片了解使用方法。 - “自适应交易震荡指标”具有可调节的自适应超卖/超买区域。 - 该震荡指标是一款辅助工具,用于在动态超卖/超买区域的出场点位上寻找精准的交易入场点。 - 超卖区域:绿线下方。 - 超买区域:黄线上方。 - 该指标非常适合与价格行为模式和趋势策略结合使用。 - 它比标准震荡指标更加精准。 - 该指标可用于任何时间周期。 - 内置PC和移动设备警报功能。 .................................................................. 点击这里查看高质量的交易机器人和指标! 本产品为MQL5独家原创产品。
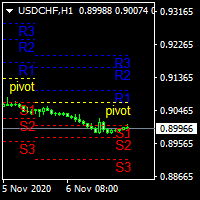
.................................if you need pivot point s levels............................... ............................this is a daily pivot point level creator........................... ...it is for daily pivots and show levels at times period H4 , H1 , M30 , M15 ,M 5... .................................also shows levels for 3 last days.............................. ................can use it with other indicators and see important levels...............
FREE

CustomMultiBarFractal Indicator Description
Overview The CustomMultiBarFractal indicator identifies and displays fractal patterns on price charts. Fractals represent significant price reversal points that can serve as signals for trading strategies.
Key Features - Detects fractals based on a user-defined analysis period - Displays upper and lower fractals with customizable colors - Allows offset adjustment from price extremes - Provides flexible visualization settings - Support
FREE

40% off. Original price: $50
Moving Average Trend Scanner is a multi symbol multi timeframe triple MA crossover dashboard that helps traders to monitor, and identify potential market trends from one chart. This panel scans 3 moving averages in up to 28 configurable instruments and 9 timeframes for triple moving average alignment and moving average crossover with a deep scan feature to scan all market watch symbols (up to 1000 instruments!).
Download Demo here (Scans only M1 and M5) Settings

通过 Consecutive Candle Indicator MT4 增强您的趋势识别能力,这是一款动态工具,旨在识别连续的看涨或看跌K线序列,为外汇、股票、加密货币和商品市场提供及时的趋势确认和潜在反转警报。在 Forex Factory 和 Reddit 的 r/Forex 等交易社区中备受推崇,并在 Investopedia 和 TradingView 的讨论中因其简化动能分析的能力而受到赞扬,该指标是寻求在波动市场中获得清晰信号的交易者的首选。用户报告称,使用较高的K线计数(例如,3-5根连续K线)时,检测持续趋势的准确率高达80%,许多人指出通过避免过早入场并专注于确认的动能变化,交易时机提高了15-25%。其优势包括精确识别趋势强度、可定制的警报实现免手动监控,以及用户友好的设计,无需额外工具即可增强剥头皮、日内交易和波段交易者的决策能力。 Consecutive Candle Indicator MT4 在用户定义的连续看涨K线数量(默认 N_CANDLE=3)后跟一根看跌K线后,在K线下方绘制绿色向上箭头(BuyBuffer),提示潜在的趋势耗尽或反转;在连续看跌K线
FREE

The SPV Volatility indicator is one of the most effective filters. Volatility filter. Shows three volatility options. The so-called limit, real, and the last most effective filter for the filter is the percentage filter. Percentage display of folatility shows the ratio of limit to real volatility. And thus, if we trade in the middle of the channel, then it is necessary to set a condition that the percentage is less than a certain indicator value. If we trade on the channel breakout - following t
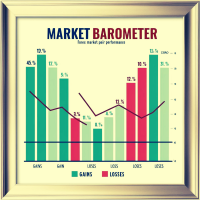
Market Barometer is a cheat code for trading, it acts as a "barometer" for market sentiment across various pairs, showcasing their changes. You can tell right away what to trade. You can trade trends or reversals. MT5 Version: https://www.mql5.com/en/market/product/127467 Market Barometer is a powerful tool designed to track and visualize the percentage changes across multiple currency pairs. By analyzing the price shifts of different forex pairs, it helps you understand how they are correlat

This indicator is designed to detect high probability reversal patterns: Double Tops/Bottoms with fake breakouts . Please read also the blog post " How To Yield Big Winners Consistently! " which explains the concepts behind the ULTIMATE Double Top/Bottom indicator and how you can use a top-down approach to get 15 - 20R winning trades on a regular basis . The provided video shows the maximum performance of the indicator. With maximum performance, I mean that this could have been the profit if you
ICT Template Indicator visualizes and automatically updates all important ICT elements for Scalpers, Day and Swing traders. It allows you too keep your chart clean and bring any elements by just one click to the side buttons. Thanks to mobile notifications on external liquidity levels, you will not miss any opportunity and you don't have to sit behind the screens whole day. Each element has fully customizable colours, width, line types, max timeframe to be shown etc... so you can really tweak y
该指标根据指定的系数找到一个低,高,极端的体积,并用指定的颜色绘制它们。 它取代了metatrader终端中的标准体积绘制功能。 蜡烛也可以在体积的颜色着色。 在具有极端体积的烛台上,确定最大水平体积(cluster/POC)。 根据它的位置(推动,中立,停止),集群也有自己的颜色。 如果集群在阴影中,并且蜡烛有一个极端的体积,那么我们得到一个逆转的箭头。 您可以在设置中启用警报。 此外,指示器中还有一个单独的选项,以阴影显示群集。
输入参数 。 (一些与颜色和视觉设置相关的跳过) 。
基本设置 。 Bars Count – 指标将工作的历史柱数 。 Data Source - 报价时间范围的选择。 如果您认为您认为过去的历史被截断和不完整,那么为您正在研究的仪器下载更多M1报价。 Vertical Step - 影响密度和垂直精度 。 Calc Bars - 用于体积计算的平均蜡烛数 。 Low Volume Factor - 我们固定最小音量的系数。 如果不需要,请将值设置为0 。 High Volume Factor - 我们固定大体积的系数 。 Extreme Volum
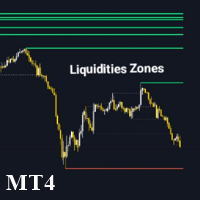
Liquidity Zone Detector 是一款高级技术指标,旨在通过使用 ZigZag 指标来识别和标注市场中的关键流动性区域。该工具通过在 ZigZag 检测到的高点和低点绘制趋势线来定位可能存在显著流动性的价格水平。Liquidity Zone Detector 帮助交易者根据流动性的累积或释放发现潜在的反转或趋势延续区域。 主要特点: 自动识别流动性区域 :在 ZigZag 指标识别的高点和低点绘制趋势线。 高级定制 :可配置流动性线的颜色、厚度和样式。 动态颜色变化 :当流动性水平被突破时,可选择更改线条颜色。 可调 ZigZag 参数 :调整 ZigZag 的深度、偏差和回溯步长以获得更精确的检测。 Liquidity Zone Detector 是分析市场结构并识别可能发生显著价格变动的关键区域的交易者的必备工具。
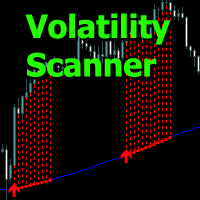
Volatility Scanner - 该指标分析市场状况,并用直方图显示波动率上升的区域。
该指标允许您确定入场和持仓的时机、顺势操作或观望的时机。
输入参数允许您根据所需的交易工具或时间范围独立配置指标。
适用于从分钟到日的任何时间范围。
提供多种警报类型。
所有指标信号均不会重新绘制且无滞后,在K线收盘时显示。
适用于从剥头皮交易到日内交易的任何交易系统。
指标工作原理
该指标包含一条移动平均线,并以此为基准进行进一步计算。“ Moving Average Period ”参数可以通过更改趋势方向的周期进行调整。 垂直蓝线表示熊市中波动率的上升。 垂直红线表示牛市中波动率的上升。 “ Candles Calculation ”参数用于更改用于计算波动率的K线数量。

Introduction RSI divergence is a main technique used to determine trend reversing when it’s time to sell or buy because prices are likely to drop or pick in the charts. The RSI Divergence indicator can help you locate the top and bottom of the market. This indicator finds Regular divergence for pullback the market and also finds hidden RSI Divergence to show continuing trend. This indicator shows divergence on the RSI that is a strong hint for an excellent entry point and finds immediately with
FREE

Crypto_Forex MT4 指标“趋势平直柱状图”,无需重绘。
- 趋势平直柱状图指标非常灵敏,比任何标准移动平均线都更高效。 - 它旨在显示当前市场状况:平缓、上升趋势、下降趋势。 - 指标有三种颜色:黄色表示平缓市场状况,红色表示下降趋势,绿色表示上升趋势(可在设置中更改颜色)。 - 提供移动端和 PC 端警报。 - 此指标可与其他交易方法结合使用,例如价格行为、剥头皮交易、动量交易和其他指标。 ................................................................................................................. 点击这里查看高质量的交易机器人和指标! 这是仅在 MQL5 网站上提供的原创产品。

本指标 基于 Zigzag 基础上... 增加了: 1.增加了箭头指示,使图表更鲜明 2.增加了价格显示,使大家更清楚的看清价格. 3.增加了报警等设置,可以支持邮件发送 原指标特性: 1.基本的波段指标构型. 2.最近的2个ZIGZAG点不具有稳定性,随着行情而改变,(就是网友所说的未来函数) 3.原指标适合分析历史拐点,波段特性,对于价格波动有一定的指导性.
Zigzag的使用方法一 丈量一段行情的起点和终点 (1)用ZigZag标注的折点作为起点和终点之后,行情的走势方向就被确立了(空头趋势); (2)根据道氏理论的逻辑,行情会按照波峰浪谷的锯齿形运行,行情确立之后会走回撤行情,回撤的过程中ZigZag会再次形成折点,就是回撤点; (3)在回撤点选择机会进场,等待行情再次启动,止损可以放到回撤的高点。 一套交易系统基本的框架就建立起来了。 Zigzag的使用方法二 作为画趋势线的连接点 趋势线是很常见的技术指标,在技术分析中被广泛地使用。 但一直以来趋势线在实战中都存在一个BUG,那就是难以保证划线的一致性。 在图表上有很多的高低点,到底该连接哪一个呢?不同的书上画趋势线的方法
FREE

平均真实波动范围 ( ATR ) 是衡量特定天数内市场波动性的指标。 当价格到达该区间的末端时,就不要指望会有大的持续波动。 市场被认为已经油尽灯枯。如果价格尚未到达边缘,则仍有波动余地。 通过该指标公式,您可以计算出总的和单独的 "高-低 "水平。 您还可以使用这些水平作为支撑/阻力和目标。
输入参数。
Start Day - -从几时开始计算一天的起始日。00 - 默认值。 ATR - 计算天数。 Calc Mode - 选择计算方法(High-Low / High And Low)。
Visual Button - 按钮显示(启用/禁用) 。 Corner - 按钮锚定角度 。 X indent - 以像素为单位的水平填充 。 Y indent - 以像素为单位的垂直填充 。
Label Visual - 显示级别标签 。 Label Font Size - 字体大小 。 Label Shift Bars - 在酒吧的铭文的缩进 。 Label Tooltip - 在关卡上方的光标下显示文本 。
Levels Style
FREE

产品标题 Smart OsMA (MT4) – SmartView 系列的一部分 简短描述 具有独特用户体验的 OsMA 指标,在 MetaTrader 平台上提供。提供以前不可用的高级功能,例如双击打开设置、隐藏和显示指标而无需删除它们,以及以全图表大小显示指标窗口。设计用于与 SmartView 指标系列的其余部分无缝协作。 概述 SmartView 系列通过创新功能为 MetaTrader 平台上的指标提供独特且与众不同的用户体验,使指标管理更快、更轻松。每个指标都配备了图表上的智能控制面板,显示基本信息并提供对所有重要功能的快速访问。 以前不可用的独特功能 SmartView 系列提供使指标工作更简单、更快速的高级功能: 双击打开设置: 无需在指标列表中搜索,双击面板上的指标名称即可直接打开设置窗口。 隐藏和显示指标: 一键隐藏和显示指标,无需从指标列表中删除和重新添加它们。 以全图表大小显示指标窗口: 在子窗口中,您可以最大化指标窗口以全图表大小显示,并临时隐藏其他窗口。 折叠和展开子窗口: 折叠子窗口以减少其高度并节省屏幕空间,然后在需要时将其展开回全尺寸。 重新排列子窗口
FREE

产品标题 Smart ATR (MT4) – SmartView 系列的一部分 简短描述 具有独特用户体验的 ATR 指标,在 MetaTrader 平台上提供。提供以前不可用的高级功能,例如双击打开设置、隐藏和显示指标而无需删除它们,以及以全图表大小显示指标窗口。设计用于与 SmartView 指标系列的其余部分无缝协作。 概述 SmartView 系列通过创新功能为 MetaTrader 平台上的指标提供独特且与众不同的用户体验,使指标管理更快、更轻松。每个指标都配备了图表上的智能控制面板,显示基本信息并提供对所有重要功能的快速访问。 以前不可用的独特功能 SmartView 系列提供使指标工作更简单、更快速的高级功能: 双击打开设置: 无需在指标列表中搜索,双击面板上的指标名称即可直接打开设置窗口。 隐藏和显示指标: 一键隐藏和显示指标,无需从指标列表中删除和重新添加它们。 以全图表大小显示指标窗口: 在子窗口中,您可以最大化指标窗口以全图表大小显示,并临时隐藏其他窗口。 折叠和展开子窗口: 折叠子窗口以减少其高度并节省屏幕空间,然后在需要时将其展开回全尺寸。 重新排列子窗口:
FREE

This comprehensive technical indicator calculates and plots up to 3 moving averages with 3 different periods. By employing three moving averages of distinct lookback periods, the trader can confirm whether the market has indeed experienced a change in trend or whether it is merely pausing momentarily before resuming its prior state. SX Golden MA Pack for MT5 is available here . The shorter the moving average period, the more closely it tracks the price curve. When a security initiates an upt
FREE

Summer Sale: 50% OFF!!! Promotion is valid until 08 August 2025! This indicator is unstoppable when combined with our other indicator called Katana. After purchase, send us a message and you could get Katana for FREE as a BONUS After purchase, send us a private message for your instructions. The Trend Forecasting indicator is a very unique & easy tool that is able to make prediction about future price movement based on the signals generated by MACD . It helps you have an estimation on the are
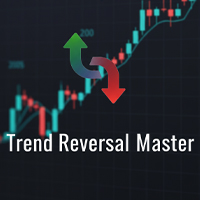
Trend Reversal Master Unlock Your Trading Potential with Precision Are you tired of missing key market reversals? Do you struggle to find high-probability entry points? "Trend Reversal Master" is the smart MQL4 indicator designed to help you spot potential trend shifts with confidence and clarity. This powerful tool combines the best of two worlds: the dynamic Parabolic SAR (PSAR) and the robust 200-period Exponential Moving Average (EMA). By filtering PSAR signals through the long-term trend de
FREE
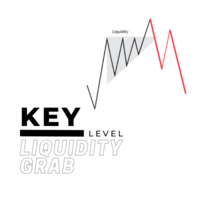
For a bullish move to occur for example, there should be alot of buying power. but you cannot buy if there is no sell on the other side, so the big players usually tend to manipulate the market in order to create available positions on the other side and be able to open their positions and one of the ways is by creating a fake breakout/ a liquidity grab. Before majority of big reversal moves and trends are formed, a liquidty grab would have occured in order to have enough orders to push for the
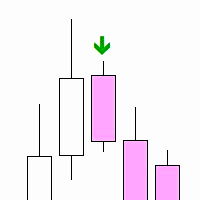
"Inside Bar PA" is a technical indicator designed to determine the inner bars on the chart. An internal bar is a bar or candle, the maximum and minimum of which are completely contained in the previous bar. This may signal a potential reversal or continuation of the trend, depending on the context.
Features: Automatic detection of internal bars. Visual marking of internal bars with arrows on the chart. The ability to adjust the distance of the mark from the bar. How to use: Attach the indicato
FREE

Scalping monster - ready trading system in the form of an indicator. Scalping monster is designed for the Metatrader4 platform. When placed on a forex chart, the indicator automatically analyzes the market using an adaptation algorithm and displays the signals to the trader in the form of red and blue dots. The indicator also shows in the upper right corner information about potential profit / loss.
Our other products at https://www.mql5.com/en/users/master-mql4/seller
How to trade using S

ALL MOVING AVERAGES:多样化策略的终极自定义指标 ALL MOVING AVERAGES 自定义指标是您进行深入技术分析的必备工具,拥有 31 种以上最受欢迎的移动平均线 的惊人集合。该指标专为经验丰富的交易者和初学者设计,提供无与伦比的灵活性,让您完美地调整移动平均线以适应各种交易策略。 通过全面的输入参数范围,包括不同的周期和不同的价格计算类型,您可以轻松地调整指标以适应您的交易风格和分析需求。 主要特点和优势: 丰富的移动平均线库: 访问 31 种以上移动平均线的庞大选择,从经典的简单移动平均线 (SMA) 到 Hull 移动平均线和零滞后指数移动平均线等高级选项,确保您拥有所有工具。 高度可定制: 通过调整周期和从 20 种不同的价格计算类型 中选择,包括标准收盘价、开盘价、最高价、最低价以及高级 Heiken Ashi 选项,微调您的分析。 全面的警报系统: 通过及时通知保持消息灵通: 当前 K 线警报: 价格行动展开时立即获取警报。 K 线收盘警报: 在 K 线完成后接收通知以获取确认信号。 可自定义声音警报: 根据您的喜好个性化警报声音。 电子邮件警报:
FREE
CISD (Change In State Delivery) Indicator TradingLabs ID – ICT Concept Tool The Change In State Delivery (CISD) Indicator is designed based on the ICT (Inner Circle Trader) concept, where price transitions from one delivery state to another often signal high-probability trade opportunities. This tool automatically detects and marks CISD levels on your MT4 charts, helping traders identify potential breakout and retest zones with great accuracy. It is especially useful for traders applying Smart

TRADING FLOW USING AUTO FIBO MUSANG + ALERT SIGNAL 1. Wait for Breakout Alert (Auto Signal) The Auto Fibo Musang system will automatically trigger an alert when a potential breakout is detected from previous price structure.
This serves as the early signal that the market may be ready to move. 2. Identify the Entry Zone (Auto Fibo Levels) The entry zones are auto-plotted based on Fibonacci Musang levels :
Buy Zone (blue levels), Sell Zone (red levels).
No need to draw manu
FREE
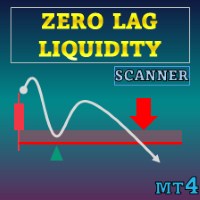
特别优惠 : ALL TOOLS ,每个仅 $35 ! 新工具 在 第一周 或 前 3 笔购买 期间为 $30 ! MQL5 上的 Trading Tools 频道 :加入我的 MQL5 频道以获取我的最新消息 Zero Lag Liquidity 基于较低时间框架的影线剖面和高成交量影线绘制流动性区域。对于每根异常K线,指标会在影线内部构建成交量直方图,找到局部控制点(POC),并将该价格渲染为水平。随后与这些水平的交互可触发标签、突破信号,以及基于价格对此等水平反应的简易趋势状态。
查看更多 MT5 版本: Zero Lag Liquidity MT5 Scanner 查看更多 MT4 版本: Zero Lag Liquidity MT4 Scanner 查看更多产品: All P roducts 概念 高成交量长影线:具有异常长的上/下影线且成交量激增的蜡烛,被选为潜在的对向流动性事件。 影线内直方图:在所选低时间框架上对影线进行分段;按分箱汇总成交量以定位 POC,该点成为流动性水平。 交互与状态:指标跟踪对水平的上破/下破与拒绝,随后相应
Special offer : ALL TOOLS , just $35 each! New tools will be $30 for the first week or the first 3 purchases ! Trading Tools Channel on MQL5 : Join my MQL5 channel to update the latest news from me 在当今动荡的金融交易环境中,准确识别支撑位和阻力位对于交易者做出明智决策至关重要。 Predictive Ranges Scanner Multi-TF 是一款高级工具,旨在帮助交易者对多种货币对和不同时间周期进行扫描并预测未来交易区间,从而有效且精准地识别市场趋势。 See more MT5 version at: Predictive Ranges MT5 Scanner Multi TF See more products at: All P roducts 主要特点 1. 识别潜在支撑和阻力位 Predictive Ranges Scanner利用预测性的
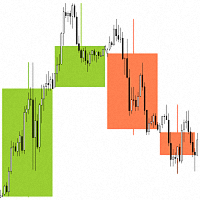
"Candlesticks MTF 4" is an information indicator that displays "Japanese Candlesticks" . The indicator analyzes and determines the opening and closing times of candles from higher time frames.
An algorithm has been developed for the "Candlesticks MTF 4" indicator that corrects the discrepancy between the opening and closing times of candles from higher time frames. For example, if the opening time of a candle on a weekly time frame is the 1st of the month, and on the smaller time frame this da
FREE

根据指定时间范围内的最高价和最低价自动绘制斐波那契水平 多个K线 可以合并:例如,您可以基于10天的最高价和最低价绘制斐波那契水平 我的 #1 工具 : 66+ 功能,包括此指标 | 联系我 如有任何问题 | MT5版本 帮助识别潜在的反转水平; 在斐波那契水平形成的形态往往更强; 显著 减少 手动绘制 所花费的 时间 ; 设置: 计算基准最高价和最低价的时间范围 计算基准价格的周期数量 当前(浮动)K线可以包含/排除 每个级别可以自定义或禁用(设置为0以关闭) 您还可以禁用整个级别组:分别为主要级别、向上和向下扩展 线条颜色、样式和粗细 可以启用/禁用水位价格 //---------
我的 #1 工具 : 66+ 功能,包括此指标 | 联系我 如有任何问题 | MT4版本

''A professional trader is a greedy trader: he buys at lows and sells at highs with minimal risks and high returns,,
Pips Slayer is developed exactly for such trading approach . It's a universal indicator for tracking reversals and uses price action patterns, discrepancy of custom indicators and a multi-layered formula for identifying reversal structures. The indicator is very easy to use; it only shows arrows where is recommended to buy or sell and recommended take-profit and stop-loss prices
FREE

The indicator defines a trading corridor, a flat market, and corrections.
Allows you to compare the significance of different flat and trend areas (by time of existence and by volatility). This makes it possible to assess the market cycle and its mood at a glance.
That is, how long does the flat last on average, and how long is the trend and what kind of volatility they have in points.
As a rule, the longer the flat lasts, the more likely it is to accumulate the potential for a strong movem

该指标的目的在于在您的交易图表上可视化表示唐奇安通道。唐奇安通道是一种直观的技术工具,用于描述特定时期内的最高高点和最低低点之间的范围。此指标增强了价格运动的视觉分析,为潜在的突破和趋势延续点提供了洞察力。唐奇安通道可以应用于当前时间框架和更高的时间框架,如果您选择启用该选项的话。 指标的主要特点: Use_System_Visuals:此参数允许您在使用系统视觉样式和自定义指标外观之间进行切换。当激活时,指标的视觉元素将与您的交易平台整体主题相匹配。 Signal_from_HT_Timeframe:启用此选项允许您从更高的时间框架接收信号。换句话说,您可以考虑在更长的时间框架上观察唐奇安通道的行为,以影响您在当前时间框架上的交易决策。 HT_Timeframe:当激活Signal_from_HT_Timeframe时,此参数允许您选择更高的时间框架,从中您希望接收信号。比较唐奇安通道在不同时间框架上的行为可以为交易决策提供有价值的背景。 Period:此参数定义计算唐奇安通道的时期。它确定用于建立通道上限和下限的条形或蜡烛数量。 Down_Side和Up_Side:这些参数允许您为
FREE

ICT 亚洲区间指标 是一款功能强大的工具,旨在帮助交易者根据 ICT 亚洲区间交易策略识别关键市场结构和流动性区域。它标记了亚洲交易时段(纽约时间晚上 7 点至午夜)的最高价和最低价,并为接下来的交易时段的市场走势提供了重要见解。该指标通过突出流动性扫荡和公允价值缺口 (FVG) 来提高交易准确性,使其成为 ICT 交易者必不可少的工具。
为什么亚洲范围如此重要? 亚洲交易时段为后续交易时段的价格走势奠定了基础。了解这一范围可让交易者预测市场情绪、找到流动性区域并制定战略性交易入场和出场。
ICT 亚洲指数的主要优势及使用方法 ICT 亚洲区间指标为交易者提供早期市场洞察,帮助他们在伦敦和纽约交易时段开始前预测每日趋势和情绪。通过识别流动性定位,该指标突出了机构交易者可能进入或退出头寸的区域,从而更深入地了解市场行为。该指标还有助于预测波动性和潜在突破点,让交易者为即将到来的交易时段的价格变动做好准备。此外,它还是一种有价值的风险管理工具,为止损和止盈设置提供了明确的参考点,从而降低了整体交易风险。
要有效使用 ICT 亚洲区间指标,交易者首先应确定亚洲区间,即交易时段内

A classical MACD indicator where both the MACD line and the Signal line are displayed as lines. The difference between MACD and Signal line is displayed as a histogram. A user can change the color and thickness of histogram lines. So, histogram lines can be grouped into four different groups: positive ascending, positive descending, negative descending and negative ascending. Multi-currency Dashboard for the indicator is available https://www.mql5.com/en/market/product/72354
FREE

Round Numbers Levels indicator for MT4 Round Numbers indicator is a simple but useful indicator to draw 00 and 50 price levels in your chart.
These levels act as supports and resistances, and therefore should be taken into account when trading.
These levels can be used as profit targets or entry points.
Inputs of the indicator are:
TGridColor00: color to be used for xx00 levels GridStyle00: line style to be used for xx00 levels GridWidth00: line width to be used for xx00 levels GridColor50:
FREE
特别优惠 : ALL TOOLS ,每个仅 $35 ! 新工具 在 发布后的第一周 或 前 3 笔购买 期间仅售 $30 ! MQL5 上的 Trading Tools 频道 :加入我的 MQL5 频道以获取我的最新动态 Zone Shift 是一款趋势识别工具,使用基于 EMA/HMA 的带状通道来检测趋势转换并显示关键反应位。它通过蜡烛颜色显示趋势方向,并用可视化提示标记重要回测,帮助用户跟踪动能。 查看 MT5 版本: Zone Shift MT5 Scanner 查看 MT4 版本: Zone Shift MT4 Scanner 查看更多产品: All P roducts 主要功能 1) 动态 EMA-HMA 带 构建三线通道:中线为 EMA 与 HMA 的平均;上、下轨根据平均蜡烛范围扩展。该带会根据市场波动性自适应,以反映当前运行区间。 2) 趋势检测(带区穿越逻辑) 当最低价上穿上轨时识别为上升趋势。 当最高价下穿下轨时识别为下降趋势。 蜡烛重新上色:上升趋势为黄绿色(lime),下降趋势为红色。 3) 趋势起始位 在新趋势开始时,工具记录

The indicator has combined 5 popular strategies. Draws an arrow after confirming a signal for the selected strategy. There are signal alerts. Doesn't redraw its values. I recommend watching my advisor - Night Zen EA
5 strategies. The main line crosses the signal line. The main line crosses the signal line in the oversold (for buy) / overbought (for sell) zones. The main line enters the oversold (for sell) / overbought (for buy) zones . The main line comes out of the oversold (for buy ) / over
FREE

VWAP and Moving Average A combination of Supertrend and Moving Average to create a converging trade setup Input parameters: signal mode: set it to true if you want to plug it into STAT (Signal Tester and Trader) arrow shift: distance between fast EMA line to arrow on chart turn on moving average signal for converging setup VWAP period MA period MA averaging method MA pricing method upper level limit ( VWAP ) lower level limit ( VWAP ) You can find the best setting for 4 hour EURUSD on this v
FREE

Scalping indicator. It takes into account volatility, price movement in the local interval and the direction of the current trend. Recommended timeframe - M5. Advantages: Low volatility when a signal appears ensures minimal movement against an open position. The indicator does not redraw its signals. There are alert signals. It is a great tool for day trading.
Settings: Name Description Period Indicator period Range of each bar in the period (pp.) The maximum size of each candle in the indicato
FREE
Stop missing powerful breakout opportunities! The Advanced Breakout Scanner Dashboard is a professional-grade trading tool that monitors up to 28 currency pairs in real-time, scanning for ten unique high-probability breakout strategies simultaneously. Attach it to a single chart to get a complete overview of the entire market, instantly identifying the best trading setups as they happen. This is not just a signal indicator; it's a complete trading dashboard designed for serious breakout traders.

Other profitable programs https://www.mql5.com/en/users/ifyjava/seller Solarwind No Repaint是一个技术振荡器,将费舍尔变换应用于标准化价格数据,创建基于直方图的指标来识别潜在的市场转折点。该指标将价格变动转换为高斯正态分布,使周期性模式和动量变化对交易者更加可见。 工作原理 该指标通过几个计算步骤处理价格数据: 高低分析 :计算指定周期内的最高价和最低价 价格标准化 :取每根K线高低价范围的中点,并根据周期范围进行标准化,将数值缩放到-1和+1之间 费舍尔变换应用 :应用数学费舍尔变换公式 0.5 * ln((1+x)/(1-x)) 并进行平滑处理 趋势信号处理 :基于数值变化和动量阈值生成方向性信号 主要特征 直方图显示 :在单独的指标窗口中显示为彩色柱状图 基于趋势的着色 :绿色柱表示看涨动量,红色柱表示看跌动量 无重绘设计 :仅使用已完成的K线以防止当前K线上的信号变化 自适应敏感度 :可配置的阈值系统以过滤市场噪音 信号持续性 :保持趋势方向直到发生显著的动量变化 参数 周期 (Extp
FREE

The Supertrend Indicator is a popular technical analysis tool designed to assist traders in identifying market trends. The indicator combines the average true range (ATR) with a multiplier to calculate its value. This value is then added to or subtracted from the asset’s closing price to plot the supertrend line. The Supertrend Indicator can help identify trends, manage risk, and confirm market tendencies. The indicator is limited by its lagging nature, is not very flexible, and can send up fal
FREE
介绍绘图指标:释放您在图表上的创造力!
您是否厌倦了在交易图表上进行注释的困扰?是否试图理解自己的分析或有效传达自己的想法?别再犹豫了!我们非常高兴向您推荐绘图指标,这是一款创新的工具,让您只需点击几下鼠标或挥动笔尖,就能轻松地在图表上进行绘图和注释。
我们创新的绘图指标旨在增强您的图表体验,释放您的创造潜力。有了这个强大的工具,您可以轻松表达自己的想法,标记重要水平,突出显示模式,并以前所未有的方式可视化您的交易策略。无论您是经验丰富的交易者、技术分析师还是初学者探索迷人的交易世界,绘图指标都是一个宝贵的资产,将彻底改变您与图表互动的方式。
主要特点:
用户友好界面:我们理解无缝用户体验的重要性。我们直观的界面确保您可以轻松地操作工具,并轻松访问所有功能。告别繁琐的设置,迎接简单性。
精准绘图:绘图指标允许您直接在图表上绘制线条、形状和注释。无论您是使用鼠标还是笔,我们的工具都提供流畅且响应灵敏的绘图体验,确保您的创造力无障碍地流动到图表上。
删除和重绘:犯了个错误或者想重新开始?没问题!我们方便的删除按钮可以轻松删除之前的绘图或注释。通过纠正和完善您的作品,您可以保持
FREE

Buy Sell Magic AI – Dynamic Trend Line & Bollinger Bands for MT4 Buy Sell Magic AI is a professional indicator for MetaTrader 4 that combines the power of Bollinger Bands with a dynamic central midline that acts as a real-time trend line . It delivers clear entry signals, visual trend confirmation, and automatic Stop Loss placement—plus a built-in candle timer for precise trade timing. My indicators for free. I only ask that leave your feedback to help me improve them or as a thank you. Have
FREE

This is an indicator for Quasimodo or Over and Under pattern. It automatically finds the swing points and can even place virtual trades with stop loss and take profit. Press the "Optimize" button to automatically find the most effective settings. The pattern consists of four legs A,B,C,D as shown in the pictures. Open and close prices of the virtual trades are Bid price but the statistics in Display Panel take current spread into account. Its parameters are explained below. Buffer - Pips distanc
FREE
Multi-Timeframe ATR 指标是 MetaTrader 4 标准 ATR 指标的增强版,它允许交易者在当前图表上查看 任意时间框架 的波动性。与只显示当前图表时间框架 ATR 的普通版本不同,本指标可让您选择其他时间框架,例如在 M15 或 H1 图表上直接展示 日线 ATR 。 运行原理:
本指标从您选定的时间框架(如 H1、H4 或 D1)提取 ATR 值,并以与标准 ATR 相同的方式在独立窗口中绘制。它会自动将较高时间框架的条形对齐当前图表,使您在分析短周期走势时,了解更高周期的波动情况。同时,图表上还会显示一个 以点(pips)为单位 的当前 ATR 值标签,该值根据您的经纪商报价精度(2–6位小数)自动转换并四舍五入。 交易者实用用途: 跨时间框架波动性背景 — 在操作低周期图表时,监控高周期如日线或周线的 ATR,以判断市场何时处于扩张或收缩状态。 仓位规模制定 — 使用以 pips 表示的当前 ATR 值来设置止损或计算仓位规模,使其与市场波动性成比例。 交易时机把握 — ATR 上升时可确认突破或趋势阶段;ATR 下降时可警示合并阶段。 策略过滤器 —
FREE

This indicator lets you easily mark the daily open levels on a chart with several possibilities of customization. For many trading strategies, the daily open level is an important level to base trading decisions on. That is why I chose to create this indicator that is designed to assist you with trading these strategies, as well as further optimizing them and getting a general understanding of the markets movements. With this tools help, you can easily take a look at the previous price action ar
FREE

Looking for entry points along the local trend without repaint! Arrows indicate entry points. Based on classic indicators. The indicator is easy to use. Settings Наименование Описание Frequency factor Signal frequency. The less, the more often.
This affects the quality.
Recommendations Recommended for use on major currency pairs. Timeframe from m5, m15, m30 Subscribe to my telegram channel, where we discuss intraday trading, ideas, indicators, etc., a link in my profile contacts.
FREE

his indicator automatically identifies key support and resistance levels by analyzing volume patterns. Unlike traditional S/R tools that rely only on price, Volume S/R finds levels where the market truly reacted. DETECTION LOGIC: - High Volume Zones: Price levels where strong buying/selling occurred - Low Volume Zones: Areas of weak interest - potential breakout or reversal zones
SMART FILTERING: - Nearby levels are automatically merged to avoid chart clutter - Maximum levels limit keeps yo
FREE
This automated VOLUME SCALPING INDICATOR can be utilized to manage trades and identify potential areas of support and resistance for both buying and selling. It is designed to identify zones for Sell/Buy trades based on the volume analysis and can be effectively used in conjunction with other indicators, such as order block indicators, and more. Currently designed for MT4, it will later be adapted to function on MT5. We also offer the opportunity to customize the robot according to your trading
FREE

概述:
彩色抛物线 SAR 指标 是一种视觉增强的交易工具,旨在简化趋势跟随和交易识别。这个可定制的指标通过图表上颜色编码的信号为多头(买入)和空头(卖出)趋势提供清晰的视觉提示,直接在您的 MT4 图表上显示。 主要特点: 颜色编码信号: 买入信号使用亮绿色 "o" 符号显示。 卖出信号使用红色 "o" 符号显示。 可自定义输入: 可调整的步长(Step)和最大值(Maximum)参数,用于精细调整抛物线 SAR 的计算。 可自定义线条宽度和颜色,以适应您的交易风格和图表外观。 简单且有效的可视化: 通过清晰的符号轻松识别多头和空头趋势,这些符号显示在价格蜡烛上方或下方。 让您一目了然快速评估市场状况。 兼容性: 支持所有 MT4 可用的交易品种和时间框架。 适合谁使用? 寻找将抛物线 SAR 简单集成到交易策略中的交易者。 适用于趋势跟随策略,或作为其他指标的确认工具。 输入参数: 步长(Step): 定义抛物线 SAR 的灵敏度(默认值:0.02)。 最大值(Maximum): 设置指标的最大值(默认值:0.2)。 线宽(Line Width): 调整绘制信号的线条厚度。 上涨
FREE

Please check the " What's new " tab regularly for a complete and up-to-date list of all improvements + parameters. FREE indicator for my trading utility Take a Break . This indicator allows you to manage multiple other EAs with just one Take a Break EA instance. Simply specify the corresponding Chart Group in the indicator(s) and Take a Break EA settings and you are good to go.
Setup examples (Indicator + EA)
As a prerequisite, add the URL https://trading.custom-solutions.it to the list of al
FREE

精度计介绍:
Accuracy Meter是确定策略获胜百分比的强大工具,可以像元交易者策略测试员一样向您显示所有交易进场和出场点,您可以将简单的策略测试员作为图表上的指标,将其附加到不同的货币对和时间框架上并找出您的策略准确性百分比,更改止损和风险以奖励因素,并查看其如何影响您的交易思路。 Accuracy Meter是您简单的策略测试仪,该产品可以帮助您在与策略测试仪相同的图表上访问策略的入口和出口点,通过此产品,您可以节省您的资金,而不会浪费在建立无利可图的EA上。
常问问题 :
如何为该指标定义策略?
精度计的输入设置可让您调整自定义指标的路径和名称,还可以定义买卖缓冲区编号,
您可以使用以下设置:
自定义指标名称
购买缓冲区编号
卖出缓冲区编号
我可以通过不同的止损或获利来测试我的自定义指标吗?
是的,您可以使用以下参数来调整止损并获利。
所需止损点
期望的奖励风险因素
图形仪表盘信息:
屏幕左上方设计的图形仪表板向我们显示了分析结果,您可以查看有关所选策略的有用信息。
总交易,获胜百分比,亏损百分比,开始分析时
FREE
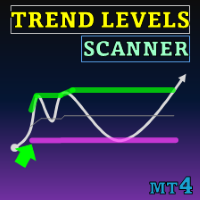
Special offer : ALL TOOLS , just $35 each! New tools will be $30 for the first week or the first 3 purchases ! Trading Tools Channel on MQL5 : Join my MQL5 channel to update the latest news from me 趋势水平 (Trend Levels) 指标精心设计,帮助在市场波动中确定关键的趋势水平——高、中、低。在自定义回溯期内基于最高、最低和中位值的实时计算,该工具为交易者提供了关于趋势动态和强度的结构化视图,帮助他们做出精确的交易决策。 查看更多 MT5 版本: Trend Levels MT5 查看更多产品: 所有产品 趋势水平指标的主要特点及使用方法 趋势变化信号 该指标通过追踪选定输入周期内的最高和最低值来识别趋势变化。当当前的最高值达到最大值时,指标显示上升趋势;相反,当当前的最低值达到最低水平时,显示下降趋势。这些趋势变化会在图表上以视觉方式呈现,帮助交易者
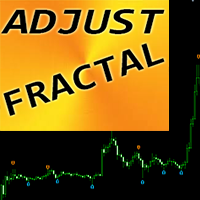
“可调分形” - 是分形指标的高级版本,非常有用的交易工具! .......................................................................................... - 众所周知,标准分形 mt4 指标根本没有设置 - 这对交易者来说非常不方便。 - 可调分形解决了这个问题 - 它具有所有必要的设置: - 指标的可调周期(建议值 - 高于 7)。 - 价格高点/低点的距离可调。 - 可调分形箭头设计。 - 指标内置移动和 PC 警报。 点击这里查看高质量的交易机器人和指标! 这是仅在此 MQL5 网站上提供的原创产品。 ....................................................

[V 1.00] MTF NRPA 5 移动平均 RTD 已发布!
非重绘箭头实时仪表板。
如果您正在寻找最好的移动平均线指标,那么您来对地方了。 通常人们会设置两条移动平均线,因为两条移动平均线的交点(交叉)将决定下一个价格趋势的方向。 如果快速移动平均线与慢速移动平均线相交且快 > 慢则趋势向上。 相反,如果快速移动平均线与慢速移动平均线相交且快 < 慢,则趋势向下。 两条均线的缺点是看不到长期趋势。 这就是我开发此交易工具的原因。
解释如下:
在这个交易工具中,我使用了五个移动平均线。 是的,五个! 默认情况下,我将 MA 1 和 MA 2 设置在较大的时间范围内,即 H1。 MA 1 和 MA 2 的交集意味着 H1 时间帧上有趋势变化。 然后 MA 3 和 MA 4 我在当前时间范围(小)上设置,例如,您在 M5 上打开图表。 MA 3 和 MA 4 的交叉点表示当前时间范围 (M5) 有趋势变化。 然后为了确认趋势运动,我在当前时间范围内设置了 MA 5。
这个交易工具有很多令人惊奇的东西:
您可以根据自己的喜好更改五个 MA 的时间范围。 您可以更改线条样式

The Pivot Point indicator automatically calculates and displays the pivot point line and support and resistance levels. Pivot can be calculated according to the Classic, Floor, Fibonacci, Woodie, Camarilla or DeMark formula. It is also possible to select the period for calculating the indicator. A trader can choose from daily, weekly, monthly, or user-defined periods.
Types of pivots Classic Floor Fibonacci Woodie Camarilla DeMark
Main features The indicator shows the current and historic
FREE

The indicator synchronizes eight types of markings on several charts of one trading instrument.
This indicator is convenient to use in conjunction with "Multichart Dashboard" or other similar assistant that allows you to work with several charts at the same time.
"Multichart Dashboard" can be found under the link on my youtube channel.
Settings:
enable vertical line synchronization
enable horizontal line synchronization
enable Trend Line synchronization
enabling Fibonacci Retracement synchron
FREE

Smart Liquidity Zones (SLZ) — Your All‑in‑One SMC/ICT Radar for MT4
Why SLZ? Tired of squinting at charts trying to spot liquidity grabs, break‑of‑structure candles and Fair Value Gaps before the smart‑money sharks do? SLZ turns your chart into a tactical map —drawing every high‑probability zone and screaming (politely) when price dives in. Core Edge Powered by a rule‑set distilled from Smart Money Concepts (SMC) and ICT mentorship material, SLZ auto‑marks: Component What it shows Why it
FREE
MetaTrader市场是一个简单方便的网站,在这里开发者可以出售自己的交易应用程序。
我们将帮助您发布您的产品,并向您解释如何为市场准备您的产品描述。市场上所有的应用程序都是加密保护并且只能在买家的电脑上运行。非法拷贝是不可能的。
您错过了交易机会:
- 免费交易应用程序
- 8,000+信号可供复制
- 探索金融市场的经济新闻
注册
登录