适用于MetaTrader 4的技术指标 - 116

BSA indicator is a ZigZag based indicator. This indicator is used to find the reversal level of the price. You can use the existing risk ratio and calculation timeframe in the entries by optimizing them according to your usage preference. In lower time frames, the indicator can repaint. For healthier results, you can detect the least repainting by observing for a while according to the graphic you will apply.

Simple Dark Holder Tool
Arrow indicator for Forex and binary options
Already tuned for the best signals
Multicurrency and multitimeframe
Works on all currency pairs as well as raw materials, etc.
Works on the author's strategy and combines 3 indicators that show good results
Does not draw or redraw
The signal appears clearly at the opening of the candle
blue up
Red down
Alert is also built into it for your convenience.
Test and watch a video on how it works

Weddell Pro is a good trading tool that is suitable for both a beginner and an experienced trader.
It can be used both separately and combined with other strategies and indicators
Configured for currency pairs was tested several times on cryptocurrency but did not show a high result
Currency pairs USD/EUR AUD/CAD GBP/USD Showed itself very well here
The percentage of correct transactions is above 68%, which does not make it perfect and bad
Doesn't draw or disappear
The red arrow shows a t

Welcome to Upside Down !
Upside Down is a powerful indicator that gives the perfect trading opportunities and a clear indication of the market. Upside Down has been created to be as simple as possible. Arrows are calculated based on ASC Trend and customs indicators . Signals appear without delay at the end of a candle, if it has tested the level. The signals do not overdraw.
THE BENEFIT:
Easily to enter in buy position/sell position Intuitive directional arrows by colors
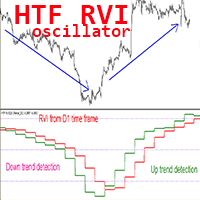
Crypto_Forex 指标 HTF RVI 振荡器适用于 MT4,无需重绘。
- 使用专业的 HTF RVI 振荡器升级您的交易方法,适用于 MT4。HTF 表示 - 更高的时间框架。 - RVI 是用于趋势变化检测和从超卖/超买区域进入的最佳振荡器之一。 - 该指标非常适合多时间框架交易系统,价格行动从超卖/买入区域进入。 - HTF RVI 指标允许您将更高时间框架的 RVI 附加到当前图表 --> 这是专业的交易方法。 - 超买区域高于 0.23;超卖区域低于 -0.23; - 指标具有内置的移动和 PC 警报。 ................................................... 点击这里查看高质量的交易机器人和指标! 它是仅在此 MQL5 网站上提供的原创产品。

Support And Resistance Screener is in one level indicator for MetaTrader that provide multiple tools inside one indicator. The available tools are : 1. Market Structure Screener. 2. Bullish Pullback Zone. 3. Bearish Pullback Zone. 4. Daily Pivots Points 5. weekly Pivots Points 6. monthly Pivots Points 7. Strong Support and Resistance based on Harmonic Pattern and volume. 8. Bank Level Zones.
Key Features All in one level indicator.
All types of alerts ( Pop-up alert, puss notification alerts.

This tool provides a freehand drawing method, to treat the chart space as a blackboard and draw by-hand. Drawings can be made to stick to the CHART (moves with chart scroll), or to stick to the WINDOW (does not move with chart scroll).
Features: all drawings are individually styled, color, width
show/hide each drawing type
delete last drawing drawings, on chart and on window, remain through TF changes and terminal re-starts, until the indicator is removed
Panel: stylable colors scalable in size
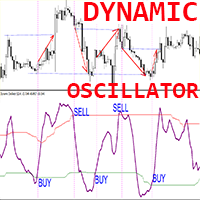
动态振荡器 - 是一种高级自定义 Crypto_Forex 指标 - 适用于 MT4 的高效交易工具! .................................................................................................... - 新一代振荡器 - 查看图片以了解如何使用它。 - 动态振荡器具有自适应超卖/超买区域。 - 振荡器是一种辅助工具,用于从超卖/超买区域找到准确的切入点。 - 超卖值:低于绿线;超买值:高于红线。 - 它比标准振荡器准确得多。合适的时间范围:M30、H1、H4、D1、W1。 - 具有 PC 和移动警报。 点击这里查看高质量的交易机器人和指标! 它是仅在此 MQL5 网站上提供的原创产品。

My indicator is a great helper in the forex market. It shows possible market reversals with absolute accuracy. My indicator does not redraw and does not change values when switching timeframes. It works perfectly on all timeframes and can become a key indicator in your strategy. I would like to note that flexible indicator settings allow you to adapt the indicator to your strategy and can make a big contribution to your profitable strategy, although everything is already laid down in this indica
ADX Pro Indicator This Indicator Are Advanced Pro ADX Indicator Multi Time Frame Are Same Window Multi Currency Are Same Windows All Time Frame And All Currency ADX Strenght Are Same Window Monitring You Will Add Manully All Currency Pairs , And Metel , And Also Crypto Currency Pairs : EURUSD , GBPUSD, USDJPY .... Etc , Metel : XAUUSD , XAGUSD ... Etc , Crypto : BTCUSD, ETHUSD... Etc
Hello; The product offers high quality trend tracking. Thanks to the arrows on the graph, you can easily follow the entry and exit signals. It provides ease of use thanks to a single input parameter. You can easily follow the signals thanks to the alarm options. Moreover, trend color lines provide convenience in determining the trend direction. Input parameter setting: Periodic: Indicates the number of bars that need to be calculated.
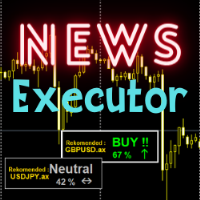
Several indicators are summarized in one display conclusion. Highly recommended indicator for all traders even beginners. You only need to make transactions according to the recommendations displayed by the indicator. It's obvious for trading news with big effects though. Trading is all about money, so love your money and make a profit with our tools. Trading recommendations on news on major currencies
Master Trend Signal Indicator
TimeFrame - 15 Mins & More
Pairs - All Forex Currency Pairs , Gold , Silver , Crypto, Stock
Once Trend Is UP Cross The Yellow Line, It's Show Colour For Green
Once Trend Is Down Cross The Yellow Line, It's Show Colour For Red Easy TO Identify Trend Strength ON Trading For Scalping, Intraday Trading 5 Purchases left & The Price Increases

В основе индикатора EasyBands лежит тот же принцип, что и при построении Bollinger Band. Однако, данная модификация индикатора использует вместо стандартного отклонения средний торговый диапазон (Average True Range). Соответственно, с данным индикатором абсолютно аналогично можно использовать все стратегии, которые применяются с Bollinger Band. В данной версии индикатора используется двенадцать уровней и средняя линия (белый цвет). Индикация тренда выполнена в виде окраски свечей в зависимости
Golden Scalping & Day Trading Signal Indicator You Can Enable Or Disable Scalping Signal Option Once Enable For Scalping More Order Signals Option Or Disable For Scalping Option Intraday Signal Option Pairs : XAUUSD, XAGUSD - EURUSD, GBPUSD,USDJPY, AUDUSD, USDCAD, BTCUSD , USDCHF, GBPJPY Time Frame : 15 Mins, 30 Mins , 1 Hour 5 Purchases left & The Price Increases
Market Reversal Catcher Dashboard indicator looks for market reversal points or major pullback. To do this, it analyzes previous price movements and using a flexible algorithm for estimating the probability of a reversal, also gives recommendations on entry points and sets recommended profit targets for positions opened on a signal. The dashboard is designed to sit on a chart on it's own and work in the background to send you alerts on your chosen pairs and timeframes. Dashboard does not requi

其中一个数字序列称为“森林火灾序列”。它被公认为最美丽的新序列之一。它的主要特点是该序列避免了线性趋势,即使是最短的趋势。正是这一属性构成了该指标的基础。 在分析金融时间序列时,该指标试图拒绝所有可能的趋势选项。只有当他失败时,他才会认识到趋势的存在并给出适当的信号。这种方法可以让人们正确地确定新趋势开始的时刻。然而,误报也是可能的。为了减少它们的数量,该指标添加了一个额外的过滤器。当新柱打开时会生成信号。在任何情况下都不会发生重绘。 指标参数: Applied Price - 应用价格常数; Period Main - 指标的主要周期,其有效值在 5 - 60 之间; Period Additional - 附加周期,此参数的有效值为 5 - 40; Signal Filter - 附加信号滤波器,有效值 0 - 99; Alerts - 启用后,指示器会在出现新信号时提醒您; Send Mail - 允许指标向电子邮件发送消息; Push - 允许您发送 Push 消息。
Gold Scalping Pro Signal Indicator Pairs : XAUUSD, XAGUSD, Crude OIL , BTCUSD, ETHUSD, EURUSD, GBPUSD, USDJPY, AUDUSD, USDCHF, GBPJPY Setting : Once Market Are Up And Down Side , The Indicator Are Provide Buy And Sell Order Push Notification Time Frame - 5 Mins, 15 Mins, 1 Hour, 4 Hour Additional : You Have Also Trade Manual , Once Trend Power Is Up , Enter Buy Or Trend Power is Down, Enter Sell
A Good , Easy , Readable and handy indicator for experienced and professional traders. It gives bounded signals between zero and one. Easy for investors to comprehend. It gives near and longer trading outlook to investors and helps them to find good opportunities. Indicator gives zero signal on price downturns and signal value equals to one on price upturns. Once again a new type of indicator and rangebound between zero and one .

A very Simple Indicator for experienced and professional traders. It indicates direction of trade and provides signals of best deals. Signal is referred here a point on chart where indicator line turns its direction or converges. This indicator finds underlaying trading asset trade direction and indicates best scenarios of trade as described in screenshots. Where it has run for a period of time and converges to best deal scenarios.
Have a Look!

A value indicator. It is helping tool to indicate the direction of value gain. A best helping tool to trade value. This indicator is equipped with a colored line and a digital tool to indicate value numerically .
This indicator also helps to indicate value during trends. A study based on this indicator shows value of trade significantly changes during trends best tool to chase the trends.
A basic tool for experienced and professional traders to trade percentile of the value. It indicates both values in the form of digits appeared on the left corner of the screen.
Instructions Manual : First choose your desired symbol and then select this tool. Please be remined that this tool is just a helping tool. its upon trader what he chooses. The function of this tool is just to provide a help in trading.
A technical Indicator Providing Price Convergence Signals along with value for experienced and professional traders. Easy to comprehend, Easy to understand.
This is a helping tool provides best signals. This indicator is designed based on the fundamentals of trade. A very good indicator you can customized its color. A best tool to find trade direction.
An adaptive indicator. It constantly adapts to the trade.
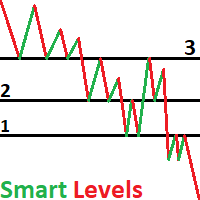
NOTE: T he indicator in demo version will not work as it requires the specific preset and if in future you don't see recent numbers drawn on your chart then please contact us for recent calculated preset file
This is smart money levels , just see the pictures how the pair reacts to our calculated numbers
The indicator can be used with any timeframe but to match the institutional traders we recommend H4 or D1 charts
Allow DLL imports must be turned on, as the indicator requires to be connect
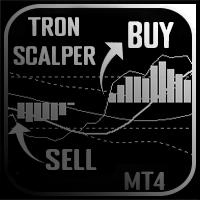
Tron黄牛是一个新的作者的指标设计为黄牛.
一个指示器,根据一系列标准和专有工具的读数给出信号。
Tron黄牛的主要特点: 分析函数
它可以在任何货币对和时间框架上使用; 指标不重绘; 这是其他指标的一个很好的补充; 图形功能
占据图表上最小数量的位置; 柔性酊剂; 简单易学; Tron黄牛由...
蓝线是RSI指标; 橙色线是基于T3RSI的综合RSI指标; 虚线-布林带的边界; 蓝线是布林带的中线; Tron黄牛的主要特点:
有一组用于过滤的指示器; 指标本身显示何时需要进入市场;
Tron黄牛的基本设置: RSI周期-设置RSI的蓝线;
波段周期-虚线的调整;
MA周期-设置移动平均线;
波段偏差-波段偏差;
波段移位-波段移位;
Tron黄牛在交易中的使用:
进入市场的信号是在建立在T3RSI上的综合RSI离开布林带时形成的。 可以使用T3RSI与布林带中线的交点。
进入位置是在相应颜色的直方图的第一条出现之后进行的:蓝色-进入买入,红色-进入卖出。
从该位置退出是在将直方图的条调零后进行的。

Note: The PRICE IS SUBJECT TO INCREASE AT ANY TIME FROM NOW!! DON'T MISS THIS BEST OFFER.
Dear traders once again I am very glad to introduce to you my another trading tool called "Trend Hunter Indicator". This indicator is designed to help traders capture the trend from the beginning or the end of it. It is one of the indicator that if used wisely may help you improve in your trading decisions.
Timeframe
The indicator is for all timeframes
Pairs
The Indicator is for all pairs.
Market
Thi

HEIKEN PLUS is the only indicator you really need to be a successful trader , without in depth knowledge of the forex trading or any tools. Also there is automatically trading MT5 EA available now: https://www.mql5.com/en/market/product/89517? with superb SL/TP management! and sky high profit targets ! MT5 ONLY !
For Metatrader5 version visit: https://www.mql5.com/en/market/product/83761?source=Site
Very suitable tool for new traders or advanced traders too.
HEIKEN+ is a combin

DESCRIPTION Investing indicator help you get signal like Technical Analysis Summary of Investing.com When have signal strong ( Strong buy or Strong sell) at Time Frame M5, M15, H1, The Alert will announce to you HOW TO USE When have signal , you can entry Order and set TP & SL appropriately Recommend : This indicator also Technical Analysis Summary of Investing.com is suitable for medium and long term trading

UR前端后端
UR FrontEndBackEnd 是我最喜歡的公式,用於找到最準確的支撐和阻力水平。 我還將它們分成不同的類別(虛線、實線和區域)以標記它們的強度。 所有這些都存儲在緩衝區中,因此它們很容易在其他工具中訪問和實施。
添加:該工具可能需要根據它所應用的資產進行調整 - 資產在影響該工具的價格方面的 digis nr 方面有所不同。 設置中提供了所需的參數。
使用 UR FrontEndBackEnd 的優勢:
只需 2 個參數即可設置計算的密度和距離 支撐和阻力存儲在緩衝區內,從給定資產的價格開始上升/下降 3 種線條,用於快速視覺反饋支撐/阻力線的強度 -> DASHED、SOLID 和 AREA 有一個特殊的電報聊天,您可以在其中了解最新的工具更新,如果您覺得缺少什麼,也可以發送請求!
為什麼選擇 UR FrondEndBackEnd?
它是最容易使用和設置的支撐/阻力指標 - 也可以在其他工具中實施 - 所有數據都易於讀取並存儲在 4 個緩衝區中。
如何使用 UR FrondEndBackEnd ?
請參閱下面的描述以更熟悉它:
設

The Cycle Identifier MT4 indicator is a great choice of custom indicator for both short-term and long-term traders. The Cycle Identifier MT4 generates filtered price action signals to assist traders to identify when the conditions are right to open buy and sell positions. How it works The Cycle Identifier MT4 indicator displays on a separate indicator chart below the main chart where it draws an oscillating gray line. This gray line is characterized by upward and downward spikes that are accompa
This indicator is used to show the PERFECT TREND . All Time Frame charts are available. The trend is determined based on the Cycle, Price and Volatility. This Trend Indicator will give 5 output values: Cycle Period: 48 is default
Graph Place: 0 Means Main Windows - 1 means Sub Windows (you can use in your indicator)
NumBars: you can decide how many older Bar use
Short Trend Color : You can decide which color to use for Short Trend
Long Trend Color : You can decide which color to use for Long T

Awesome Oscillator by Bill Williams with the ability to fine-tune and replace the averaging algorithms of the indicator, which significantly expands the possibilities of using this oscillator in algorithmic trading and brings it closer in its properties to such an indicator as the MACD. To reduce price noise, the final indicator is processed with an additional Smooth averaging. The indicator has the ability to give alerts, send mail messages and push signals when the direction of movement of th

What is 2 Line MACD Indicator MT4? The 2 Line MACD Indicator, in short, is a technical indicator that assists in identifying the trend as well as its strength, and the possibility of the trend reversal. It is a widespread forex technical indicator that is made of three essential components, i.e. 1. MACD histogram
2. MACD: 12-period exponential moving average (12 EMA) – 26 period EMA
3. MACD Signal Line: the 9-period EMA of the MACD. This Indicator is one that ensures a trader stays profitable o

3C JRSX H Indicator represents a trend-following forex trading oscillator that signals for both market trends and its possible swing areas. Besides, it supports all sorts of timeframe charts available within the forex MT4 platform. Therefore, it can serve all kinds of financial traders providing supports for both scalping and day trading activities. This Indicator can be applied to all kinds of forex currency pairs available in the market. Moreover, its simplicity of use and easy chart demons

The Market Profile Indicator for MT4 displays the price levels and zones where increased trading activity happens. These zones with substantial forex trading activity provide the forex traders with the best entry levels, support, and resistance levels. Moreover, price levels indicate the best reversal zones. As a result, forex traders can identify BULLISH and BEARISH market trends and BUY and SELL entry points as well as the best reversal points. The indicator works well in all intraday timefram

Signal lines are used in technical indicators, especially oscillators , to generate buy and sell signals or suggest a change in a trend. They are called signal lines because when another indicator or line crosses them it is a signal to trade or that something potentially important is happening with the price of an asset. It could be that the price was trending, pulled back , and is now starting to trend or again, or it could signal that a new uptrend or downtrend is starting.

About Scanner:
It will show you the Higher/Lower Highs and Lows of zigzag price. Use it to keep track of best ongoing trends and price ranges.
Detailed blog post:
https://www.mql5.com/en/blogs/post/750232
Symbols:
HH: Higher Highs HL: Higher Lows When price makes higher and higher Highs or higher Lows:
It will count Zigzag in reverse and find total number of last "Higher Highs" and "Higher Lows" or "Lower Lows" and "Lower Highs". LL: Lower Lows LH: Lower Highs
How to Use:
Suppose price is

Accelerator Oscillator by Bill Williams with the ability to fine-tune and replace the averaging algorithms of the indicator, which significantly expands the possibilities of using this oscillator in algorithmic trading and brings it closer in its properties to such an indicator as MACD.
To reduce price noise, the final indicator is processed with an additional Smooth averaging. The indicator has the ability to give alerts, send mail messages and push signals when the direction of movement of
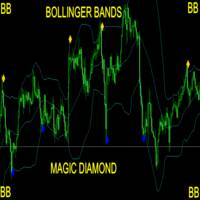
Take Your Trading Experience To the Next Level ! and get the Magic Bollinger Bands Diamond Indicator MagicBB Diamond Indicator is MT4 Indicator which can suggest signals for you while on MT4. The indicator is created with Non Lag Bollinger Bands strategy for the best entries. This is a system to target 10 to 20 pips per trade. The indicator will give alerts on the pair where signal was originated including timeframe. If signal sent, you then enter your trade and set the recommended pips target

SupportResistancePeaks Indicator indicator - is the combination of dynamic support/resitance and price action pattern. As a rule support/resistance indicators uses already calculated, history levels. The most disadvantage of this method - new(incomming) levels always are not the same as were on history, in other words accuracy is not so high as expected. My indicator is looking for dynamic/live levels that are forming right now after trend lost it's power and choppy market starts. As a rule exac
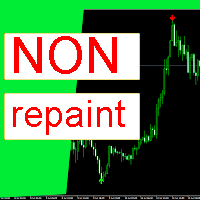
一個可以幫助您進行交易的指標。該指標將顯示趨勢反轉和回調。當箭頭出現時,這意味著現在趨勢將改變其方向,或者將從主要運動中回滾。在任何一種情況下,如果交易者事先知道,就有可能有效地進行交易。該指標不會重繪其值。箭頭出現在蠟燭的開頭並停留在那裡。
如何使用該指標進行交易: 當一個紅色箭頭出現時,我們打開一個賣出交易。 當一個藍色箭頭出現時,我們打開一個買入交易。 止盈設置在 15-25 點。止損由您自行決定,具體取決於市場的波動性和您交易的貨幣對。
指標的好處: 不重繪其值 顯示價格反轉點 顯示趨勢變化點 顯示價格回滾點 非常容易使用 具有易於使用的最少設置
指標設置: period - 指定指標計算週期。 為了演示使用該指標進行交易的有效性,我將開始我自己的信號,我將在其中演示使用該指標進行手動交易。這將是完全手動交易,我將僅使用該指標的信號進行交易。您可以在鏈接 https://www.mql5.com/en/signals/1670778 上查看交易結果

MACD Scanner provides the multi symbols and multi-timeframes of MACD signals. It is useful for trader to find the trading idea quickly and easily. User-friendly, visually clean, colorful, and readable. Dynamic dashboard display that can be adjusted thru the external input settings. Total Timeframes and Total symbols as well as the desired total rows/panel, so it can maximize the efficiency of using the chart space. The Highlight Stars on the certain matrix boxes line based on the selected Scan M

В основу алгоритма этого осциллятора положен анализ веера сигнальных линий технического индикатора RSI . Алгоритм вычисления сигнальных линий выглядит следующим образом. В качестве исходных данных имеем входные параметры индикатора: StartLength - минимальное стартовое значение первой сигнальной линии; Step - шаг изменения периода; StepsTotal - количество изменений периода. Любое значение периода из множества сигнальных линий вычисляется по формуле арифметической прогрессии: SignalPeriod(Numbe
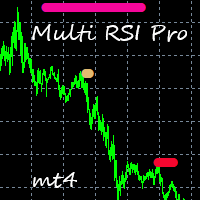
This indicator takes input from the RSI from multiple time frames (M/W/D/H4/H1), and presents the output on the main chart. Great for scalping. Features alerts for the current chart's TrendLine above or below price. TrendLine period setting. Multi RSI period settings. How to use: Simply attach to M5 (Scalping - zoom chart out completely on M5) or use on higher time frames' charts. Zoom chart out completely to get a better view of the chart. Hover over the lines to see the time frame applicable.

Wink IND is an indicator that tell you: -when MACD is saying buy or sell -when RSI is saying buy or sell -work on multi timeframes MT5 Version
by Wink IND: you don't need to have Knowledge about MACD or RSI don't need to check and compare MACD and RSI respectly don't need to check all of timeframes and compare the resaults don't lose time, save more time for your decisions in trading
Wink IND: multi timeframe indicator multi currency indicator show the positions by graphic shapes, arrows and

В основу алгоритма этого трендового индикатора положен анализ веера сигнальных линий универсального мувинга . Алгоритм вычисления сигнальных линий выглядит следующим образом. В качестве исходных данных имеем входные параметры индикатора: StartLength - минимальное стартовое значение первой сигнальной линии; Step - шаг изменения периода; StepsTotal - количество изменений периода. Любое значение периода из множества сигнальных линий вычисляется по формуле арифметической прогрессии: SignalPeriod(Nu
the trend line Alert indicator will inform you when the candlesticks crosses or touches the desired line. the indicator is having pop up and push notifications, see the pictures down how to setup, e.x, 1. pic one is alert 2. pic two is right click of the chart 3. pic three is how to change names of the trend so the indicator will detect 4. pic four is how you changed in the correct way any assistance please drop me via mql5 chat

Trend deviation scalper - is the manual system to scalp choppy market places. Indicator defines bull/bear trend and it's force. Inside exact trend system also defines "weak" places, when trend is ready to reverse. So as a rule, system plots a sell arrow when bull trend becomes weak and possibly reverses to bear trend. For buy arrow is opposite : arrow is plotted on bear weak trend. Such arrangement allows you to get a favorable price and stand up market noise. Loss arrows are closing by common p

Trend Arrow Super The indicator not repaint or change its data. A professional, yet very easy to use Forex system. The indicator gives accurate BUY\SELL signals. Trend Arrow Super is very easy to use, you just need to attach it to the chart and follow simple trading recommendations.
Buy signal: Arrow + Histogram in green color, enter immediately on the market to buy. Sell signal: Arrow + Histogram of red color, enter immediately on the market to sell.

Классический Parabolic SAR с цветовой визуальной индикацией действующего тренда и моментов его изменения на противоположный для ручного трейдинга. При необходимости символы сигналов покупки и продажи можно заменить, используя входные параметры индикатора Buy Symbol; Sell Symbol. Номера символов можно найти здесь .
Индикатор имеет возможность подавать алерты, отправлять почтовые сообщения и push-сигналы при смене направления тренда.

Gold Trend Pro Buy & Sell Signal Indicator Pairs : XAUUSD - XAGUSD - Crude OiL, EURUSD,GBPUSD,USDJPY,AUDUSD,GBPJPY,BTCUSD TimeFrame - 1 Min , 5Min, 15Min Once All Are Green Bar , And Also Englufing The Candle You Can Enter To Buy Once All Are Red Bar, And Also Engulfing The Candle You Can Entry To Sell And Next Once Change The Bar Colour , You Can Exit The Buy & Sell Order

Trend driver bars is the manual trading system, which defines current trend continue or it's pull-back/reverse. "Driver" bars - are price action patterns that has powerfull affect on market, defining it's near future direction. Generally, driver bars represents trend "skeleton" and often anticipates new market impulse. System plots arrows when market shows 3 pattenrs in a row(most powerfull combo-pattern), and makes fast scalping of incomming movement. Loss positions closes by common profit. Lot
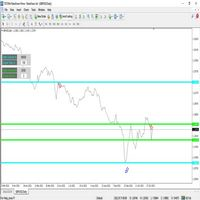
价格通道指标由两个独立的价格通道和水平价格区组成--(A/B)。该指标不断监测价格的行为和运动,以及通道水平的崩溃--(A/B),重新安排水平和固定新的极值和最小值区域。 对于以前和现在的高点和低点的分析,它不取决于每个通道的条数 - (A / B)。 该指标显示图表上每个通道的有用信息--(A/B)。 1. 分析中为每个通道指定的条数。 2. Delta - 每个通道的电平之间的距离。
1. 指标的应用实例:为了搜索和更新区域和新的本地最高和最低水平(顶部或底部),在通道-(A)中,我们指定范围-(100-500)条为例。我们不想使用通道(B),所以在通道(B)中我们表示(0)条。 -(B)通道的水平将在图表上消失,不会干扰我们。 2. 指标应用实例:当跟踪价格并在狭窄的走廊中打破平坦时,在渠道(B)中我们指出例如范围(1-5)条。 我们不需要对(0)条使用通道(A)。 -(A)通道的水平将在图表上消失,不会干扰我们。 3. 指标应用实例:在通道--(A/B)中,我们可以指定不同的条形范围,为每个通道指定自己的用途。
指标价格通道有八个信号缓冲区,用于编写和使用作者的专家顾问时
Calculate 28 pairs buy and sell volume real-time.
This Indicator is good for all trader. It will increase the accuracy and decision making of placing orders. It shows the strength and weakness of every currency. It's a great help to you. CurrencyStrength28pairs - The indicator calculates the price and the buy and sell volume of every currency pair. Show you the results on the board in real time. and averaged all currency pairs to show the strength of the current currency. Features
Result on the

Wave Impulse OmegaScalper - is the manual system for scalping. In many cases Indicator "eats" almost all possible trend wave. System defines up price wave and down price wave. Inside the exact wave - system defines true trend movement and choppy market. Indicator plots signals while market is trending, powerfull and has quiet good volatility. This is complete system with enter and exit points. Main Indicator's Features Signals are not repaint,non-late or disappear(exept cases when system recalcu

使用 Angle of Moving Average MT4 提升您的交易决策,这是一个创新指标,通过量化移动平均线的斜率,为趋势方向和动能提供清晰洞察。基于测量指定条数移动平均线角度的原则,这一工具自2010年左右在交易社区中概念化以来,已成为技术分析的支柱。在 Forex Factory 等论坛上广泛讨论,并因其对市场动态的直观可视化而受到赞誉,Angle of Moving Average 是复杂振荡器的强大替代品,为交易者提供直接的看涨或看跌偏见评估,免受过于复杂公式的干扰。 交易者青睐 Angle of Moving Average,因为它通过直观的柱状图显示—绿色表示上升动能,红色表示下降趋势—能够出色地发出趋势强度、潜在反转和最佳入场/出场点信号。通过计算当前移动平均线与其 N 条前的值的角度,它突出显示市场加速(大柱状图)或趋平(小或零角度)时刻,帮助在震荡期避免假信号。优势包括改善摆动和持仓交易的趋势确认,减少波动环境中的错误信号,通过在强角度入场提高风险回报比。适用于外汇、股票、指数和商品,此指标的警报确保您及时捕捉动能变化,提升趋势和反转市场中的整体盈利
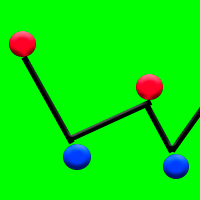
Dot scalp - shows price reversal points with 93% accuracy. Does not redraw points. Works well during sideways price movement when the market is flat. The indicator draws the points of price reversal or pullbacks on the chart.
How to use this indicator in trading? Add the Dot scalp indicator to the chart. Also download on the Internet any channel indicator that shows the channel on the chart. Wait for the sideways movement of the price, this is when the channel indicator draws a channel in the

Reverse side scalper is the manual trading system, that works on choppy(anti-trend) market. As a rule markets are on 80% choppy and only 20% is trend phase. System is based on custom step Moving and RSI and reverse pattern. System defines up movement, down movement, trend / choppy phases. Indicator plots Buy signal arrow when current direction is down and phase is trend, Sell signal arrow is plotted when currently is up movement and phase is trend. As a rule it allows to "catch" local maximum/mi

Binary step clouds - is the complete trading system with enter and exit points. System is based on double smoothed exponential step moving and volume weighted simple step moving.Generally each movings define trend direction and places when trend is in active phase. Signals plots when both movings approache to active trend phase and market speed is high. Main Indicator's Features Signals are not repaint,non-late or disappear(exept cases when system recalculates all history datas,refreshing main

Apollo Global Trends FX - 这是一个趋势指标,旨在预测任何货币对以及任何交易工具(包括金属、指数、股票、加密货币和其他交易工具)的市场趋势变动。该指标可用于任何时间范围。该指标适用于长期和短期交易。该指标可以作为主系统或指标的过滤器。该指标完美过滤市场噪音。该指标非常易于使用。你只需要跟随信号 该指示器提供所有类型的通知,包括发送到您的移动设备的通知。指标中没有设置。指标本身会根据您使用的图表进行调整,从而使交易尽可能简单和高效。 购买后,一定要写信给我! 我将与您分享使用该指标进行交易的建议。我还将免费为您提供一个指标,这将使交易更加有利可图和舒适。 感谢您的关注!祝您交易成功并盈利!

Apollo Price Action System - 它是一个完全基于价格行动原理的指标。一旦进入市场的条件根据指标的策略形成,指标就会发出买入或卖出的信号。该指标可用作基本交易系统或作为您自己交易系统的补充。 该指标非常易于使用。你只需要跟随信号。该指标在图表上显示趋势线,以及市场进入点和止损水平。要锁定利润,您可以使用 1:2 或更高的风险回报比。您还可以将此指标与支撑位和阻力位相结合以获得最佳结果。 该指标可在任何时间范围内使用。但最好在更高的时间范围内使用该指标以达到最佳效果。我更喜欢在 H1 和 H4 上使用这个指标。 该指标可以在任何时间范围内工作,但建议使用 D1。 购买后请写信给我。我将完全免费为您提供额外的指标。他们将帮助您充分利用您的系统 。 祝您交易成功!

折扣价为299美元! 未来可能会涨价! 请阅读下面的描述!
终极狙击手仪表盘的最佳进入系统。终极动态水平。(请查看我的产品)
由于MT4多币种测试的限制,终极狙击手仪表盘只适用于实时市场。
介绍Ultimate-Sniper Dashboard! 我们最好的产品包括HA-狙击手、MA-狙击手和许多特殊模式。终极狙击手仪表盘是一个绝对的野兽! 对于任何新手或专家交易者来说,这是最好的解决方案! 永远不要再错过任何一个动作!
对于那些喜欢简单和点数的交易者,我们有一个特别的产品给你。本质上很简单,该仪表板根据多种自定义算法查看28种货币对,完成所有工作。只需一张图表,你就可以像专家一样阅读市场。试想一下,如果你能在任何外汇对开始移动时准确地确定其方向,你的交易会有多大的改善。
我们的系统是为了寻找高概率信号并实时向用户发送警报。没有滞后或错误的信号。
为了保持图表的清洁,你可以在不需要时隐藏Ultimate-Sniper。只需按下箭头按钮即可隐藏仪表板。
Ultimate-Sniper适用于从1分钟到月度的所有时间框架,因此你可以在你选择的任何时间框架上快速发现趋势。
高概率信号
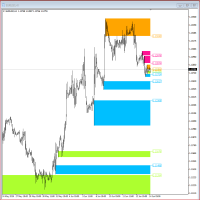
"Supply / Demand Zones"
The concepts of supply and demand zones are undoubtedly two of the most highly discussed attributes of technical analysis. Part of analysing chart of pattern , these terms are used by traders to refer to price levels i n charts that tend to act as barriers, preventing the price of an asset from getting pushed in a certain direction. At first, the explanation and idea behind identifying these levels seems easy, but as you'll find out, supply and demand zones can come

As per name Candles Talk, This Indicator is a affordable trading tool because with the help of Popular Developers & Support of M Q L Platform I have programmed this strategy. I tried to input history of candles with average Calculation regarding High, Low, Last High, Last Low with Moving averages. Furthermore, I have also taken help of Moving average So Trader can easily get in touch with market in another way also. What is in for Trader?
Arrows: Buy Sell Indications (Candles High
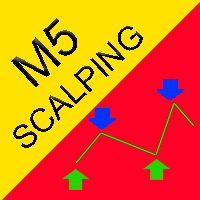
A ready-made trading system that shows with arrows when to buy and when to sell. The indicator does not redraw its arrows. Shows signals with 94% accuracy. Works on all currency pairs and all timeframes (recommended timeframes M5, M15, M30, H1). This is a ready-made trading system that trades according to the scalping strategy. The intraday indicator shows a large number of signals on the M5 and M15 timeframes.
How to trade with this indicator? When the red arrow appears, we need to look at th

该指标在图表上显示 "Rails "形态。该形态由两根主体相同、阴影较小的多方向蜡烛组成。 如果在当前时间框架内出现 "Rails "形态,那么在 x2 时间框架内则会出现针形柱(Doji)。 该指标通过简单的逻辑设置,以最有效的方式自动发现形态,您可以轻松更改。 可选择按趋势(2 条移动平均线)和反转(RSI 和布林线)进行过滤。 提供多货币面板。在它的帮助下,你可以轻松地在不同图表间切换。
交易模式: 趋势回测。 假突破。 其他。
EURUSD, GBPUSD, XAUUSD, ... M15、M30、H1。
输入参数。
基本参数。 Bars Count - 指标运行的历史条数。 Max Candles Shadows / Body Ratio - 阴影与蜡烛体的最大比率。如果阴影大于指定值,则忽略该蜡烛。计算公式为 (HL-OC)/OC。 Max Delta OC Ratio - 开盘价/收盘价之间的最大差异。0,1 - 10%. 不要设置高于 0.3,否则轨道将不复存在。 Calc HL Candles - 我们计算多少根烛光来确定平均烛光大小。 Minimal Ra

显示吞没烛台图案的指示器。 在设置中,您可以指定吞没的类型(主体,阴影和组合)。 可以按趋势(2个移动平均线)和反转(RSI和布林带)进行过滤。 这是一种非常受欢迎的价格行为模式。 多币种仪表板可用。 有了它,您可以轻松地在图表之间切换。
交易模式: 按趋势重新测试 。 假突破 。 订单区块 。 其他 。
EURUSD, GBPUSD, XAUUSD, ... M15, M30, H1 。
输入参数 。
主要 。 Bars Count – 指标将工作的历史柱的数量 。 Calc Mode – 选择一种吞没类型 。 3 Lines Strike (Close overlap First Open) 。
PPR (Close overlap High) - 紧密重叠高 。 High overlap High - 高重叠高 。 Close overlap Open - 关闭重叠打开 。 High and Close overlap High and Open - 高和关闭重叠高和开放 。 High-Low overlap High-Low - 高-低重叠高-低 。 Body Ca

当第二根烛台位于第一根烛台内部,即没有超出其极限时,该指标就会在图表上显示信号。 这种烛台形态被称为 "内棒形"。 这种形态不像 Pin Bar 或 Takeover 那样流行,但有时也会被一些交易者使用。 可以根据趋势(2 条移动平均线)和反转(RSI 和布林线)进行过滤。 提供多货币面板。在它的帮助下,您可以轻松切换图表。
交易模式: 趋势回测。 假突破。 其他。
EURUSD, GBPUSD, XAUUSD, ... M15、M30、H1。
输入参数。
基本参数。 Bars Count – 历史条数,指标将在其上运行。 Min Ratio Candles - 第一根蜡烛与第二根蜡烛的最小比率。 Calc Mode - 确定内部柱形的方法(HL、OC、HLOC)。
过滤器。 Filter 1 Trend And Reverse – 启用/禁用趋势、反向或两者的过滤器。 Trend – 根据 2 条移动平均线进行趋势筛选。 Reverse – 根据 RSI 振荡器过滤(默认已启用)。 Trend And Reverse – 启用两种模式,同时独立运行。 Filter 2
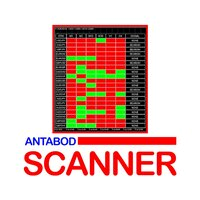
Antabod Scanner, Is a multi-timeframe scanner. It's a metatrader 4 indicator, which allows the detection of the trend of several pairs at a glance. I t will display on the platform any pair or pairs that all the timeframes, from the higher time frame to the lower timeframe, in the inputs, are all bullish or all bearish. When a pair is completely bullish, all the timeframes will be green, or when bearish all the timeframes will be red, and a sound will alert and a written alert will be displayed
MetaTrader市场是您可以下载免费模拟自动交易,用历史数据进行测试和优化的唯一商店。
阅读应用程序的概述和其他客户的评论,直接下载程序到您的程序端并且在购买之前测试一个自动交易。只有在MetaTrader市场可以完全免费测试应用程序。
您错过了交易机会:
- 免费交易应用程序
- 8,000+信号可供复制
- 探索金融市场的经济新闻
注册
登录