适用于MetaTrader 4的技术指标 - 7
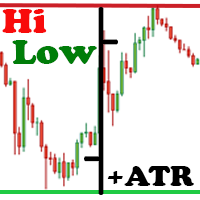
The Hi Low Last Day ( Hi Lo Last Day ) indicator shows the high and low of the last trading day and the second trading day, as well as the minimum and maximum of last week . There are many trading strategies on the daily levels. This indicator is indispensable when using such trading strategies. In fact, everything is simple in trading, you just need to understand and accept it for yourself. There is only price!!! What is price? This is the level on the chart. The level is the price that the

This indicator is another variant of the famous powerful indicator Fibonacci-SS https://www.mql5.com/en/market/product/10136 but has different behaviour in placing Pending Order and TP Line. Automatically places Fibonacci retracement lines from the last highest and lowest visible bars on the chart with: An auto Pending Order (Buy/Sell). Taking Profit 1, Taking Profit 2 is pivot point and Taking Profit 3 for extended reward opportunity. The best risk and reward ratio.
Simple and powerful indicat
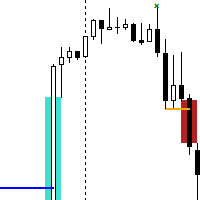
The Break of Structure (BoS) and Change of Character indicator with Fair Value Gap (FVG) filter is a specialized tool designed to enhance trading strategies by pinpointing high-probability trading opportunities on price charts. By integrating the BoS and Change of Character concepts with the FVG formation, this indicator provides traders with a robust filtering mechanism to identify optimal entry and exit points. The indicator identifies instances where the structure of price movements is disrup
FREE
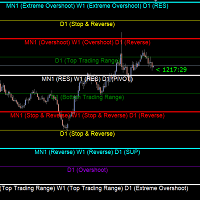
Gold Levels MTF - this is a fine stock technical indicator. The indicator algorithm analyzes the movement of the asset price, displays price levels of support and resistance from all time frames (TF) using the Murray method based on the Gann theory. The indicator indicates overbought and oversold fields, giving an idea of possible reversal points and at the same time giving some idea of the strength of the current trend. Description of levels: (Extreme Overshoot) - these levels are the ultimat
FREE
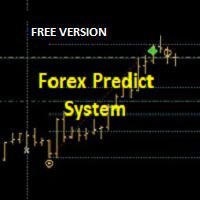
Hi Trader, ================================================================================ If you like my indicator, please do not hesitate to give a review and/or comment. Thank you! ================================================================================
This indicator draws trade entry zone and target levels based on the levels of the previous day.
A blue zone (BUY) or red zone (SELL) is drawn and two targets. The optimal trade entry value is also indicated.
A second gray zone is
FREE

"Wouldn't we all love to reliably know when a stock is starting to trend, and when it is in flat territory? An indicator that would somehow tell you to ignore the head fakes and shakeouts, and focus only on the move that counts?" The Choppiness Index is a non-directional indicator designed to determine if the market is choppy (trading sideways) or not choppy (trading within a trend in either direction). It is an oscillating indicator between -50 (very trendy) and +50 (very choppy). There are man

无重绘、无滞后。 修正趋势步长 (CTS) 是由 A. Uhl 设计的一种快速自适应移动平均线,旨在作为交易中的响应指标,通常与速度较慢的修正移动平均线 (CMA) 结合使用,构建交叉系统。它能够适应市场波动,从而减少横盘整理或区间震荡行情中的虚假信号。
修正趋势步长的关键特性包括:
目的:旨在通过调整以适应当前价格走势,从而改进传统的移动平均线。
方法:基于指数平均,它最大限度地减少了传统平均线在非趋势市场中产生虚假交叉的问题。
功能:它被设计为完整交叉系统中的“快速”自适应组件。 • 更贴近价格 • 更适合作为 快线 • 在趋势中反应迅速 • 在震荡中自动“钝化” InpLength (14) : 计算方差的周期,默认100。与 CMA 配合使用时常用相同周期或更短周期 InpMult (1.0) : 乘数,通常保持1.0 InpPrice (PRICE_CLOSE) : 应用价格类型,可选择收盘价、开盘价、高低点等

MT4多時限訂單塊檢測指示器。
特徵
-在圖表控制面板上完全可自定義,提供完整的交互。
-隨時隨地隱藏和顯示控制面板。
-在多個時間範圍內檢測OB。
-選擇要顯示的OB數量。
-不同的OB用戶界面。
-OB上的不同過濾器。
-OB接近警報。
-ADR高低線。
-通知服務(屏幕警報|推送通知)。
概括
訂單塊是一種市場行為,它指示從金融機構和銀行收取訂單。著名的金融機構和中央銀行帶動了外匯市場。因此,交易者必須知道他們在市場上正在做什麼。當市場建立訂單塊時,它會像發生大多數投資決策的範圍一樣移動。
訂單建立完成後,市場將朝著上升和縮小的方向發展。訂單大宗交易策略的關鍵術語是它包括機構交易者正在做的事情。由於它們是主要的價格驅動因素,因此包括機構交易在內的任何策略都可以。
您將在任何時間範圍內實時看到訂單塊,使用我們的控制面板,您將能夠在所選的歷史記錄週期內檢測常規,拒收和未大寫的訂單塊。
現在您可以接收到訂單塊接近警報,我們在MT4上顯示屏幕通知,並將通知推送到您的手機!

Volumatic Fair Value Gaps is a precision-engineered indicator for identifying, analyzing, and visualizing Fair Value Gaps (FVGs) backed by volume intelligence. This tool goes beyond standard FVG plotting by dissecting volume dynamics inside each gap using lower-timeframe sampling , offering clear insight into whether bulls or bears dominate the imbalance. Designed for technical traders, this indicator overlays high-probability gaps only, visualizes bullish vs. bearish volume compositio

Venom Trend Pro — 多时间框架趋势分析工具 Venom Trend Pro 是一款趋势跟随和波段交易指标,旨在帮助识别任何货币对和时间框架中的明确方向性移动。它适用于外汇、黄金、加密货币、指数等市场的日内和波段交易设置。 该指标分析近期的价格结构和动量,以检测新兴或持续的趋势。一旦趋势被确认,信号将保持固定 —— 蜡烛收盘后不重新绘制。 主要特点: 支持所有时间框架(M1 至 MN) 确认后信号稳定,不重新绘制 兼容多种资产:外汇、金属、加密货币、指数 设计用于支持趋势的进入和退出 清晰、简洁的显示,减少图表杂乱 Venom Trend Pro 提供了一种结构化的方法来确定市场方向,避免噪音。它非常适合寻求在冷静、基于规则的框架中获得清晰视觉信号的交易者。
FREE
Welcome to enhanced pattern detection with the Double Top and Bottom Pattern Scanner ! Transform your trading approach with this powerful MT4 indicator designed for efficient pattern scanning and actionable alerts. Key Features: Advanced Zig Zag Pattern Detection : The Double Top and Bottom Pattern Scanner uses the zig zag pattern to detect tops and bottoms. It identifies points where the price bounces back twice from the same level after a long trend, signaling potential market reversals. Real

Consolidation Zone Indicator is a powerful tool designed for traders to identify and capitalize on consolidation patterns in the market. This innovative indicator detects consolidation areas and provides timely alerts when the price breaks above or below these zones, enabling traders to make informed trading decisions. MT5 Version : https://www.mql5.com/en/market/product/118748 Join To Learn Market Depth - https://www.mql5.com/en/channels/suvashishfx
Key Features:
1. Consolidation Detecti
FREE

这是免费产品,欢迎您使用以满足您的需求!
我也非常感谢您的积极反馈!非常感谢!
点击这里查看高质量的交易机器人和指标!
Crypto_Forex 指标:Heiken Ashi Candles for MT4。无需重绘。 - Heiken_Ashi_Candles 与趋势线 MA 指标完美结合,如图所示。 - 指标 Heiken_Ashi_Candles 是非常有用的辅助指标,可以使趋势更加明显。 - 它有助于使烛台图更具可读性,趋势更易于分析。 - 大多数利润是在市场趋势时产生的,因此正确预测趋势是必要的。 - Heikin-Ashi 图表的构造类似于常规烛台图,只是计算每个条的公式不同 - Heikin-Ashi 具有更平滑的外观,因为它本质上是取运动的平均值。 - 绿色蜡烛没有下影线,表示强劲的上升趋势。 - 红色蜡烛没有上影线,表示强劲的下降趋势。 - 蜡烛主体较小,周围有上下影线,表示趋势发生变化或修正。 这是仅在此 MQL5 网站上提供的原创产品。
FREE

Renko Charts with Heiken Ashi Filter now have the alerts and the Win-rate . Now you can know which signal will give you that edge your trading needs. Risk to Reward Settings Wins versus Losses Count There are four alert types to choose from for notification on screen, email or phone notification. The alert types also have buffers for use with automation. This indicator can be incorporated with any system that requires renko charts. The four (4) alert types are: Three-bar Formation ; Pinbar

介绍 Quantum Breakout PRO ,突破性的 MQL5 指标,正在改变您交易突破区域的方式! Quantum Breakout PRO 由拥有超过 13 年交易经验的经验丰富的交易者团队开发,旨在通过其创新和动态的突破区域策略将您的交易之旅推向新的高度。
量子突破指标将为您提供带有 5 个利润目标区域的突破区域的信号箭头,以及基于突破框的止损建议。
它既适合新手交易者,也适合专业交易者。
量子 EA 通道: 点击这里 MT5版本: 点击这里 重要的!购买后请私信我领取安装手册。 建议:
时间范围:M15 货币对:GBPJPY、EURJPY、USDJPY、NZDUSD、XAUUSD 账户类型:ECN、Raw 或 Razor,点差极低 经纪商时间:GMT +3 经纪商:IC Markets、Pepperstone with Raw 和 Razor 的点差最低
规格:
不重漆! 最多 5 个建议利润目标区域 建议止损水平 可定制的盒子。您可以设置自己的 Box Time Start 和 Box Time End。
接触
如果您
该指标在图表上绘制了供需区域。结合您自己的规则和技术,该指标将允许您创建(或增强)您自己的强大系统。还请查看提供更多功能的 付费版本 。我的建议是寻找在至少 25 个条形图后发生第一次区域测试的交易机会。 特征 区域有 3 种颜色(可通过输入调整)。深色表示未测试区域,中色表示已测试区域 ,浅色表示损坏区域 。 每个区域都写有区域外边界的价格以及区域测试的数量。 输入参数 最大后退柱线以搜索第一个极值 - 默认值为 3000。将搜索 xx 前的第一个极值。值越高,需要的系统资源就越多 。对于较慢的计算机,500-1000 的值可能更合适。 区域测试之间的最小蜡烛数量 未经测试的需求颜色 测试需求颜色 破碎需求颜色 未经测试的供应颜色 已测试的供给颜色 破损供给颜色 文本颜色 测试次数标签的字体大小 价格标签尺寸 [1-3]
FREE

Welcome to our Price Wave Pattern MT4 --(ABCD Pattern)-- The ABCD pattern is a powerful and widely used trading pattern in the world of technical analysis.
It is a harmonic price pattern that traders use to identify potential buy and sell opportunities in the market.
With the ABCD pattern, traders can anticipate potential price movements and make informed decisions on when to enter and exit trades. EA Version : Price Wave EA MT4
MT5 version : Price Wave Pattern MT5
Features :
Automatic
FREE

MetaTrader 4/5 中的 MACD 指标看上去与其它许多图表软件里的 MACD 不同。这是因为 MetaTrader 4/5 版本的 MACD 显示 MACD 曲线作为直方图,而传统上显示为曲线。此外,MetaTrader 4/5 版本使用 SMA 计算信号线,而根据 MACD 的定义,它应该使用 EMA。MetaTrader 4/5 版本也不计算实际的 MACD 直方图 (即 MACD 与信号线之间的差异)。这可能对那些 MetaTrader 4/5 的新手带来困惑,因为将 MACD 线显示为直方图,而未提供实际的 MACD 直方图。 这款指标按照其创造者 (Gerald Appel) 的定义显示 MACD,如同其它图表软件里显示的那样。而 MACD 线的计算采用 "快速" EMA 和 "慢速" EMA 之间的差异。信号线是 MACD 线的 EMA。MACD 直方图是MACD 和信号线之间的差异 (MACD 直方图可自行作为可靠的用作背离信号)。 True/False 启用开关,您可以显示/隐藏 MACD/信号线,以及 MACD 直方图。
FREE
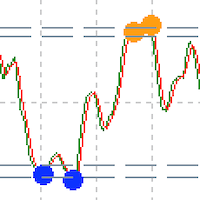
Custom Relative Strength Indicator with multiple timeframe selection About RSI The relative strength index is a technical indicator used in the analysis of financial markets. It is intended to chart the current and historical strength or weakness of a stock or market based on the closing prices of a recent trading period. Features
Indicator gives alert when reached oversold or overbought levels Gives dot indication while reaching levels. Can set indicator bar alert intervals for alerts Can choos
FREE
MT5版本下载地址: https://www.mql5.com/en/market/product/50255
Telegram频道及群组: https://t.me/bluedigitsfx
VIP群组访问: 付款凭证请发送至我们的收件箱
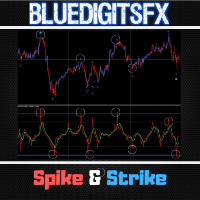
推荐经纪商: https://bit.ly/BlueDigitsFxStarTrader BlueDigitsFx Spike And Strike Reversal — 强力混合振荡器,精准识别市场反转 BlueDigitsFx Spike And Strike Reversal 是一款复合振荡器,结合多种指标信号,帮助您精准预测市场反转。 该指标集成了两个模块,其中包括基础振荡器,并通过箭头清晰标示最佳入场点。 主要功能 简单、直观且高效的反转检测 能过滤并增强您现有的交易策略 信号严格基于K线收盘触发,可靠性高 适用于所有品种和时间周期(推荐1小时及以上) 内置弹窗、邮件、推送通知及声音提醒 如何使用 BlueDigitsFx Spike And Strike Reversal 交易 买入设置: Spike and Strike 数值下
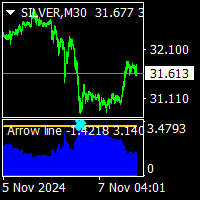
Arrow line indicator is no repaint trend indicator. it works on all time frame and all pairs. it is a pi number ( π) trigger based trend indicator. suitable for experienced traders and beginners. easy to understand. there is a trigger line and 2 histograms. red histogram is ower trigger that is top signal.. blue histogram is over trigger that is bottom signal. minimum bar number is 500. processed value must be setled between 500-3000. max value is depend to chart you are using.
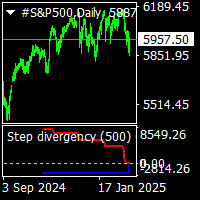
step divergency indicator is a buy sell divergency indicator.include sinus wave indicator. it work all timeframes and all pairs. red line gives step divergency sell formations. blue line gives step divergency buy formations. suitable for experienced and beginners. when prices is moving up and red lines step down ..this is sell divergecy formation and if prices moving down but blue line moving step up this is buy divergency formation. increased cnt value show more back side. gold line is sinus w

The indicator plots higher timeframe Kijun-sen (of Ichimoku ) on lower timeframes.
To change timeframes, in the timeframe field enter the number:
M1 PERIOD_M1 1 1 minute. M5 PERIOD_M5 5 5 minutes. M15 PERIOD_M15 15 15 minutes. M30 PERIOD_M30 30 30 minutes. H1 PERIOD_H1 60 1 hour. H4 PERIOD_H4 240 4 hour. D1 PERIOD_D1 1440 Daily. W1 PERIOD_W1 10080 Weekly. MN1 PERIOD_MN1 43200 Monthly.
By default, the Kijun is shifted 3 periods forward but if you wish to have it exactly as

The GGP Squeeze Momentum MT4 Indicator is a volatility and momentum tool designed to help traders optimize their trading performance and providing traders with actionable insights to make well-informed trading decisions. This indicator is MT4 conversion of the Squeeze Momentum Indicator by “LazyBear “ in Trading View website and some alert methods are added to provide real-time alerts when a trading signal is generated, in order to allow traders to act quickly and efficiently. For MT5 version p

Presenting the uGenesys Break of Structure and Change of Character Indicator The uGenesys Market Structure Indicator is the advanced solution designed specifically for forex traders seeking a competitive edge. This innovative tool goes beyond merely identifying Break of Structure (BoS) and Change of Character (CHoC); it also illuminates optimal entry and exit points on your forex charts, transforming your trading experience.
While the uGenesys Market Structure Indicator can reveal pivotal pat

COMMERCIAL SESSIONS This indicator shows in the selected graph divided by tables each of the sessions ASIA, JAPAN, LONDON, NEW YORK: Allows you to configure: Session Color ASIA, JAPON, LONDRES, NEW YORK Hide and show each session It works in the lowest timeframes on the market, among which H4, H1, M15, M5 and M1 are recommended. (Don't forget to check out our other indicators)

Introducing Auto Trendline Pro : Your Ultimate Trading Companion Are you tired of manually drawing trendlines on your forex charts? Do you wish for a tool that can simplify your trading while providing timely alerts? Look no further, because Auto Trendline Pro is here to revolutionize your trading experience. In the fast-paced world of forex trading, staying ahead of the curve is essential. Identifying trends, both upward and downward, can be a game-changer. This is where Auto Trendline Pro s
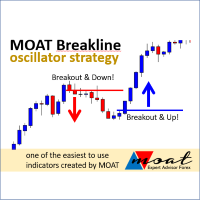
The indicator will provide a breakout line or price stop guide, we recommend M5 or H1 timeframes. Trade signal: Buy Signal: if the closed price (according to the timeframe) breaks the blue line and is already above it or if the lowest price stops above the red line. Sell Signal : if the closing price (according to the timeframe) breaks the red line and is already below it or if the highest price stops below the blue line. Feature: You will get time (hours) and price values for the lines

*This is tradingview indicator converted to mql4*
The Chandelier Exit Indicator is a popular technical analysis tool developed by Chuck LeBeau. It is designed to help traders identify potential exit points for their trades based on market volatility and the concept of trailing stops. The Chandelier Exit Indicator consists of three main components: Average True Range (ATR): The indicator utilizes the Average True Range, which measures market volatility. The ATR calculates the average range betwe
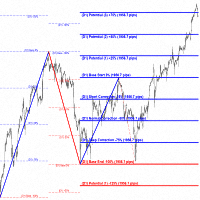
"Impulses and Corrections 4" is created to help traders navigate the market situation. The indicator shows multi-time frame upward and downward "Impulses" of price movements. These impulses are the basis for determining the "Base" , which is composed of zones of corrections of price movements, as well as "Potential" zones for possible scenarios of price movement.
Up and down impulses are determined based on a modified formula of Bill Williams' "Fractals" indicator. The last impulse is always "U

The KT 4 Time Frame Trend is an invaluable forex indicator for traders seeking to identify the trend direction across 4-time frames accurately. This innovative indicator allows users to simultaneously observe and analyze price trends across four different timeframes. Whether you're a beginner or an experienced trader, this tool offers an enhanced understanding of trend dynamics, leading to improved trading strategies on your trading platform. The capability to concurrently monitor multiple timef

Super Trend Button Super Trend is a trading strategy according to which one should trade Forex or Stocks when its price trend goes up, and trend goes down, expecting price movements to continue. “The trend is your friend” agree? Features - Special Button : Quick hide/show Super Trend chart. ( Make your Chart more clean and clear easily) - Color : You have the option of customising your favourite colour of Up Trend or Down Trend . - Super Trend Periods : You have the option to c

Introducing the "Extreme Exhaustion Levels": A powerful tool for traders looking to identify market exhaustion and potential trend reversals. The Exhaustion Indicator is an advanced technical analysis tool that helps traders identify when markets are overbought or oversold, potentially indicating an imminent reversal in the trend. With a unique combination of price action, moving averages, and Bollinger Bands, the Exhaustion Indicator provides traders with a comprehensive view of market condit
The Ichimoku indicator is an entire system by itself with an amazing win rate many traders feel that the chart looks like a mess when we add the indicator to the chart this is because there are too many elements present in the indicator we have a solution for that now "TT Ichimoku on off button indicator" ABOUT THIS INDICATOR This is an Ichimoku indicator that has the toggle feature separately for every element ie. Kumo cloud button, kijun button, etc... you can also hide/show the indicator

40% off. Original price: $50 (Ends on February 15) Advanced Bollinger Bands Scanner is a multi symbol multi timeframe Bollinger bands dashboard that monitors and analyzes the Bollinger Bands indicator from one chart. This panel monitors the Bollinger bands indicator in up to 28 configurable instruments and 9 timeframes for price overbought/oversold, price consolidation (Bollinger bands squeeze), and consolidation breakout (squeeze break) with a deep scan feature to scan all market watch symbo
25% off. Original price: $40 (Ends on February 15) RSI Scanner is a multi symbol multi timeframe RSI dashboard that monitors Relative Strength Index indicator for price entering and exiting overbought and oversold in up to 28 symbols and 9 timeframes.
Download Demo here (Scans only M1 and M5) Settings description here MT5 version here
RSI Scanner features: Signals RSI entering and exiting the overbought and oversold zones. Monitors 28 customizable instruments and 9 timeframes at the sam

Quants 移动平均线斜率是非常强大的指标,可以提供方向指示和动量。 指标不重绘。您可以有效地计算 ma 角度并找到趋势。
一旦信号蜡烛关闭,利润计数就开始了。 所以它是在现场的确切结果。
建议的 TimeFrame 在 H1 上使用它。 指标的所有选项都是可编辑的。
提示:交易摆动和趋势突破方向。 分形、砖形柱和博林格带可以提高准确性和盈利能力。
使用角度线的发散方法可能会发现高点和低点。 该指标可用作支撑阻力、供需指标的额外确认。
Ma 斜率信息对于以趋势方向进入并具有退出点非常有用。 它适用于外汇、股票、指数。
您可以通过 PushNotifications / Email / SoundAlerts / PopUpAlerts 发出警报。
如果需要任何改进,您可以随时告诉我。
此致,
数量
FREE

Trading doesn’t have to be complicated. With the right visual guidance, market decisions become clearer, calmer, and more confident.
Nebula Arrow is designed to help traders focus on what truly matters: high-quality entries based on refined market behavior. Just load it on your chart and let the arrows guide your trading decisions. Trade With Confidence We believe that simplicity is power. Nebula Arrow was created after extensive market observation and practical research, transforming complex
FREE

Free automatic Fibonacci is an indicator that automatically plots a Fibonacci retracement based on the number of bars you select on the BarsToScan setting in the indicator. The Fibonacci is automatically updated in real time as new highest and lowest values appears amongst the selected bars. You can select which level values to be displayed in the indicator settings. You can also select the color of the levels thus enabling the trader to be able to attach the indicator several times with differe
FREE

ADR 警報儀表板一目了然地向您顯示當前價格相對於其正常平均每日範圍的交易位置。當價格超過您選擇的平均範圍和高於它的水平時,您將通過彈出窗口、電子郵件或推送獲得即時警報,以便您可以快速跳入回調和反轉。破折號旨在放置在空白圖表上,只需坐在背景中並在達到水平時提醒您,因此您無需坐下來觀看甚至看! 此處提供 MT5 版本: https://www.mql5.com/en/market/product/66316
新:現在還向您顯示平均每周和每月範圍,並提醒他們!
獲取在您的圖表上繪製水平的 ADR 反轉指標: https://www.mql5.com/en/market/product/62757
大約 60% 的時間價格在其正常的平均每日範圍 (ADR) 內交易並推高這些水平通常是價格急劇波動的指標,通常會出現回調(獲利了結)走勢。您可以通過交易從每日範圍的頂部或底部回落到最近的支撐位或阻力位來利用這些急劇波動。
收集了超過 20 年的歷史數據,以找出主要外匯對和一系列交叉盤的價格超出特定 ADR 水平的平均百分比。該數據表明價格僅在 3% 的時間內超過其 ADR 的 200%,

A simple indicator that automatically highlights all FVGs (Fair Value Gaps) formed on the chart, as well as FVGs on history. It is possible to select colors for FVGs of different directions (long or short), select the time interval, select the color of middle point and you can also choose whether to delete filled FVGs or leave them on the chart (the option is beneficial for backtesting). The indicator can be very useful for those, who trade according to the concept of smart money, ICT, or simply
FREE
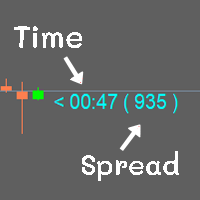
Show the time of candlesticks and spread. All data will be displayed in a rod. Can change color Can fix the size as needed
MT4 : Link https://www.mql5.com/en/market/product/102742 MT5 : Link https://www.mql5.com/en/market/product/102834
Most free code on various websites I didn't write it myself. I only do a little bit.
If you like it, please give 5 stars with it. Thank you.
FREE

MACD divergence indicator finds divergences between price chart and MACD indicator and informs you with alerts (popup, mobile notification or email). Its main use is to find trend reversals in the chart. Always use the divergence indicators with other technical assets like support resistance zones, candlestick patterns and price action to have a higher possibility to find trend reversals. Three confirmation type for MACD divergences: MACD line cross zero level Price returns to previous H/L Creat
FREE
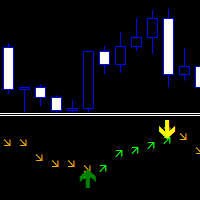
Direction Change Detector — 区分看涨和看跌走势之间平衡的趋势指标。它有两条箭头,并带有确认其方向的信号。
可以作为寻找趋势的独立指标,也可以作为开启交易和遵循信号方向的附加工具。
适应任何市场和时间范围。 没有在历史上重现他的证词。 有几种类型的通知。 指向上方的绿色箭头表示价格看涨方向。 指向下方的橙色箭头表示价格看跌方向。 有 1 个可自定义的参数来改变读数。当方向数量增加时,价格变得更平滑(用于较低的时间框架),当方向数量减少时,价格变得更早(用于较高的时间框架)。
Length Directions - 用于计算方向变化的蜡烛数量。 ----------------------------------------------------------------------------
FREE

YOU CAN NOW DOWNLOAD FREE VERSIONS OF OUR PAID INDICATORS . IT'S OUR WAY OF GIVING BACK TO THE COMMUNITY ! >>> GO HERE TO DOWNLOAD
The Volatility Ratio was developed by Jack D. Schwager to identify trading range and signal potential breakouts. The volatility ratio is defined as the current day's true range divided by the true range over a certain number of days N (i.e. N periods). The following formula is used to calculate the volatility ratio: Volatility Ratio (VR) = Today's True Range/Tru
FREE
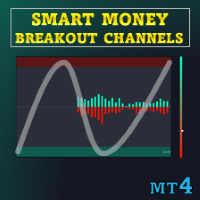
特别优惠 : ALL TOOLS ,每个仅 $35 ! 新工具 在 第一周 或 前 3 笔购买 期间价格为 $30 ! MQL5 上的 Trading Tools 频道 :加入我的 MQL5 频道,获取我的最新消息 该指标绘制称为 “Smart Breakout Channels” 的突破检测区域,基于按波动性归一化的价格运动。这些区域以带有成交量叠加的动态框显示。该工具使用自定义的归一化波动率计算来检测临时的累积或分配区间,并在价格向上或向下超出这些区间时进行标记。每个通道代表一个结构化区间,并辅以成交量差(delta)、上涨/下跌成交量以及带有渐变的可视化仪表,为动量偏向提供背景。 查看 MT5 版本: Smart Breakout Channels MT5 Scanner
查看 MT4 版本: Smart Breakout Channels MT4 Scanner 查看更多产品: 所有产 品 概念 通过测量价格的标准差并使用定义回溯期内的最高价和最低价将其映射到 [0,1] 量表来执行归一化价格波动性的计算。当归一化波动率达到局部低点后

VR Donchian 指标是 Donchian 通道的改进版本。改进几乎影响了通道的所有功能,但主要的操作算法和通道构造被保留。根据当前趋势,水平颜色的变化已添加到球指示器中 - 这可以清楚地向交易者显示趋势或持平的变化。添加了通过智能手机、电子邮件或 MetaTrader 终端本身通知交易者有关两个通道级别之一突破的功能。添加了价格标签,交易者可以在其帮助下查看图表上的价格水平。由于交易者可以自己设置指标计算的周期数,经典唐奇安指标的运行算法得到了优化和加速。经典的 Donchian 指标计算 MetaTrader 终端中可用的整个历史记录,这会给 MetaTrader 终端带来大量数学计算负载。 VR Donchian 指标仅计算交易者在设置中设置的金额,这将 MetaTrader 终端的负载减少了数十倍和数百倍。 高质量的交易机器人、指标、配置文件中的设置 [作者] Donchian Channel 是由 Richard Donchian 开发的通道指标。唐奇安通道被认为是最准确的通道之一。经典的唐奇安通道指标严格建立在局部高点和低点的顶部,是交易区间突破规则的变体。 优点 显
FREE
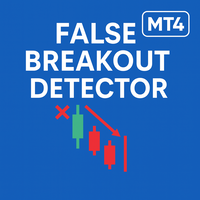
False Breakout MT4 是一个用来识别价格短暂突破最近支撑/阻力后迅速回到原来区间的情形的指标。这类“假突破”对主观分析或逆势策略很有价值,提供清晰的视觉提示,但不做预测性或自动化交易决策。 主要功能: 自动检测近期高低点附近的假突破(例如:扩展的日线水平覆盖两天)。 通过箭头和趋势线段清晰标注失败突破的价格动作。 可定制的提醒:弹窗和推送通知(需配置好接收设备)。 用户可调参数:扫描的K线数量、点差容忍度、箭头偏移、颜色等。 轻量级实现,优化以提升执行速度与回测表现。 不含预测算法:不提供保证的信号,仅辅助技术判断。 兼容性: 时间框架:M1 到 H4。 交易品种:外汇、指数、股票、大宗商品。 说明: 本版命名为 False Breakout MT4 。如果需要 MetaTrader 5 版本,请访问: https://www.mql5.com/en/market/product/145504 免责声明: 交易结果没有保证。此指标用于突出价格行为,应与风险管理和完整交易策略结合使用。 假突破, 假突破 mt4, mt4 假突破, 失败突破 mt4, 虚假突破 mt4,
FREE

该指标基于著名的分形指标,但具有很强的定制性 和灵活性,
这是识别趋势逆转并最大化您的利润潜力的强大工具。
凭借其先进的功能和用户友好的界面,它是各个级别交易者的最终选择。 MT5 版本: Ultimate Fractals MT5 特征 :
可定制的分形蜡烛数。 反转线。 可定制的设置。 用户友好的界面。 主要参数: 左侧蜡烛 - 左侧形成分形的条形数量。 右侧蜡烛 - 分形右侧的条形数量。
不要让市场的不确定性阻碍您。使用“终极分形”指标提升您的交易游戏。
加入依赖此工具做出自信决策并实现财务目标的成功交易者行列。 请随意定制此产品描述,以突出显示您的特定“Ultimate Fractals MT4”指标的任何独特功能或优点,
并向我询问有关产品的任何问题或建议。
FREE
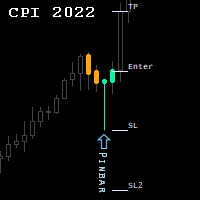
Candlestick Patterns Indicator.
NEW! FREE Candlestick Patterns Expert Advisor > https://www.mql5.com/en/market/product/105634?source=Site +Profile
The Indicator draws colored candlestick patterns, their description and future levels of Stop Loss / Take Profit. Combined with other market analysis, can greatly improve trading results. Indicator can be highly customized by the user including change of colors, fonts, levels, candle sizes etc...
developed, tested and optimized on " VantageMark
FREE
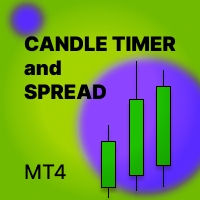
Candle_Timer_and_Spread 指标在一张图表上显示蜡烛结束之前的时间以及价格变化的百分比以及所选交易品种的点差。
默认情况下,当前时间范围内蜡烛结束之前的时间以及价格变化相对于当天开盘价的百分比的计时器位于图表的右上角。 该面板显示所选交易品种当前价格相对于当日开盘价的价差和百分比变化。该面板默认位于左上角。
输入设置: Candle_Time_Lable_Settings - 蜡烛结束前的计时器类型设置以及当前交易品种的价格变化。 Font_Size - 字体大小。 X_offset - 沿横坐标轴移动。 Y_offset - 沿纵坐标轴移动。 Text_color - 字体颜色。 Multi_Symbol_Settings - 多符号面板的设置。 Symbols_to_work - 手动输入面板将显示的符号,以逗号分隔。可以是任意数量的字符。仅显示添加到 Market_Watch 的交易品种。 Show_spread_tab - 是否显示传播列。 Show_daily_change_tab - 是否显示当前价格相对于当日开盘价的变化列。 Colorful_p
FREE
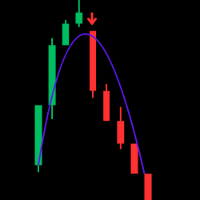
Trend WTS — Advanced Modular Trend & Signal Indicator for XAUUSD (M5 Optimized) Unlock precise trading insights with Trend WTS , a powerful and modular trend and signal indicator designed specifically for XAUUSD on the M5 timeframe. Built for traders seeking accuracy and clarity, Trend WTS combines fast moving average crossovers with a long-term EMA filter to deliver reliable buy and sell signals tailored for the gold market. Key Features: Dual Moving Average Trend Detection: Detect strong trend
FREE
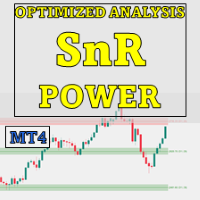
Special offer : ALL TOOLS , just $35 each! New tools will be $30 for the first week or the first 3 purchases ! Trading Tools Channel on MQL5 : Join my MQL5 channel to update the latest news from me 概述
OA SnR Power 是一款强大的工具,旨在帮助交易者识别并评估支撑和阻力水平的强度。通过整合交易量、反弹频率和重新测试次数等关键因素,该指标提供了市场关键价格区域的全面视图。 查看更多产品: 所有 产品 OA SnR Power 的工作原理 识别峰值和谷值 该指标使用智能算法计算局部高点和低点。 用户可以配置区域宽度设置,以确保准确检测潜在的支撑和阻力水平。 过滤和合并关键水平 基于用户定义的百分比范围,临近的水平会自动合并,从而使图表更加清晰,并专注于重要的价格区域。 颜色编码的视觉反馈 OA SnR Power 直接在图表上绘制支撑和阻力水平,并附
FREE
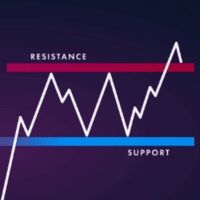
MT4 版本: https://www.mql5.com/en/market/product/157679
MT5 版本: https://www.mql5.com/en/market/product/157680
支撑阻力指标 — 智能市场结构水平
一款简洁、智能且高度可靠的支撑阻力指标,专为专业交易者和自动化交易系统打造。
支撑阻力指标采用先进的聚类算法,结合分形、基于 ATR 的价格分割和多时间框架分析,旨在检测真实的市场水平。
该指标并非绘制随机或嘈杂的线条,而是生成经过统计验证的水平线,这些水平线代表价格反复出现反应的位置,因此非常适合主观交易、算法交易、风险管理和突破验证。
主要特性
高级支撑阻力引擎
采用 ATR 缩放网格分割
将上下分形聚类,形成高精度的结构水平
使用精度模式(高/中/低)过滤噪声
兼容多时间框架
扫描支撑阻力位:
当前图表时间框架,或
M1、M5、M15、M30、H1、H4、D1、W1、MN1
非常适合在较低时间框架交易时依赖较高时间框架结构的交易者。
清晰的可视化效果
自动绘制支撑线和阻力线
可选的基于距离阈值的
FREE

Introducing Volume Orderflow Profile , a versatile tool designed to help traders visualize and understand the dynamics of buying and selling pressure within a specified lookback period. Perfect for those looking to gain deeper insights into volume-based market behavior! MT5 Version - https://www.mql5.com/en/market/product/122657 The indicator gathers data on high and low prices, along with buy and sell volumes, over a user-defined period. It calculates the maximum and minimum prices during this

揭示交易见解与自动锚定VWAP: 自动锚定VWAP 是您在交易世界中的指导伙伴。这些指标能够精准地定位市场关键转折点,并使用VWAP线在您的图表上进行标记。这对于采用锚定VWAP策略的交易者来说是一个改变游戏规则的工具。 它如何工作? 识别高点: 如果当前蜡烛的最高价格低于前一蜡烛的最高价格, 并且前一高点高于之前的高点, 我们就识别出了一个峰值。 这个重要的点位于这三根蜡烛的中间位置。 识别低点: 如果当前蜡烛的最低价格高于前一蜡烛的最低价格, 并且前一低点低于之前的低点, 我们就发现了一个底部。 这个底部的中心是我们的关注点。 绘制锚定VWAP: 每个顶部和底部都对应一个VWAP线。但有一个限制:由于指标的计算需求,图表上一次只能显示8条线。 随着更多的线条出现,旧线条让位给新线条。如果一个新的锚定VWAP线关闭,它将再次为旧的锚定VWAP线打开路径。 您有权掌控!根据您的节奏调整“时间框架”设置。请记住,在确认峰值或低谷之前,等待您选择的时间框架的蜡烛关闭。需要三根蜡烛来确认它们,我们会指向中间的那一根。 为了更平稳地交易,保持“当前时间框架”设置。如果您喜欢历史分析,请选择“更

Auto Optimized MFI 是一款自适应指标,通过对历史数据进行真实交易模拟,自动调整最适合您市场和时间周期的 MFI 买入/卖出水平。不同于传统固定的 80/20 阈值,它根据实际价格与成交量的行为进行优化,帮助您找到更有效的进出场区域。 工作原理 该指标会扫描指定范围内的历史K线,并基于MFI信号进行交易模拟,记录每次交易的胜率、回撤、止盈止损等表现。根据这些结果,它会自动在每日、每周或每月周期内更新最优的 MFI 水平,使策略始终贴近当前市场状态。 主要功能 可自定义的 MFI 周期(默认:14) 优化所用的历史K线数量(优化范围) 买入/卖出水平的边界设定 可调节的步进间距,用于精细优化 设置最小利润目标,过滤无效策略 MFI线和信号箭头的样式可自定义 这款工具非常适合寻求策略自动优化的交易者,使您的交易系统能随着市场动态不断调整,而不再依赖固定规则。

It identifies the pivot, support, and resistance price levels of the selected timeframe and then draws lines onto the chart. FEATURES: Option to specify the Timeframe Period in the PivotSR calculation. Option to display the PivotSR of the last candle, of every candle, or of the current candle. Options for displaying labels, line thickness, and line color. PivotSR can be interpreted as reversal levels or past price reactions that can be used as the basis for current price analysis. Some traders b
FREE

PUMPING STATION – 您的专属“全包式”交易策略
我们为您推出PUMPING STATION —— 一款革命性的外汇指标,它将使您的交易变得更加有趣且高效。这不仅仅是一个辅助工具,而是一套完整的交易系统,具备强大的算法,帮助您开始更加稳定的交易。 购买本产品,您将免费获得: 专属设置文件:用于自动配置,实现最大化性能。 逐步视频教程:学习如何使用PUMPING STATION策略进行交易。 Pumping Utility:专为PUMPING STATION打造的半自动交易机器人,让交易变得更加方便和简单。 购买后请立即联系我,我将为您提供所有额外资源的访问权限。 PUMPING STATION如何工作: 趋势监控:能够即时识别市场趋势方向。趋势是您最好的朋友。 进场信号:图表上的箭头会提示您何时进场以及交易方向。 明确的交易目标:指标会自动识别最佳的平仓时机。 回调交易:内置的基于布林带的价格通道可检测修正结束并发出新趋势开始的信号。 效率分析:如果当前设置效果较差,系统会自动提示。只需调整PUMPING STATION,即可获得最佳性能。 功能强大: 推送和邮件通知:即
Our modernised version of the popular Order Blocks Indicator for MT4 identifies major trend reversal and momentum exhaustion points by providing arrow signals on the chart. As a result, traders can identify bullish and bearish price reversal zones and BUY and SELL accordingly. Moreover, the indicator provides Buy and Sell Arrow signals.
An order block is a market structure that is defined as the last bearish candle before a bullish price move and vice versa. These order blocks act as support a
FREE
Engulfing Candle Signal Alert: Elevate Your Trading Strategy Unlock the full potential of your trading with the Engulfing Candle Signal Alert, the ultimate tool for identifying market reversals and enhancing your trading precision. Designed specifically for traders who value accuracy and timely alerts, this powerful indicator detects engulfing candle patterns, a key signal in technical analysis that often indicates a potential shift in market direction. What is an Engulfing Candle? An engu
FREE
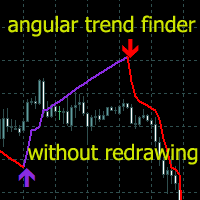
趋势指标是用于金融市场交易的技术分析领域之一。
Angular Trend Lines - 全面确定趋势方向并产生入场信号。除了平滑蜡烛的平均方向
它还利用趋势线的倾斜角度。构建江恩角度的原理被当作倾斜角度的基础。
技术分析指标结合了烛台平滑和图表几何。
趋势线和箭头有两种类型:红线和箭头表示看涨方向。紫线和箭头表示看跌方向。
指示器功能
该指标使用简单、参数配置方便,可用于趋势分析和接收开仓信号。
指示器不会重新绘制,箭头出现在蜡烛的收盘处。
当信号发生时提供多种类型的警报。
可用于任何金融工具(外汇、加密货币、金属、股票、指数)。
该指标可以在任何时间范围和图表上发挥作用。
该指标采用轻量级算法,不加载处理器,确保在多个窗口中使用。
根据时间范围和交易方法选择参数。
主要输入参数
Period - 用于分析计算的蜡烛数量。
Angle ——趋势线的斜率。
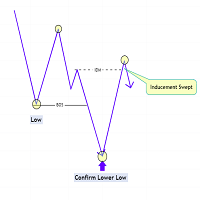
The Market Structure with Inducements & Sweeps indicator is a unique take on Smart Money Concepts related market structure labels that aims to give traders a more precise interpretation considering various factors.
Compared to traditional market structure scripts that include Change of Character (CHoCH) & Break of Structures (BOS) -- this script also includes the detection of Inducements (IDM) & Sweeps which are major components of determining other structures labeled on the chart.
SMC & pri

BBRSI Quantum (免费版) BBRSI Quantum 是一款功能强大、 100% 不重绘 (Non-Repainting) 的 MT4 指标,它基于先进的动量策略生成清晰的买入和卖出箭头。该工具专为希望在超买或超卖期间识别精确入场点的交易者而设计。 这是功能齐全的 免费 版本。 核心策略:RSI 上的布林带 与标准指标不同,BBRSI Quantum 不将布林带应用于价格。相反,它将它们直接应用于 RSI 振荡器 。 这种独特的组合有助于过滤市场噪音,并精确定位真实动量耗尽的时刻。 买入信号 (Buy Signal): 当 RSI 线首次从布林带下轨 外部 向上穿越, 并且 RSI 值同时 低于 用户定义的 BuyLevel (例如 35)时,将生成一个买入箭头。这确认了资产正在脱离超卖状态。 卖出信号 (Sell Signal): 当 RSI 线首次从布林带上轨 外部 向下穿越, 并且 RSI 值同时 高于 用户定义的 SellLevel (例如 65)时,将生成一个卖出箭头。这确认了资产正在脱离超买状态。 核心功能 100% 不重绘: 信号 仅 在K线收盘时确
FREE

KT Trend Trading Suite 是一款多功能指标,它结合了趋势跟随策略和多个突破点作为入场信号。
当新趋势形成后,该指标会提供多个入场机会,让交易者能够顺势而为。为了避免不重要的入场点,还引入了回调阈值的概念。
MT5版本可在此处获取 https://www.mql5.com/en/market/product/46270
功能特点
将多种市场动态纳入一个公式中,以清晰展现市场趋势。 绘制矩形框标记入场信号,并配合局部高点和低点进行定位。 指标会自动评估自身信号的准确性,并提供多个简明的性能指标。 内置多周期仪表盘,扫描所有可用时间周期,并显示每个周期内的趋势方向。
输入参数
History Bars: 用于分析历史信号的K线数量。 Signals Period: 整数值,决定入场信号的强度。 Pullback Depth: 整数值,决定趋势继续前常见的回调深度。 Trend Period: 整数值,用于判断主要趋势方向。 Show MTF Dashboard: 显示/隐藏多周期扫描仪表盘。 Performance Analysis:

ACB Breakout Arrows 指标通过识别一种特殊的突破形态,为交易者提供关键的入场信号。该指标持续扫描图表中某一方向上趋于稳定的动能,并在主要行情启动之前给出准确的进场信号。
点击此处获取多品种、多周期扫描仪 - ACB Breakout Arrows MT4 专用扫描仪
主要功能 指标自动提供止损和止盈位置。 配备 MTF 多周期扫描仪面板,可跟踪所有时间周期的突破信号。 适用于日内交易者、波段交易者和剥头皮交易者。 采用优化算法,提高信号准确性。 提供特殊目标线,用于设置快速平仓点或无损平移位(Quick Profit Line)。 包括胜率、成功率、平均收益等表现分析指标。 不重绘,信号一旦出现即保持不变。
交易确认 - 建议结合使用 ACB Trade Filter 指标 以过滤低质量信号。 强买入: 上箭头 + 绿色柱状图 + 多头趋势。 强卖出: 下箭头 + 红色柱状图 + 空头趋势。 避免交易 :当柱状图为灰色且趋势为震荡时。
(可选) - 建议使用 KT 支撑与阻力位指标 来避免在关键支撑/阻力区域附近开仓。此类交易可能迅速转为亏损,造成不必
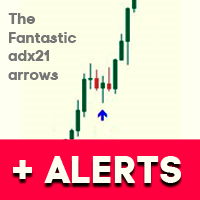
.See screenshots of the indicator. Uses information about the current trend. It is based on the classic ADX indicator. Gives a signal to enter a trade using a non-standard strategy.
Settings: Name Description Period of ADX The period of the classic ADX indicator Distance between +D & -D lines Distance between + D and -D lines . Determines the strength of the trend. Freshness of the signal (bars) Checking the freshness of a buy or sell signal.
Selects the very first signal in the span.
The numbe
FREE

AMD 自适应移动平均线 (AAMA)
AAMA 是一款适用于 MetaTrader 4 的自适应移动平均指标,可根据市场状况自动调整其反应速度。 主要功能: 基于 Kaufman 效率比的自适应移动平均线——在趋势行情中快速反应,在震荡行情中过滤噪音 自动识别四个 AMD 市场阶段:积累期 (Accumulation)、上涨期 (Markup)、分配期 (Distribution)、下跌期 (Markdown) 通过 ATR 实现波动性自适应——根据当前市场状况调整灵敏度 实时信息面板显示检测到的市场阶段、置信度和适应速度 多指标集成:结合 ADX、RSI 和 MACD 精确识别市场阶段 快速/缓慢参考区域,用于可视化自适应行为 使用方法:
指标会根据市场自动调整适应速度——在强趋势时反应更快,在盘整阶段更慢。可视化面板帮助理解当前的市场阶段。所有参数(周期、颜色、灵敏度)都可根据您的交易风格自由设置。

SR PrevPeriods MT4 概述
SR PrevPeriods 可在 MetaTrader 4 图表上实时显示前一天、前一周和前一月的最高价与最低价。它是一个轻量级指标,专为标记历史支撑与阻力区域而设计,这些区域往往与价格反应区、突破位置及价格回补区重合。 功能说明
在关键的前期价格水平绘制水平线,并可选显示带有精确数值的文字标签。水平线会在每个新报价时自动更新,并通过内部的图表对象管理保持整洁有序。 为什么有用
前一天、前一周和前一月的价格水平是许多主观交易员和系统交易员关注的重要参考。了解这些水平能提升交易判断力,优化回调进场点,并确认突破,从而减少过度交易,为任何时间周期提供客观背景。 主要特性
可单独开启/关闭日、周、月价格水平显示
可选显示价格标签
支持为每个时间周期自定义颜色、线型和线宽
自动更新并安全管理图表对象
延伸至未来的水平线,方便交易过程中参考
优化结构,多个品种同时加载也不会卡顿 参数设置
显示 — 分别启用或禁用日、周、月价格水平
标签 — 显示或隐藏各组水平的价格标签
样式 — 为每个时间周期选择线条颜色、样式和粗细 使用方法
将指标添
FREE

Auto Optimized RSI: 专业市场自适应系统 大多数交易者失败的原因是:在动态的市场中使用了静态的工具。 在每个图表上都使用固定的 RSI 层级(如 70/30)是一个数学错误。如果你只是在寻找没有逻辑 support 的“神奇箭头”,那么这个指标并不适合你。 本工具专为那些明白“优化是交易生存唯一关键”的专业人士设计。 普通指标不考虑你交易的具体品种或时间周期。 Auto Optimized RSI 则完全不同。它通过对历史数据进行内部仿真模拟,找出近期价格真实发生反转的精确水平。它不靠猜测,而是依靠计算。 技术优势: 自适应逻辑: 根据当前市场波动自动重新计算买入/卖出区域。 数学验证: 直接在图表上显示实时表现指标(胜率 Win Rate、回撤 Drawdown、盈亏比)。在交易前,你就能看到数据证明。 信号过滤: 与那些会“重绘”的虚假指标不同,本算法通过交叉优化阈值,旨在捕捉高概率的反转机会。 简洁专业: 界面清晰,拒绝杂乱。只提供精准的信号箭头和决策所需的核心数据。 专业交易者福利: 购买后请联系我,即可获得基于此逻辑的 赠品自动化交易机器人 (EA)
MetaTrader市场是 出售自动交易和技术指标的最好地方。
您只需要以一个有吸引力的设计和良好的描述为MetaTrader平台开发应用程序。我们将为您解释如何在市场发布您的产品将它提供给数以百万计的MetaTrader用户。
您错过了交易机会:
- 免费交易应用程序
- 8,000+信号可供复制
- 探索金融市场的经济新闻
注册
登录