适用于MetaTrader 4的技术指标 - 145

ICT Killzone Indicator – Master the Market’s Key Trading Sessions Unlock the true potential of Institutional Order Flow with the ICT Killzone Indicator , designed for serious traders who follow Inner Circle Trader (ICT) concepts. This tool highlights the most critical trading periods—the Asia, London, and New York Killzones —allowing you to align your trades with high-probability setups used by smart money traders. Key Features: Automated Killzone Markings – The indicator dynamically plots th

Arrow Indicator for Fast Scalping
Determines the direction of movement on almost every candle.
Allows timely opening of positions in accordance with changing market conditions.
Works on all timeframes, all currency pairs, metals, indices, and cryptocurrencies.
Can be used when trading binary options.
Key Features: No settings required; Accurately determines the direction of movement; Does not repaint after the candle closes; Works on all timeframes and all trading instruments; Suitable for
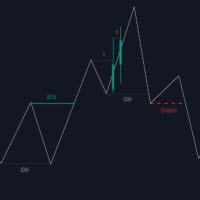
The Market Structure with Inducements & Sweeps indicator is a unique take on Smart Money Concepts related market structure labels that aims to give traders a more precise interpretation considering various factors.
Compared to traditional market structure scripts that include Change of Character (CHoCH) & Break of Structures (BOS) -- this script also includes the detection of Inducements (IDM) & Sweeps which are major components of determining other structures labeled on the chart.
SMC & pri

TW Trend Scalper Indicator:
TW Scalper Shoot 为您提供独特的交易体验,利用最新的交易策略和人工智能技术。该产品满足剥头皮交易者的多样化需求,提供两种不同类别的信号:
今天就测试这个卓越的产品,开始您成为趋势剥头皮交易者的独特体验。
信号类别:
1. 长期和安全信号:这些信号使用价格行为策略(聪明资金规则)、斐波那契水平、支撑和阻力水平以及移动平均线进行识别。该类别中的信号用红色和蓝色箭头及特定目标显示,非常适合寻求长期和可靠交易的交易者。
2. 剥头皮信号(适合专业剥头皮交易者):除了上述策略外,这些信号还利用独特的 Trade Wizards 指标公式和人工智能降噪方法。剥头皮信号以白色箭头添加到第一类信号中,适合外汇剥头皮交易者。
剥头皮指标的独特功能:
1. 信号不变色:信号、SL 和 TP 完全不变且具有高准确性。
2. 精确检测变化趋势:使用两步过滤器高精度识别变化趋势。
3. 视觉和音频警报:警报以闪烁形式显示在图表上,并在图表旁的窗口中显示入场、TP 和 SL 的价格数字。
4. 三个利润目标区域:为了管理

*Antabod GameChanger Indicator – Transform Your Trading!*
Are you tired of chasing trends too late or second-guessing your trades? The *Antabod GameChanger Indicator* is here to *revolutionize your trading strategy* and give you the edge you need in the markets! Why Choose GameChanger?
*Accurate Trend Detection* – GameChanger identifies trend reversals with *pinpoint accuracy*, ensuring you enter and exit trades at the optimal time.
*Clear Buy & Sell Signals* – No more guesswork! T
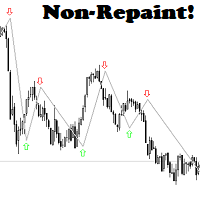
Scalper like a PRO! Trade like a PRO! Easy to use! Your profit and consistency is here! All TF and all Pairs! Just place it on the chart, select the chart and active time of your choice and follow the signals! Trade with comfort – the indicator does the analysis and you only open the order in the direction in which the indicator shows you!
finally start taking money from the market!

Belladonna is an advanced custom technical indicator for MetaTrader 4 based on Hull Moving Average (HMA). It visualizes the trend direction using colored lines and arrows on the chart. The indicator is optimized to minimize lag and eliminate market noise, making it especially useful for short-term and medium-term trading.
Functions and Features: Moving Average Type: Hull Moving Average (based on two EMA/SMA lines).
Calculation Methods: Support for different types of moving average (SMA, EMA,

The Hodrick-Prescott filter is a well known filtering algorithm Perfect for offline jobs it lacks realtime capabilities that are necessary in trading This is a first time a causal Hodrick-Prescott filter has been made
I was able to successfully make a causal (realtime) version of the Hodrick-Prescott algorithm which keeps the lag to a minimum as you can see on the screenshots, it is really responsive to sharp changes while retaining a high smoothing ability, making it one of the best smoothers
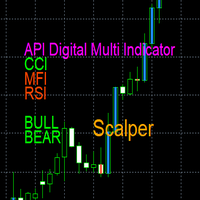
API Digital Multi Indicator Scalper – Clear Digital Display API Digital Multi Indicator Scalper , a tool that integrates RSI, MFI, CCI, Bulls and Bears into a digital display for market analysis . This indicator is designed for scalpers and short-term traders who demand clear data . Key Features: Digital Display – Monitor RSI, MFI, CCI, Bulls and Bears values in an easy-to-read digital format.
Color Changes – Visual cues help identify possible trend changes at a glance.
Adjustable

Trend NonLag Indicator is a professional and easy to use Forex, Crypto and CFDs trading system which is based on the best principles of trading using the Swing High and Swing Low and Price Action strategy. The indicator provides accurate BUY and SELL signals. You can trade even on the go using PUSH notifications. Probably you already heard about the Swing High and Swing Low trading methods before. Usually the Swing High/Low is a very complex thing not only for newbie traders but also for th

ORDER BLOCKS REVERSAL
Reversal Trading involves identifying points where an asset's price direction changes, capitalizing on potential profits from such shifts. Spotting reversals requires analyzing price patterns and volume indicators.
Key indicators include moving averages, RSI, and MACD, which help traders predict potential trend shifts. This indicator show us potential reversal points using ORDER BLOCKS.
While Reversal Trading offers potentially high reward opportunities by entering earl

Indicador de Fibonacci Semanal para MT4 Maximize suas operações no mercado financeiro com o Indicador de Fibonacci Semanal para MetaTrader 4 (MT4) , a ferramenta essencial para traders que buscam identificar pontos estratégicos de suporte e resistência com base na ação do preço da última semana. Principais Recursos: Atualização Automática : O indicador recalcula os níveis de Fibonacci automaticamente a cada novo candle semanal. Níveis Personalizados : Traça apenas os níveis essenciais de Fibonac
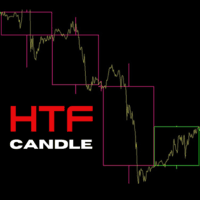
ICT Traders! Here's another cool Indicator that will allow to trade the HTF narrative while focus on price action on your entry timeframes. The following are the input for setup the indicator: Maximum Bar: The number of HTF bar you want to display Bullish Candle: The color of the bullish candle Bearish Candle: The color of the bearish candle Border Width: the width of the HTF candle drawn on the chart.

SuperTrend Starter - Yes Trading (over 100 Downloads in 10 days)
The SuperTrend Starter - Yes Trading indicator is a powerful, user-friendly tool designed to simplify market trend detection and provide clear trading signals. By combining the Commodity Channel Index (CCI) with a Moving Average (MA) filter, this indicator helps traders make informed decisions with precision and confidence. Key Features & Benefits Trend Detection: Easily identifies uptrends (price above the SuperTrend) and dow
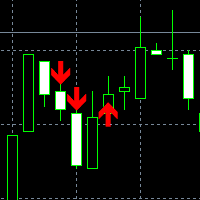
This is Binary option indicator mt4 for one candle expiry, also can be used for forex Higher Timeframes like H4,D1,W1, it is very accurate no lags no repaints, before you purchase you can ask me any question you may recon with feel free to contact me, Indicator Buffers are 0 for buy and 1 for sell, it Draws arows immidiate;
Alerts has been included; Push Notification has been included;
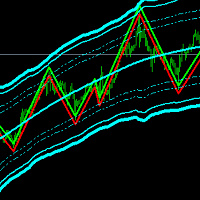
Channel Trend Bands – A Comprehensive Indicator for Market Analysis MetaTrader 5 Version
Simple to Use, Effective in Application User-Friendly and Suitable for All Traders This indicator stands out due to its straightforward functionality. Whether you're a beginner exploring the market or an experienced trader refining your strategy, this tool offers valuable insights. Using a Triangular Moving Average (TMA) with additional ATR-based bands , it provides structured market data to support well-i
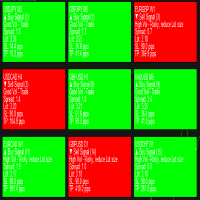
Introducing Telos Dashboard Indicator – Your Ultimate Trading Companion Optimized For Forex!
Note: This is a dashboard indicator and won't work on the strategy tester, demoing it there is a waste. Instead get the main indicator or, use the demo of DynamicCOG to see how it works with arrows, although Telos is a more refined and filtered version than the DynamicCOG indicator. Never Miss a Trading Opportunity Again!
Welcome to the future of trading with the Telos Dashboard Indicator ! Inspired b

“Auto FIBO Pro” Crypto_Forex 指标 - 是交易中的绝佳辅助工具!
- 指标自动计算并放置在图表斐波那契水平和局部趋势线(红色)上。 - 斐波那契水平指示价格可能反转的关键区域。 - 最重要的水平是 23.6%、38.2%、50% 和 61.8%。 - 您可以将其用于反转剥头皮或区域网格交易。 - 还有很多机会可以使用 Auto FIBO Pro 指标来改进您当前的系统。 - 它具有信息价差掉期显示 - 它显示所连接的外汇对的当前价差和掉期。 - 显示屏还显示账户余额、净值和保证金。 - 可以将信息价差掉期显示定位在图表的任何角落: 0 - 左上角,1 - 右上角,2 - 左下角,3 - 右下角。
点击这里查看高质量的交易机器人和指标! 这是仅在此 MQL5 网站上提供的原创产品。

MamchenkoTrend Complex - высокоточный индикатор, показывающий смену тенденций на рынке. Индикатор не перерисовывает сигнал после закрытия свечи. Дает вам уровень стопа для вашей сделки по его сигналам. Отлично подходит для ручной торговли и в разработке в АТС (автоматические торговые системы) Настройки можно использовать по умолчанию , а также подбирать самостоятельно . На скриншотах изображен один и тот же участок графика пары GBPUSD на тайме Н4 но с разными настройками . На первом рисунке зн

Quantum Entry is a powerful price action trading system built on one of the most popular and widely known strategies among traders: the Breakout Strategy! This indicator produces crystal clear buy and sell signals based on breakouts of key support and resistance zones. Unlike typical breakout indicators, it uses advanced calculations to accurately confirm the breakout! When a breakout occurs, you receive instant alerts. No lag and no repaint : All signals are delivered in real-time, with no lag

Overview: The Candle Pattern Weekly RSI is a powerful MT4 indicator designed to detect high-probability trade setups on the 1h -timeframe chart while aligning with the weekly trend . It filters signals using a unique three-candle pattern and other Pri ce actions , a minimum price move from the weekly open , and RSI confirmation to enhance accuracy and reduce false signals. Key Features: Weekly Trend Confirmation: Only takes buy trades when the Weekly candle is bullish and sell trades when i

基於江恩理論手動建構修正區域的指標。這些區域是透過數學計算確定的,使用從 M1 開始到 D1 結束的不同時間範圍的特殊係數。此指標適用於貨幣對和金屬,以及加密貨幣甚至股票
利用該指標,您可以根據市場週期輕鬆建立購買/銷售支援區域,並在接近這些區域時做出交易決策。
這將使您了解從買入/賣出支撐區域的價格變動方向。
另外,借助該指標,您可以確定上升/下降週期的中斷並確定切入點。
適合剝頭皮交易、短期交易和中期交易。這完全取決於您的交易風格。
非常容易使用。僅使用四個鍵即可建造區域。
區域是根據圖表上突出的高點/低點手動建立的
若要建立購買支撐區域,您需要將滑鼠遊標放在明確定義的高點上,然後按「2」鍵。 在圖表上安裝兩個指標副本,使用當前時間範圍的設定和下面時間範圍的設定來比較價格走勢,因為 m1 上可能有一個上升週期,而 m5 上可能有一個下降週期,反之亦然
若要建立銷售支撐區域,您需要將滑鼠遊標放在明確定義的低點上,然後按「1」鍵。
為了確定潛在的目標區域,使用鍵“3” - 從低到高表示目標購買區域,使用鍵“4” - 從高到高表示目標銷售區域。
您所需要的只是一個乾

VWAP (Value Weighted Average Price) is an indicator of market makers and banks. It is used by professional traders for intraday, weekly and long-term trading. If you are not familiar with it yet, it is high time to figure it out. How does VWAP work? VWAP shows the volume-weighted average price over a certain period. Its calculation takes into account both the price change and the volume of transactions in each candle. Candles with a higher volume have a greater impact, which increases the ac
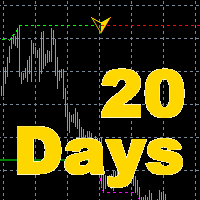
The indicator is the main part of Michael Huddleston's ICT (Inner Circle Trader) trading strategy. His legendary trading strategy is based on the concept of "Smart Money". To analyze the medium -term trend , the ICT offers an analysis based on twenty -day levels . The indicator builds levels , while showing the turning points with arrows . An important feature of the indicator is the automatic display of levels for different periods . You do not have to change the indicator settings when chang

Smart Key Levels Indicator for MT4 - Advanced Support & Resistance Tool The Smart Key Levels Indicator is a professional-grade tool for traders seeking precise support and resistance levels. Using advanced algorithms, it identifies key price levels with dynamic strength scoring, volume filtering, and higher timeframe confluence. Perfect for all trading styles and timeframes, this indicator provides clear visual signals with customizable settings. Available for both MT4 and MT5 platforms. Unl

This is a mini One pair version of Advanced Detector of Trend Reversal and Continuance known as TrueTrendStarM(TTSm25). It is a sensitive and Predictive indicator of Price Trends for Professional traders. ( ATTENTION BUYERS:-Now the indicator is available for UNLIMITED TIME ONE TIME buy of just $500 ). Avail the Opportunity. It detects high odds changes in Price Trend direction long before other indicator detects it. I have been working on it since 2019. This is possible due to fractal

Smart Set up leve l is a very powerful indicator based on the concept of order blocks and set up entries with proper fvg and breakouts to make a very nice level to enter like a pro trader. Very easy to use interface and friendly to enter on buy and sell signals. Works Best on M15 Time frame on Gold, Bitcoin and Fx pairs. Daily 4-5 trades on each pair Works great on gold like a pro on M15 It is non repainting nor lagging It is very powerful indicator giving precise entries and prop acts can be c

“Binary Smart Eye”MT4指标旨在为二元期权和外汇市场提供交易信号,可在M1至W1的广泛时间范围内运行。它采用一种专有策略,结合了趋势水平、智能移动平均线和优化的交易周期,以识别潜在的入场点。 以下是其主要功能的详细介绍: 多时间框架分析: 该指标的多功能性允许交易者在各种时间框架上使用它,满足不同的交易风格,从M1上的剥头皮交易到W1上的长期趋势跟踪。 专有策略: “Binary Smart Eye”的核心在于其独特的策略,该策略利用: 趋势水平: 这些水平有助于识别当前的市场趋势和潜在的反转点。 智能移动平均线: 一种定制的移动平均线,可适应市场波动并提供准确的趋势方向。 智能交易周期: 该指标根据特定的时间周期优化其信号生成,旨在捕捉最佳市场条件。 信号和警报系统: 当指标的参数一致时,它会生成清晰的视觉信号和声音警报,提示交易者发起交易。 二元期权和外汇兼容性: 该指标的设计使其适用于二元期权交易(精确的入场时机至关重要)和外汇交易(强调趋势跟踪和利润目标)。 马丁格尔策略考虑: 描述中提到了在不利市场条件下使用马丁格尔策略的选项。重要的是要知道马丁格尔策略风险

Secret Liquidity Zones Indicator User Manual Introduction Unlock the power of hidden market opportunities with the Secret Liquidity Zones Indicator . This cutting‐edge tool is designed to reveal critical price levels where market momentum may shift. With its dynamic adaptability and sleek gold visuals, it offers clear and elegant insights into key trading opportunities—making it the perfect secret weapon for traders who demand precision and clarity. Key Features Dynamic Timeframe Adaptation:
A
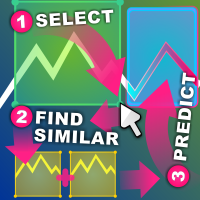
相似价格行为指标 相似价格行为将查找与您选择的图表区域尽可能相似的过去烛台图案序列。
该指标将从您选择的价格行为区域的第一个烛台之前开始搜索,直到图表的第一个最旧条。
评估两个序列之间的相似性有几个标准: 序列的长度必须相同,如果您选择的区域是 20 个烛台宽,那么任何匹配的结果也必须是 20 个烛台宽。您可以选择任意数量的蜡烛。 将根据序列的高低大小进行视觉比较 将根据序列的开盘价和收盘价大小和方向进行视觉比较。如果蜡烛图对一个序列来说是看涨的,而对另一个序列来说是看跌的,则得分设置为 0.0 序列有一组快速和慢速移动平均线,它们根据其增量进行比较。增量可以在该区域内相对比较,也可以在整个资产范围内绝对比较(相对和绝对模式) 序列有一组快速和慢速 ATR,用于比较其波动性。同样,比较可以是相对的,也可以是绝对的。 序列有一组快速和慢速 RSI,用于比较其局部强度。 以上所有内容混合在一起以获得最终评级,其中每个组件都由一个系数加权。指标的输入中提供了系数和比较方法。 指标的搜索引擎 simipac 将扫描过去所有可能的蜡烛图序列,而不会破坏蜡烛的顺序。
这些序列中的最佳序列将
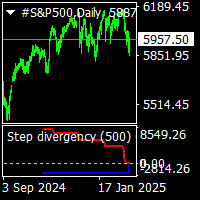
step divergency indicator is a buy sell divergency indicator.include sinus wave indicator. it work all timeframes and all pairs. red line gives step divergency sell formations. blue line gives step divergency buy formations. suitable for experienced and beginners. when prices is moving up and red lines step down ..this is sell divergecy formation and if prices moving down but blue line moving step up this is buy divergency formation. increased cnt value show more back side. gold line is sinus w

跟随趋势是一种视觉指标,它将根据 RSI 算法为蜡烛着色,并为您提供推荐的 FVG 切入点和推荐的止损点。 不重绘!
确认箭头将出现在第一个新形成的公允价值缺口上!
最佳使用:
5 分钟或更长的时间范围!
趋势面板:
FVG:最后一个公允价值缺口。 跨度:在 Ichimoku 云的上方、下方或内部。 Rsi:RSI 算法部分 您可以轻松抓取和移动图表上的面板!通过查看面板,您可以轻松指出该对的趋势! 策略:
1. 可能的多头交易:
当出现新的绿色箭头时。将您的止损位置于公允价值缺口下方! 在 tp 或形成新的看跌公允价值缺口时退出交易。 2. 可能的空头交易:
当出现新的红色箭头时。将您的止损位置于公允价值缺口上方! 获利回吐或形成新的看涨公允价值缺口时退出交易。 警报:
创建新的公允价值缺口 所有公允价值缺口 打破的公允价值缺口 根据您的偏好!
https://www.mql5.com/en/users/gabedk/seller

同步十字光标 & 极值线指标 简单解释(适合所有交易者) 该指标可以让你在 多个相同品种的图表上同步十字光标 ,帮助你同时跟踪不同时间周期的价格走势。 主要功能: 同步十字光标 :在一个图表上移动光标,其他相同品种的图表也会自动更新。
快捷键操作: "F" – 显示/隐藏十字光标。 "R" – 添加或删除极值线(最高价/最低价)。 "T" – 在选定的K线位置添加或删除垂直线。
完全可自定义 :你可以调整颜色、线条样式和宽度,以适应你的交易风格。 这个工具适用于 多周期分析 ,让你无需手动对齐光标,即可快速对比市场走势。 高级解释(适合专业交易者和开发者) 同步十字光标 & 极值线指标 是一款 多图表同步工具 ,专为技术分析交易者设计,帮助他们精确跟踪价格水平,并在多个时间周期中同步关键点位。 核心功能: 同步十字光标: 在当前图表上 绘制垂直和水平十字光标 。 当光标移动时, 所有相同品种的图表都会实时更新 。 快捷键 "F" 可开关光标显示。 极值线(最高/最低价标记): 按 "R" 键可在选中的K线上 绘制最高价或最低价的极值线 。 极值线包括两条线

• Please test the product in the Strategy Tester before purchasing to understand how it works.
• If you face any issues, contact me via private message—I’m always available to help.
• After purchase, send me a screenshot of your order to receive a FREE EA as a gift.
Aroon Cross Signal Indicator - Trading Companion V1.21 Important Note: This indicator is provided as a raw trading tool designed for traders who enjoy customization and optimization. It is NOT a plug-and-play solution and requi

No Repaint Bext 是一个完整的交易系统。它指示何时开仓、何时平仓以及交易方向。每当出现绿色箭头时,您需要开设买入交易。当出现红色箭头时,关闭所有买入交易。相反,每当出现红色箭头时,开设卖出交易,并在出现绿色箭头时关闭所有卖出交易。交易时使用 M5 时间框架,可以在任何货币对上进行交易。 该指标不会重绘,几乎没有延迟,唯一的自然条件是等待 K 线收盘。它使用 RSI 过滤器和两个经典的反转形态(吞没、Pin Bar),这使得几乎可以在反转发生的瞬间识别出来。 如何使用该指标进行高效交易? 可用于任何货币对(我们测试了 GBPUSD 和 EURUSD) 时间框架:M5 初始资金:500 美元起 交易手数:0.01 每当出现绿色箭头时,开设买入交易。当出现红色箭头时,关闭所有买入交易。 每当出现红色箭头时,开设卖出交易。当出现绿色箭头时,关闭所有卖出交易。 指标参数设置: RSI_Period - 默认值:14
说明:RSI(相对强弱指数)用于过滤信号。例如,当 RSI_Period 设为 14 时,RSI 计算过去 14 根 K 线的平均值。周期越长,RSI 趋势越平滑(减少
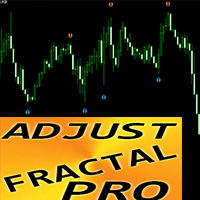
“可调分形 Pro” - 是分形指标的高级版本,非常有用的交易工具! .......................................................................................... - 众所周知,标准分形 mt4 指标根本没有设置 - 这对交易者来说非常不方便。 - 可调分形 Pro 已解决该问题 - 它具有所有必要的设置: - 指标的可调周期(建议值 - 高于 7)。 - 价格高点/低点的可调距离。 - 分形箭头的可调设计。 - 它具有信息价差掉期显示 - 它显示所附外汇对的当前价差和掉期。 - 显示屏还显示账户余额、净值和保证金。 - 可以将信息价差掉期显示定位在图表的任何角落: 0 - 左上角,1 - 右上角,2 - 左下角,3 - 右下角。 - 指标内置移动和 PC 警报。 点击这里查看高质量的交易机器人和指标! 这是仅在此 MQL5 网站上提供的原创产品。

A powerful indicator for precise market analysis, according to the Smart Money Concepts methodology. Determines key liquidity levels, supply and demand zones. Unusual coloring of candles, as well as levels. Smartmoney has repeatedly won first places in various competitions. Multi-timeframe is suitable for both forex pairs and metals and cryptocurrency.
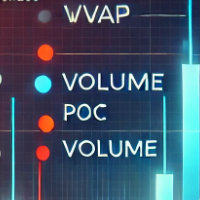
The "Volume POC WVAP" Indicator is a revolutionary tool for traders seeking in-depth analysis across various financial markets. This unique indicator, based on tick volumes in the MT4 terminal, provides indispensable information for making informed trading decisions in the following markets: Forex, binary options, cryptocurrency, spot, futures, and indices. Key Features: WVAP Line: Weighted Volume Average Price: The WVAP calculates the weighted volume average price on the selected timeframe, all

Multi-Timeframe Support & Resistance Indicator for MT4.
Professional Tool for Technical Traders.
Key Advantages Multi-Timeframe Analysis - View critical levels from different timeframes simultaneously Real-Time Alerts - Instant notifications when key levels change Customizable Display - Adjust colors, line styles, and timeframes to match your strategy User-Friendly - Easy setup with clear visual labels for all levels
Core Features Multi-Chart Integration : Track S/R from up to 4 t
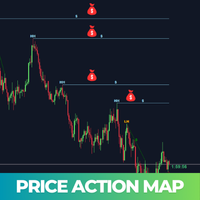
Price Action Map is an advanced trading indicator meticulously designed to provide clear visual insights into market structure by precisely labeling Higher Highs (HH) , Higher Lows (HL) , Lower Highs (LH) , and Lower Lows (LL) . Traders who find it challenging to accurately identify higher highs, lower lows, or understand different market phases will find this tool exceptionally valuable. Price Action Map significantly simplifies the analysis process, enabling traders at all skill levels to con

Last High and Low Indicator
Features
Dynamic High/Low Lines : Automatically plots horizontal lines showing the highest high and lowest low over a selected number of past bars. Customizable Lookback Period : Adjust how many bars the indicator analyzes to find highs/lows. Visual Customization : Choose line colors (red for high, blue for low). Adjust line style (dashed, solid, etc.) and thickness. Price Labels : Displays the exact price and bar count for clarity (e.g., "High (10 bars): 1.1200").
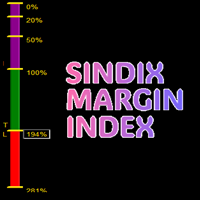
this indicator will help you see the following :
first , price levels that shows : 1. breakeven level for all open positions ( BEA shown in blue line ) 2. breakeven level for all open buy positions ( BEB shown in green line ) 3. breakeven level for all open sell positions ( BES shown in red line ) 4. draw a line at Margin level 100% ( violet color line ) 5. draw a line at Margin call level ( violet color line ) 6. draw a line at StopOut ( violet color line )
second , to the left : 1. it will s

General Information This indicator for MetaTrader 4 is a tool designed to generate buy and sell signals based on a combination of a stochastic oscillator and a moving average. Signals are displayed on the chart as arrows: green for buy signals and red for sell signals. It is built to provide a higher number of trading opportunities while considering market conditions.
How It Works The indicator processes market data using two components: the stochastic oscillator assesses the current market st
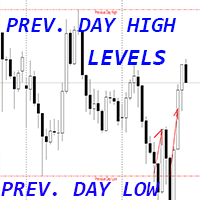
Crypto_Forex 指标“前一天最高最低水平”适用于 MT4。 .......................................................................................... - 指标“前一天最高最低水平”是非常有用的辅助指标。 - 昨日最高和最低水平非常重要,因为价格经常从它们反弹。 - 这些水平可以被视为可靠的支撑和阻力 - 价格非常尊重它们。 - 对于使用反转交易方法和剥头皮的日内交易者来说,这是一个有用的指标。 - 也非常适合与价格行动相结合。 - 具有内置移动和 PC 警报。 点击这里查看高质量的交易机器人和指标! 这是仅在此 MQL5 网站上提供的原创产品。

该指标利用 自适应波动率 、 移动平均线 和 趋势分析 等高级市场分析算法,识别可能的价格反转点。其算法基于 ATR、EMA 和 ADX ,能够动态适应当前市场条件并过滤虚假信号。 该指标适用于多种交易策略,包括 剥头皮交易、日内交易和长期趋势交易 。凭借灵活的设置,可以调整以适应不同的市场环境。 指标如何工作? 趋势方向检测: **EMA(指数移动平均线)**用于过滤顺应市场趋势的信号。 **ADX(平均方向指数)**分析趋势强度,过滤震荡市场。 波动率分析: ATR(平均真实范围)用于根据市场活动调整入场水平。 动态调整入场水平,在高波动期间减少虚假信号。 信号生成: 如果价格通过 EMA 和 ADX 确认趋势,指标将识别入场点。 **买入信号:**价格必须高于 EMA,且 ADX 确认上升趋势。 **卖出信号:**价格必须低于 EMA,且 ADX 确认下降趋势。 当满足条件时,图表上会绘制箭头。 推荐使用方式 推荐货币对: EUR/USD, GBP/USD, USD/JPY, AUD/USD, XAU/USD。 最佳时间周期: M15、M30、H1、H4。 最佳交易时段: 伦敦和
解锁机构级交易策略,使用我们的先进供需区指标! 利用我们的 供需区指标 ,掌握机构交易策略,精准识别金融市场中的 高胜率买卖点 !通过定位机构资金的买入和卖出区域,该指标让您能与市场大玩家同步交易,把握重大趋势反转,提升盈利机会! 为什么这款指标是专业交易者的必备工具? 无限历史区域扫描 – 自动检测并可视化关键的供需区,无需手动分析,适用于任何时间周期和资产。 精准锁定高盈利区域 – 该指标能清晰标记市场供需区,帮助您预测市场反转和突破,提高交易成功率。 自动扫描K线 – 实时信号提示潜在的入场点,让交易决策更加智能化。 清晰的颜色编码区域 :
粉色区域(供应区) – 突破后变成需求区,但颜色保持不变。 天蓝色区域(需求区) – 突破后变成供应区,颜色仍保持不变。 自动识别关键交易模式 :
Drop-Base-Drop(DBD) & Rally-Base-Drop(RBD) – 供应区。 Drop-Base-Rally(DBR) & Rally-Base-Rally(RBR) – 需求区。 掌握机构交易者的优势 大多数散户交易者亏损的原因是他们无法看到“聪明资金”(Smart Mon

这是一个双均线指标,使用历史数据,通过较为严格且大众化的计算公式,计算得出主要均线的数值,然后再将其均线化,从而最大可能的避免了在走势不确定的情况下,均线发出错误的交易信号。最重要的是,可以结合您自己的交易专家,实现最大化的交易利润。 手工交易参与者也可以使用本指标,结合MACD 等其他指标也可获得比较高的准确率
建议使用默认参数。本指标适合各种周期,交易品种适合黄金、比特币等波动较大的交易品种。目前我并未设置可以改变交易指标的颜色、线的大小的选项,我认为此这些都是不重要的,重要的指标的准确率以及帮助交易者能够更改好的获取利润。如果有认为需要改变颜色或者线大小的选项?可以私信我,我单独为您定制你需要的设置。

"Smart Panel" is a powerful tool for traders and analysts that combines convenience, speed, and functionality. The program allows you to instantly add popular indicators such as Moving Average and Bollinger Bands to your chart, as well as provides access to open order data and market information with just one click. Key Features: Instant Indicator Addition :
Click a single button to add Moving Average or Bollinger Bands to your chart. No more manual parameter setup—the program does it

Smart Market Structure Simple is a powerful indicator that helps traders identify market structure based on the Smart Money Concept (SMC) . This indicator automatically detects Break of Structure (BOS), Change of Character (CHoCH), Fair Value Gaps (FVG), Order Blocks (OB), Liquidity Zones (LQZ), and key swing points Higher High (HH), Higher Low (HL), Lower High (LH), Lower Low (LL) . Main Objective: Assist traders in tracking institutional flow ( Smart Money ) and finding high-p

Crypto_Forex 指标“价格行为过滤直方图” - 是价格行为交易的有效辅助交易工具!无需重绘。
- 该指标向交易者建议入场方向。然后交易者只需在该方向搜索价格行为信号即可。 - 价格行为过滤直方图应与价格行为模式和支撑/阻力位相结合。 - 绿色直方图 - 寻找买入入场。 - 红色直方图 - 寻找卖出入场。 - 使用此指标,有很多机会升级标准策略。 - 指标内置移动和 PC 警报。 ................................................................................................................. 点击这里查看高质量的交易机器人和指标! 这是仅在此 MQL5 网站上提供的原创产品。

GO Multi Oscillator Divergence Entry is a unique divergence indicator that is different from all other divergence indicators on the market.
After purchase, leave a review, a comment or make a screenshot of your purchase and contact me to receive for free the Trade Entry Manager utility !
The uniqueness of the indicator consists of two key elements :
unlike other divergence indicators, this indicator does not use an oscillator subwindow, thus you can search for divergence of multiple oscilla

蜡烛成交量强度是一种先进的成交量分析指标,可洞察买卖双方之间的持续竞争。它计算并可视化实时成交量变化,帮助交易者更准确地确认突破、趋势、回撤和反转。
主要特点: 基于成交量的确认—— 该指标监控成交量变化,并在市场力量在买家和卖家之间转移时发出警报。 趋势和突破验证—— 通过分析交易量分布,交易者可以确认市场趋势和突破信号的强度。 反转和回撤检测—— 成交量模式有助于识别价格走势中的潜在转折点。 支撑和阻力洞察—— 关键水平附近的成交量增加增强了对其可靠性的信心。 简单有效的可视化—— 以直方图形式显示买卖强度,以便于解释。 蜡烛图成交量强度可帮助交易者利用成交量分析确认市场走势,从而做出明智的决策。在突破期间,高交易量表明市场参与度高,从而增强了突破信号的有效性并降低了错误动作的可能性。理解趋势强度变得更容易,因为上升趋势中成交量的增加证实了持续的购买压力,而下降趋势中成交量的增加表明强劲的卖出活动,为交易者提供了对趋势延续的更大信心。此外,该指标通过识别价格变动和成交量活动之间的差异来帮助发现潜在的趋势逆转。例如,如果价格继续上涨而成交量下降,则可能表明趋势减弱并可能出现逆转。

Nice Try Super Diddy Trend – 一款创新的技术分析工具,专为寻求深入理解市场动态的经验丰富交易者而设计。该指标利用复杂的算法计算流动性流动和市场动量,识别潜在的反转点和趋势延续。 独特性与价值 Nice Try Super Diddy Trend 不仅仅是一个信号生成器,它还分析市场的隐藏结构,研究价格波动的幅度和方向,并结合时间周期进行评估。 量子波动性分析 – 确定市场波动强度,帮助过滤虚假突破。 灵活适应市场变化 – 采用基于移动平均线和 RSI 指标计算的动态阈值水平。 适用于多种交易策略 – 既可用于趋势交易,也可用于寻找局部极值点。 如何运作? Nice Try Super Diddy Trend 通过智能算法分析历史数据和当前价格动态,评估市场动量。该指标使用上升和下降标记系统,清晰地可视化市场阶段及潜在入场点。 黄色和红色线条 – 指示潜在上涨或下跌的信号水平。 箭头 – 基于市场动量分析形成的方向标记。 阈值水平 – 动态调整以适应市场结构变化。 指标参数设置 Nice Try Super Diddy Trend 提供高级参
该指标主要用于手动交易。它会分析近期价格走势,并使用其自有算法进行处理。 基于此分析,该指标计算出最重要的价格水平。这些水平将价格值划分为三个区域:买入、卖出和中性。只有当价格位于相应区域时才应开仓。如果价格位于中性区域,则应考虑平仓或将其调整至盈亏平衡点。该指标还提供自身的开仓建议。这些点在图表上以点表示。
指标设置: Indicator period – 指标周期; Type – 此参数允许您选择加权系数的类型; Sensitivity – 指标敏感度(有效值为 0-8); Color of levels 和 Line style – 允许您选择指标水平的颜色和样式; Signal settings – 指标信号设置。
使用指标。选择时间范围(我推荐 M5-D1)。设置所需的指标周期。该指标首次启动可能需要一些时间。这是因为该指标需要统计数据,这些数据是根据历史数据收集的。该指标还包含警报选项和发送消息的功能。然而,在某些情况下,该指标可能会非常频繁地发出信号——大约每分钟一次。
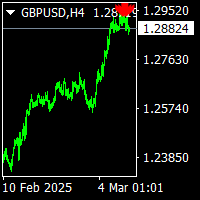
sinus arrows indicator is norepaint arrows indicator. it works all timeframes and all pairs. suitable for experienced traders and beginners. gives red arrows for sell.and gives blue arrows for buy. traders must check the all timeframes.i mean when trading 5m charts also need the check 15m charts and 1m charts. there is cnt number to see the how much bars back bars.
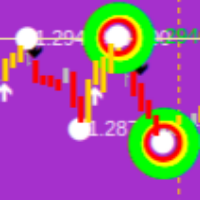
Revolutionize Your Trading with This Powerful Indicator-Based System Are you struggling to find accurate entry and exit points in trading? Do you want a proven, indicator-driven system that helps you maximize profits and minimize risks ? Introducing our Advanced Trading System —a powerful, easy-to-use technical analysis tool designed for forex, stocks, and crypto traders . Key Features & Benefits: Precision Buy & Sell Signals – Our system generates crystal-clear buy (green) and sell (red

3 Trading Strategies to Exploit Market Structure (Without Overcomplicating It)
Trading isn’t about predicting the future—it’s about spotting patterns, managing risk, and acting when odds favor you. Below are two timeless strategies (and one hybrid) that align with how markets actually move, not how we wish they would. Some of the strategies you can trade with the indicator [ Note] Higher timeframe should be 15x of the lower timeframe, for eg. htf 15min, ltf 1min. 1. The Breakout Trap: Trad

API BullBearPower mtf
Designed for traders who rely on BullBearPower, this tool provides a multi-timeframe (MTF) view of BullBearPower, helping you identify possible dominant trends.
Key Features: Multi-Timeframe Analysis – Analyze BullBearPower across different timeframes in real time. Dynamic Color Changes – Identify possible BullBearPower per individual timeframe with color changes. Volume Integration – Get a picture of possible trend strength with BullBearPower volume of each timefra

The Time_Price_SQ9_Degree indicator is based on the 9 Gann square. Using this indicator, you can identify strong time and price zones. The indicator displays the levels as a degree value. The degrees can be set in the settings. After launching, the MENU button appears. If it is highlighted, it can be moved to any point on the graph, and after double-clicking on it, it stops being highlighted and menu buttons appear. To hide the menu, just double-click on the button, it will become highlighted a
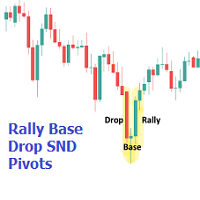
The Rally Base Drop SND Pivots indicator uses "Rally", "Base", and "Drop" Candles to determine pivot points at which supply and demand (SND) levels are drawn. (Figure 1) USAGE Figure 2 Rally, Base, and Drop (RBD) candles create a formula for seeing market structure through a fixed methodology. We are able to use this concept to point out pivot areas where Rallies and Drops directly meet.
The RBD SND Pivots are similar to traditionally identified "fractal" pivot points, with one key differ

Crypto_Forex 指标“晨星模式”适用于 MT4。
- 指标“晨星模式”是价格行为交易的非常强大的指标:无需重绘,无延迟。 - 指标检测图表上的看涨晨星模式:图表上的蓝色箭头信号(见图片)。 - 带有 PC、手机和电子邮件警报。 - 还有它的兄弟 - 看跌“黄昏之星模式”指标可用(点击以下链接)。 - 指标“晨星模式”非常适合与支撑/阻力位结合使用。 ................................................................................................................. 点击这里查看高质量的交易机器人和指标! 这是仅在此 MQL5 网站上提供的原创产品。
Forexo is an easy-to-use Forex indicator that gives traders clear and accurate signals based on clear trend retests . Forget about lagging indicators or staring at charts for hours because this Forexo indicator provides real-time entries with no lag and no repaint, so you can trade with confidence without analyzing the market. Working of indicator:
This indicator is based on price action with help of stochastic, RSI & SMA.
Setup Recommendation:
Recommended timeframes: Any timeframe works

FOREX FLIP ALERT - Show where the price will reverse with more than 95% probability. This information will help every trader to effectively open trades. The indicator on the chart draws arrows in which place and in which direction the price will reverse. The indicator does not redraw its arrows and shows price reversals for medium and long distances. This means that after the arrow appears, the price will go in the indicated direction for many points.
Benefits of the indicator: Gives sign

The ATR Trailing Stop Pro is a powerful trend-following indicator designed to help traders manage risk and maximize profits. Based on the Average True Range (ATR), this indicator dynamically adjusts stop-loss levels to lock in gains and minimize losses. Key Features : Dual ATR Trailing Stops : Combines fast and slow ATR trails for optimal performance. Dynamic Stop Loss : Automatically adjusts to market volatility. Buy/Sell Signals : Clear visual alerts for entry and exit points. Cust

The LOWESS is a sophisticated trend-following indicator designed to help traders identify, analyze, and act on market trends with precision and minimal lag. Built around the LOWESS (Locally Weighted Scatterplot Smoothing) algorithm, it filters out market noise to reveal the underlying price direction. Enhanced with dynamic visuals, volatility-based bands, momentum insights, and features like alerts and trend strength analysis, this indicator offers a comprehensive toolkit for navigating today’s

This is a true trend lines indicator for MT4/MT5.
This indicator draw real trend lines.
Usually the trend line is drawn as a solid line.
The next trend line that is likely to be valid is drawn as a dotted line.
The most recent invalidated trend line is drawn as a dashed line.
Three-touch lines is drawn as a bright colors.
If the starting point of the trend line is new, the blue line is displayed(call shortline),
if it is old, the gold line is displayed(call longline).
The number of bars border

Microsoft Word - Installation - TrendFollower-1 Trend Follower 1 This indicator consists of three key components: an upper band, a lower band, and a middle line. A buy signal is generated when the price closes above the upper band, indicating strong bullish momentum and a potential trend continuation. Conversely, a sell signal occurs when the price closes below the lower band, signaling bearish strength and a possible downward move. The middle line serves as a dynamic support or resistance leve

Microsoft Word - Installation - TrendFollower-2 Trend Follower 2 This trend-following indicator with upper and lower bands is a powerful tool for identifying market momentum and generating trade signals. This indicator consists of three lines: the upper band, lower band, and middle line. A buy signal is triggered when the price closes above the upper band, indicating strong bullish momentum and a potential continuation of the uptrend. Conversely, a sell signal is generated when the price closes

Parabolic SAR + Deviation [BigBeluga] is an enhanced Parabolic SAR indicator designed to detect trends while incorporating deviation levels and trend change markers for added depth in analyzing price movements. Key Features: > Parabolic SAR with Optimized Settings: Built on the classic Parabolic SAR, this version uses predefined default settings to enhance its ability to detect and confirm trends. Clear trend direction is indicated by smooth trend lines, allowing traders to easily visuali

Trend Risk Analyzer intelligently identifies trends, impulses, and corrections, calculating optimal trade volumes and safe levels for stop-loss and take-profit. Increase your accuracy, reduce risks, and boost your trading profits! This product is also available for MetaTrader 5 => https://www.mql5.com/en/market/product/134799 The key feature of Trend Risk Analyzer is its capability to calculate the average range of each market element, enabling traders to set justified stop-loss and take-profi
MetaTrader市场是一个简单方便的网站,在这里开发者可以出售自己的交易应用程序。
我们将帮助您发布您的产品,并向您解释如何为市场准备您的产品描述。市场上所有的应用程序都是加密保护并且只能在买家的电脑上运行。非法拷贝是不可能的。
您错过了交易机会:
- 免费交易应用程序
- 8,000+信号可供复制
- 探索金融市场的经济新闻
注册
登录