适用于MetaTrader 4的技术指标 - 20
Unlock High-Confidence Trading with Flash Signal! Tired of signals that appear too late or repaint? The Flash Signal: EMA-Stoch System indicator is engineered to deliver timely, filtered trade entries, transforming complicated market analysis into clear, actionable buy and sell arrows. Stop guessing and start trading with conviction! Key Advantages: Why You Need Flash Signal Filtered for Quality: This isn't just a simple EMA crossover. We combine the power of three Exponential Moving Averages (
FREE
Features List 1:
FVG->iFVG Order Block High Transaction Line (Personal strategy) Premium Discount 50% and 61% Previous day high low Previous week high low Candle end countdown Feature List 2 : (Implemented based on feedback from community groups) trend identification Hide FVG, Order Block, Large Transaction line below 50% equilibrium. Hide all/Individual texts/features FUTURE Feature List (Will be implemented only if at least 5 people request for it.)
Asia, London, NY lq zones (Implemented) Def
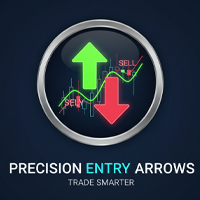
Precision Entry Arrows: Never Miss a High-Probability Trade Again! Stop guessing and start trading with confidence. The Precision Entry Arrows indicator is a sophisticated, all-in-one tool designed to deliver high-quality, non-repainting Buy and Sell signals directly on your chart. It expertly combines the power of MACD , Stochastic , and a unique EMA 5 Cross to pinpoint exact entry moments , then filters everything through a long-term EMA 200 to ensure you are always trading with the major tre
FREE

TickFlow 是一个用于分析 tick 数据并在图表上可视化重要区域的工具。该工具会聚合当前与历史的 tick 数据,显示买卖双方的力量对比,并帮助识别支撑/阻力位和簇状(cluster)区域。 这是适用于 MetaTrader 5 的版本。 工作原理(简要) TickFlow 收集 tick 数据,并按价格步长和蜡烛(柱)对其进行聚合。
基于累计的数据构建可视化层:向上/向下 tick 计数器(up/down tick counters)、买/卖比例(buy/sell ratio)、历史支撑/阻力位与簇(clusters)。
用户可在设置中调整灵敏度与分析周期。该工具不代替交易者决策——仅提供用于分析的数据。 特性 每根蜡烛的 tick 活动显示(tick counters)。 买/卖双方的百分比比率。 基于 tick 成交量构建的历史支撑与阻力位。 价格区域的簇分析(cluster analysis)。 针对不同交易周期(剥头皮、日内、中期)的灵敏度可调。 可开启/关闭 tick 历史显示以减少图表干扰。 数据本地保存;不依赖外部 DLL,也不向外部服务发送数据。 优化呈现以
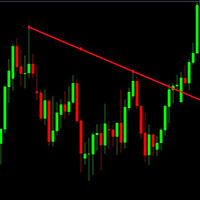
This is just a simple indicator that show Alert when the Current candle Close Above the Trendline. Previous candle do not affect the Alert. The indicator is tied to the Trendline so if the Trendline is accidentally deleted, the Alert will not work. The indicator will draw another Trendline if the current Trendline is deleted. Removing the indicator will removed the Trendline. There are 4 type of Alert to set: Popup Alert, Signal Alert, Push Notification, Comment.
FREE

Footprint Hunter – 您在MT4上的努力与结果雷达 Tape Hunter 是为希望洞察MetaTrader 5价格背后真实动态的交易者打造的终极指标。它基于POC(控制点)直观清晰地显示买卖双方的激进成交量,让您能够直观地看到市场的努力与每根K线上的实际结果。 ️ 这为何重要?
并非所有成交量都能推动价格!Tape Hunter 突出显示努力(激进成交量)是否真正推动了价格,有助于识别: 真正的激进行为和陷阱所在 市场是否被吸收或持续推动 主导成交量与价格方向的一致性 使用 Footprint Hunter,您将获得专业的Tape Reading视角,更精准地做出进出场决策。 相关指标 – 提升您的流动性分析 为更高效交易,推荐与 Tape Hunter 配合使用以下强大指标: Big Player Range
映射机构交易者活跃区域,提供回调概率预测。与 Footprint Hunter 结合,验证大玩家强势操作区域的激进行为。 ️ Imbalance DOM Pro
读取订单簿(DOM)中的失衡,预测隐藏的价格压力。与 Fo

. Simple Trading System Update !!! Follow this link to see our Strategy !!! (With auto trade indicator)
Description This is an indicator Free Version and showing only history signals, Not real time. Binary Deal Trading Indicator is an indicator on MT4 for Binary Option Trading. It forecasts the overbought / oversold level, Reversal and Fractal point. This indicator will help you to decide a reversal price on any time frame (Recommend M1, M5 and M15). The expiry time is 5-15 minutes after rec
FREE

The Colored MACD indicator is a versatile and powerful tool designed to enhance your technical analysis by providing an intuitive visualization of market momentum and trend changes. Built on the foundation of the popular Moving Average Convergence Divergence (MACD) indicator, this version introduces color-coded histograms to easily distinguish between bullish and bearish momentum. Key Features: Color-Coded Visualization : The indicator features a lime-colored histogram when the MACD is above the
FREE

The indicator displays overbought and oversold levels, calculating them using the Fibonacci golden ratio formula.
It enables both trend-following and counter-trend trading, accommodating breakouts and rebounds from these levels.
It operates on all timeframes, across various currency pairs, metals, and cryptocurrencies.
Suitable for binary options trading.
Key Features: Based on the Fibonacci golden ratio Shows overbought and oversold levels Suitable for market and pending orders Simple
FREE
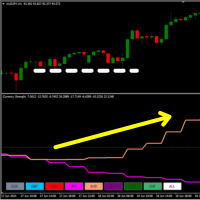
28 market in a Single Indicator! You have 8 Lines and each represents a currency { EUR - USD - GBP - JPY - AUD - NZD - CAD - CHF } .
What It Does? It calculates a custom oscillator on all 28 Forex Pairs and draws you the Strength of each currency. This way you can analyze the Trend and the Volatility on a Multicurrency Rate. Also by Clicking on two different currencies instantly changes the market.
How To Use It? You can use this indicator to find true market contractions when two currencie
FREE

Rua Pinbar This is an indicator to help you quickly identify pinbar candles in the chart. Can be used on any currency pair and any time frame you want. This indicator is often used to determine entry points. You can refer to the product here: https://www.mql5.com/en/users/phamruacoder/seller
A product of Ruacoder Get code indicator and robot (EA) as required.
FREE

此指标显示世界主要市场的当前时间。它也显示当前时段。 使用非常容易。它不会占用太多图表空间。 它可以与 EA 或其它面板一起工作, 比如 虚拟交易板 。 此版本在图表上显示模拟时钟。 Dear friends and users of our EAs, please add your ratings in the Reviews section. All updates to our forex software are free ! This is a free trading utility! 其它功能: 输入参数中有一个选项: 显示/隐藏鼠标覆盖按钮提示, 您也可以选择提示的语言英语 / 俄语; 关闭按钮终止此应用程序; 最大化/最小化按钮在图表上缩放格板; 格板可以在图表上移动。要想移动,在面板上部靠近关闭和最小化按钮的地方用鼠标拖拽,移动到期望的位置。 Expforex,Vladon,Indicator,Utility
FREE

Gina Dual TPO — Brief MQL4 indicator TPO + Volume profile overlaid on chart — fast, scalable, and beginner-friendly. Built for traders who read market structure by POC and Value Area. What it is An MQL4 indicator that overlays dual market profiles—Time-at-Price (TPO) and Volume-at-Price (VPO)—directly on your chart. It’s fast (pixel-based drawing), scalable, and beginner-friendly. Who it’s for Intraday and swing traders who read market structure via POC (Point of Control) and Value Area to spot
FREE

A trend indicator showing the strength of bulls and bears in a trading range.
Consists of two lines:
The green line is a balanced overbought/oversold condition. The red line is the direction of trading activity. Does not redraw calculations.
Can be used on all Symbols/Instruments/Time Frames.
Easy to use and set up.
How to use the indicator and what it determines.
The basic rule is to follow the direction of the red line:
if it crosses the green line from the bottom up, the market is dominat
FREE

Many Forex traders assume there is no volume in the foreign exchange market. And they would be correct. There is no central exchange, not yet anyway. And even if there were, what would it report? What there is however is activity, and this is captured as tick volume. After all, volume is simply displaying activity, the buyers and sellers in the market. So for volume read activity, and for activity read volume – simple. The MT4 platform delivers tick data which the Quantum Tick Volumes indicator

4 trendlines are given by 2 timeframes, defined by the zigzag indicator. It leverages the Zig Zag indicator to identify significant highs and lows across two configurable timeframes (default: M15 for short-term and H1 for medium-term), automatically plotting upward and downward trendlines for each. This helps visualize trend structures, reversals, and alignments between timeframes without switching charts, while adhering to trendline rules that contain the high and low points of the previous two
FREE

A forex pivot point strategy could very well be a trader’s best friend as far as identifying levels to develop a bias, place stops and identify potential profit targets for a trade. Pivot points have been a go-to for traders for decades. The basis of pivot points is such that price will often move relative to a previous limit, and unless an outside force causes the price to do so, price should stop near a prior extreme. Pivot point trading strategies vary which makes it a versatile tool for
FREE

The ATR Arrows MTF indicator is built based on the Average True Range (ATR). It provides entry signals as arrows. All signals are generated at the current bar. Signals do not redraw! All signals in MTF mode correspond to the signals of the period specified in the MTF. It is very easy to use both for trading based on one indicator and for use in your trading systems. The indicator timeframe can be set independently of the main window, so you can combine several indicators in one window.
Paramet

Bitcoin 999 - is a trend indicator that automatically analyzes the market and provides information about the trend and each of its changes, as well as giving signals for entering trades without redrawing! The indicator uses each candle, analyzing them separately. referring to different impulses - up or down impulse. Exact entry points into transactions for currencies, crypto, metals, stocks, indices!
Main functions: Accurate entry signals WITHOUT REPAINTING! Once a signal appears, it remains
FREE
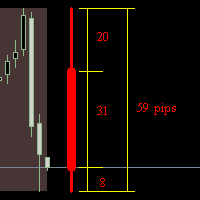
The indicator 'draws' a daily, weekly or monthly candlestick on the current chart. Shows in points the sizes of the upper and lower shadows, the body and the entire candlestick. Real time work. Works in the strategy tester. Indicator parameters: How_much_to_show - how many blocks to show. Block_period - block period (day / week / month) Shift - shift from the edge of the chart in bars. language - language selection.
FREE
Tipu Parabolic SAR Panel is the modified version of the original Parabolic SAR indicator published by MetaQuotes here . Dashboard Panel (multi symbol) version for this indicator is available here .
Features An easy to use Panel that shows the Parabolic SAR trend and signals of selected timeframe. Customizable Buy/Sell alerts, push alerts, email alerts, or visual on-screen alerts. Customizable Panel. The panel can be moved to any place on the chart or minimized to allow more space. To enable the
FREE

Looking for entry points along the local trend without repaint! Arrows indicate entry points. Based on classic indicators. The indicator is easy to use. Settings Наименование Описание Frequency factor Signal frequency. The less, the more often.
This affects the quality.
Recommendations Recommended for use on major currency pairs. Timeframe from m5, m15, m30 Subscribe to my telegram channel, where we discuss intraday trading, ideas, indicators, etc., a link in my profile contacts.
FREE
**Squeeze Box Indicator** Squeeze Box is a powerful technical analysis indicator developed for the MetaTrader 4 platform, designed to support day trading strategies. This indicator analyzes market movements to detect bullish and bearish breakout signals, enabling traders to capture trends early. With its customizable features and user-friendly interface, it is ideal for both novice and experienced traders.
### Features and Functions - **Bullish and Bearish Signals**: Identifies market break
FREE
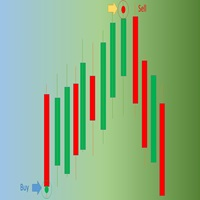
Wave_Entry_Alerts_In_EUR.mq4 is a custom indicator developed by Azad Gorgis for MetaTrader 4. This indicator is designed to provide alerts based on ZigZag patterns, specifically tailored for trading on the (EUR/USD) symbol.
Key Features: - Chart Window Indicator: The indicator is designed to be displayed on the main chart window. - Arrow Signals: The indicator generates arrow signals on the chart, indicating potential reversal points based on ZigZag patterns. - Customizable Parameters: Traders
FREE
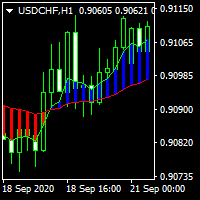
............................................hi................................................ .........................its a simple indicator of movings ............................
.........................a diffrent show of moving averages.......................... ...............can select period , shift , mode and applied price.................. ............many traders use movings for find market movement.................
...........................it can helpfull for finding trends.......
FREE
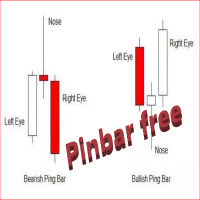
The Free Pin Bar MT4 indicator identifies Pin Bars It will even give you sound or email alerts if want them. If you download it and like it please leave a review! It would be wonderful
Pin Bars are purely based on price action as reflected by the candle formations created by Forex price movements. input Parameters are maximum allowed body/length ratio for the Nose bar. Nose body should be position in top (bottom for bearish pattern) part of the Nose bar. tells the indicator that the Left Ey
FREE

波段交易概念
适用场景
专为波段交易设计的MT4指标。运用超级趋势逻辑捕捉趋势反转,并通过自动斐波那契级别显示止盈点位。
工作原理
1. 趋势追踪
采用基于ATR的超级趋势算法。当价格趋势突破时发出信号。
2. 信号生成
趋势向上反转 → 绿色买入框+箭头(位于K线下方) 趋势向下反转 → 红色卖出框+箭头(位于K线上方)
3. 斐波那契目标位
自动绘制7个目标位:
止损位(SL) 入场点(Entry) 止盈点1-2-3-4(TP)
平仓点:平仓位置
所有位级均以虚线显示,价格标注于其旁。
功能说明
自动信号:买入/卖出框及箭头 斐波那契位级:自动计算TP1-TP4 基于ATR:适用于所有交易对(外汇、黄金、加密货币)
简洁界面:网格自动收拢,右侧预留空间
支持缩放:信号框尺寸恒定
使用指南
绿色买入 → 开仓做多,跟随止盈位
红色卖出 → 开仓做空,跟随止盈位
止损位设于SL价位
分批止盈于TP价位
参数设置:
ATR周期:14(默认)
ATR倍数:12.0(默认) 斐波那契回溯:100根K线
其他参数无需修改默认值

Fibonacci Retracement object is an object that has been provided by metatrader 4 platform. But Fibonacci Retracement object doesn't automated adjust the chart. You have to put and manage it manually to the chart. Because of that, this indicator was created. If you like using filbonacci retracement indicator, highly recommended to use Automated Fibonacci Retracement Indicator if you want to get better result in here:
https://www.mql5.com/en/market/product/95515
LT Automated Fibonacci Retraceme
FREE

Th indicator is a technical analysis tool that helps identify significant changes in price trends and filter out minor price fluctuations. It is used to highlight price swings and provide a clearer picture of market movements. The Pivots are found by checking if a certain candle is the highest/lowest in a given number of candles that come before and after it. This indicator has only one input, its period. The Higher the period, the more strict the indicator is about what constitutes a Pivot. Th
FREE
ALL MOVING AVERAGES:多样化策略的终极自定义指标 ALL MOVING AVERAGES 自定义指标是您进行深入技术分析的必备工具,拥有 31 种以上最受欢迎的移动平均线 的惊人集合。该指标专为经验丰富的交易者和初学者设计,提供无与伦比的灵活性,让您完美地调整移动平均线以适应各种交易策略。 通过全面的输入参数范围,包括不同的周期和不同的价格计算类型,您可以轻松地调整指标以适应您的交易风格和分析需求。 主要特点和优势: 丰富的移动平均线库: 访问 31 种以上移动平均线的庞大选择,从经典的简单移动平均线 (SMA) 到 Hull 移动平均线和零滞后指数移动平均线等高级选项,确保您拥有所有工具。 高度可定制: 通过调整周期和从 20 种不同的价格计算类型 中选择,包括标准收盘价、开盘价、最高价、最低价以及高级 Heiken Ashi 选项,微调您的分析。 全面的警报系统: 通过及时通知保持消息灵通: 当前 K 线警报: 价格行动展开时立即获取警报。 K 线收盘警报: 在 K 线完成后接收通知以获取确认信号。 可自定义声音警报: 根据您的喜好个性化警报声音。 电子邮件警报:
FREE

Unlock your trading potential with Momentum Master , the smart indicator designed to help you navigate the markets with confidence. This powerful tool provides clear, actionable signals by combining the strengths of multiple proven indicators. Say goodbye to guesswork and hello to precision trading. Momentum Master is more than just a signal provider; it's your personal market analyst. It uses a unique combination of Moving Averages (EMA 34 & 55) to identify the trend, MACD for trade confirmatio
FREE
热力图指标:高级成交量分析工具 本指标通过热力图形式直观展示市场成交量活动,帮助用户更清晰地识别成交量动态与市场变化。 功能特点 1. 热力图可视化 使用颜色梯度表示成交量强度: • 蓝色:低活动 • 绿色:中等活动 • 橙色:高活动 • 红色:成交量高峰 2. 可自定义界面 • 用户可调整颜色设置 • 可选实时百分比显示 • 布局简洁,便于理解 3. 警报系统 • 可根据市场条件设置提醒 • 实时通知关键变化 4. 性能优化 • 占用资源低,运行稳定 • 兼容所有时间周期 应用场景 • 日内交易:识别成交量波动与市场活跃度 • 波段交易:辅助分析市场的积累与分布区域 • 高频交易:捕捉快速变化的市场信号 参数设置 • 可调整分析周期 • 支持选择点数成交量或实际成交量 • 灵活配置,适应不同交易风格 使用优势 • 操作简便,界面清晰 • 可根据个人偏好进行定制 • 实时提醒支持交易决策 法律声明 本产品仅用于分析目的。历史表现不代表未来结果。金融交易具有风险,请谨慎操作。.

A fractal divergence is a hidden divergence , based on Bill Williams' fractals. A bullish fractal divergence is a combination of two lower fractals, the last of which is located below the previous one, and, at the same time, two candles to the right of the Low of the last fractal have Lows higher than the previous fractal level (see screenshot 1). A bearish fractal divergence is a combination of two adjacent upper fractals, the last of which is located above the previous one, but, at the same ti
FREE

Pullback Viewer is designed to show valid pullback points in a bearish or bullish trend.
What is considered a valid pullback?
A valid pullback needs to have a body close outside the previous candle high (in a bearish trend ) or previous candle low (in a bullish trend ). If the candle wicks out the previous candle, it's not a valid pullback.
Pullback must liquidate the previous candle with a clean candle body close.
When is this indicator useful?
It's useful to understand and
FREE

产品标题 Smart Bollinger Bands (MT4) – SmartView 系列的一部分 简短描述 具有独特用户体验的 Bollinger Bands 指标,在 MetaTrader 平台上提供。提供以前不可用的高级功能,例如双击打开设置、隐藏和显示指标而无需删除它们,以及以全图表大小显示指标窗口。设计用于与 SmartView 指标系列的其余部分无缝协作。 概述 SmartView 系列通过创新功能为 MetaTrader 平台上的指标提供独特且与众不同的用户体验,使指标管理更快、更轻松。每个指标都配备了图表上的智能控制面板,显示基本信息并提供对所有重要功能的快速访问。 以前不可用的独特功能 SmartView 系列提供使指标工作更简单、更快速的高级功能: 双击打开设置: 无需在指标列表中搜索,双击面板上的指标名称即可直接打开设置窗口。 隐藏和显示指标: 一键隐藏和显示指标,无需从指标列表中删除和重新添加它们。 以全图表大小显示指标窗口: 在子窗口中,您可以最大化指标窗口以全图表大小显示,并临时隐藏其他窗口。 折叠和展开子窗口: 折叠子窗口以减少其高度并节省屏幕空间,然
FREE
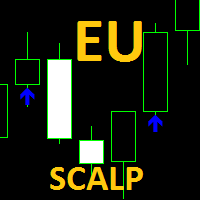
带警报的剥头皮指标:
EU Scalp 指标是两个工作集的组合,第一个预设与价格走势相反,第二个根据价格波动或突破发生的概率与价格走势方向相反。重要的贸易水平。
默认设置针对 EurUsd 货币对 M5 Timeframe 进行了优化,更多设置可以在第一条评论的“评论”部分找到。
如果您想获得预期的结果,以及交易水平值,图表上会显示手数建议。交易水平也以线的形式绘制在图表上。
该指标预设为在价格达到其中一个活跃交易水平时发送警报,箭头指示买入(蓝色)或卖出(红色)以及何时应该关闭订单。仅当出现新蜡烛并且最后一根蜡烛的主体已突破交易水平时,才会激活订单警报。
可以在我的卖家资料中找到像此指标一样工作的专家顾问,可用于进一步优化或实时交易。 如果将文件复制到“专家”文件夹中,则可以使用策略测试器测试 EU Scalp 指标。使用价格和图表注释中的建议手数计算潜在利润。
FREE

Rtc ML Ai | Predictor CORE MACHINE LEARNING ENGINE
Adaptive ML Market Predictor – Multi-Bar Trend & Candle Forecast What This Indicator Does This indicator is a real-time market prediction engine designed to analyze price behavior and estimate future market tendencies . Unlike conventional indicators, this system does not rely on static parameters or historical curve-fitting , but adapts its internal state dynamically during live market operation. Instead of using static rules, the indic

Average daily range, Projection levels, Multi time-frame ADR bands shows levels based on the selected time-frame. Levels can be used as projections for potential targets, breakouts or reversals depending on the context in which the tool is used. Features:- Multi time-frame(default = daily) Two coloring modes(trend based or zone based) Color transparency
FREE
Color Levels - удобный инструмент для тех, кто использует технический анализ с использованием таких инструментов, как Трендовая линия и Прямоугольник. Имеется возможность настройки двух пустых прямоугольников, трех закрашенных и двух трендовых линий. Настройки индикатора крайне просты и делятся на пронумерованные блоки: С цифрами 1 и 2 вначале - настройки пустых прямоугольников (рамок); С цифрами 3, 4 и 5 - настройки закрашенных прямоугольников; С цифрами 6 и 7 - настройки трендовых линий. Объе
FREE

This indicator is not only for trading but also for learning, thanks to it, you can learn to identify trend, support and resistance.
You've probably heard about the Dow trend theory, where higher highs and higher lows indicate an uptrend, and lower highs and lower lows indicate a downtrend. This indicator determines this trend based on the Dow Theory. You just need to enter a number representing the number of candles between extremes. The optimal solution is the number 3 (H1 TF), unless you wa
FREE

Trend Reversal Catcher with Alert MT5 Trend Reversal Catcher with Alert MT5 是一款基于价格行为的指标, 无重绘、无延迟、无虚假信号 ,专为识别市场精准反转点而设计。 它结合了枢轴点检测、经典K线形态(Pin Bar 和 吞没形态),以及基于ATR的波动率过滤器,提供清晰可靠的反转信号。 MT5 https://www.mql5.com/en/market/product/150541?source=Site +Market+My+Products+Page
指标会在图表上绘制买入/卖出箭头,并发送实时提醒,适用于剥头皮、日内交易和波段交易,覆盖外汇、指数、贵金属和加密货币市场。 主要功能 无重绘、无延迟 – 所有信号均为最终信号;箭头一旦出现,就不会消失。 纯价格行为逻辑 – 不依赖滞后指标(仅使用ATR做波动率筛选)。 基于枢轴点的反转检测 – 识别真实转折点。 K线形态确认 – Pin Bar 和 吞没形态确认反转。 波动率过滤 (

Unleash Your Trading Edge with TrendSight Pro! Tired of lagging indicators and confusing charts? TrendSight Pro: Signal Paint Engine is the solution you need. This smart indicator cuts through the market noise, giving you clear, high-probability trade signals right on your chart. It's designed to make your trading simpler, faster, and more profitable by combining quick momentum analysis with a powerful long-term trend filter. Key Advantages and Features Crystal-Clear Trade Signals: Forget compl
FREE
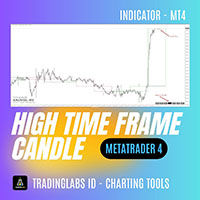
HTF Candle Plus Timer Upgrade your trading experience with HTF Candle Plus Timer, a smart indicator that displays higher timeframe candles directly on your current chart. It allows you to stay aligned with the bigger market picture while focusing on your preferred trading timeframe. Key Features: Higher Timeframe Candles
Plot custom higher timeframe (HTF) candles such as H1, H4, D1, W1, or MN directly on lower timeframe charts for a clearer market overview. Current Candle Timer
A live countdown
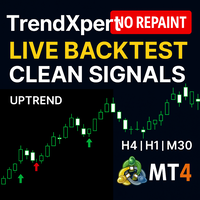
TrendXpert Indicator v1.02 – Master the Trend, Trade with Precision Overview
TrendXpert v1.02 is a precision tool built for serious traders who want to stay on the right side of the market. Designed specifically for the 4H, 1H, and 30M timeframes, it helps you identify high-probability trend conditions and delivers timely, clean trade signals—without clutter or confusion. What’s New in v1.02 Enhanced Trend Detection : Improved internal logic ensures even greater accuracy in trend labeling and
FREE
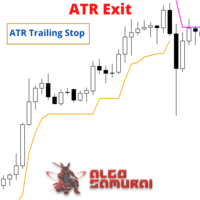
The ATR Exit indicator uses the candle close + ATR value to draw trailing stop lines (orange under buys, magenta over sells) that advance with the trend until the trend changes direction. It uses a multiple of the Average True Range (ATR), subtracting it’s value from the close on buy, adding its value to the close on sell. Moreover, the trailing stop lines are generated to support the order’s trend direction (long or short): In an upward trend, the long trailing stop line (orange line under bu
FREE

This simple indicator paints with a darker color on the volume bar when the quantity traded is above the average of select number of periods of the volume itself, highlighting the moments when there was a large volume of deals above the average. It is also possible to use a configuration of four colors where the color tone shows a candle volume strength. The indicator defaults to the simple average of 20 periods, but it is possible to change to other types of averages and periods. If you like t
FREE

Trend is Friends is an line Indicator used as an assistant tool for your trading strategy. The indicator analyzes the standard deviation of bar close for a given period and generates a buy or sell trend if the deviation increases. It good to combo with Martingale EA to follow Trend and Sellect Buy Only/Sell Only for EA work Semi-Automatic. You can use this Indicator with any EAs in my Products.
FREE

Whether trading stocks, futures, options, or FX, traders confront the single most important question: to trade trend or range? This tool helps you identify ranges to either trade within, or, wait for breakouts signaling trend onset.
Free download for a limited time! We hope you enjoy, with our very best wishes during this pandemic!
The issue with identifying ranges is some ranges and patterns are easy to miss, and subject to human error when calculated on the fly. The Automatic Range Identifi
FREE

The indicator looks for buying and selling zones, where a deal can be opened with a minimal stop loss and a better Risk Reward Ratio. The indicator is based on qualitative search of the Double top/Double bottom pattern. This version works only on USDCAD! The full version of the indicator can be purchased here - https://www.mql5.com/en/market/product/29820
Indicator operation principle Looks for local tops/bottoms which can potentially become a Reversal zone It waits for an impulse movement that
FREE

Indicator Description GOLD TITAN KING SIGNAL INDICATOR High-Precision Gold Scalping Buy/Sell Signals – Manual Trading Assistant Overview The Gold Titan King Signal Indicator is a manual trading assistant tool designed for high-frequency scalping on Gold (XAUUSD) and other major pairs.
It generates clear BUY/SELL signals with precise entry levels, along with adjustable Stop Loss and Take Profit levels displayed directly on the chart. ️ This tool is NOT an EA. It does not execute trades

The SuPrEs indicator indicates the distance to the next horizontal line whose name begins with the configured prefix (see Options).
usage Draw support & resistance in the chart and let the indicator warn you, as soon as a configured distance is undershot. Use the prefix to provide alarms for other lines as well as standard lines (see screenshot with pivot indicator).
Display of the indicator The indicator displays the distance to the next line above and below the current (Bid) price. Not more
FREE

Всем привет. Предлагаю на обозрения очень достойный индикатор входы очень четкие можно по мартину отрабатывать 30 мин до и после новостей не торгуем можно накинуть индикатор новостей больше вам не чего не надо есть сигнал стрелка за крепилась на следующую входим Экспирация любая валюта тоже любая. осцилляторы и авторский алгоритм.И еще можно через бот авто торговля на скрине.И еще друзья после приобретения или аренды пишем мне свои контакты я вам помогу все настроить что бы работало на авто то
FREE

Indicator overview Trend indicator usage Moving averages. Highest quality alerts that need no introduction. It is completely loyal to the original algorithm and uses other useful features.
Easy to trade Carry out all kinds of notifications It's not a new paint and it's not a back paint. Setting Indicator EMA50 in Time frame H1 for any pair currency and Gold Spot. EMA200 in Time frame H1 for any pair currency and more than EMA250 for Gold spot. Using it for maximum benefit Set up notification
FREE

Ska ZigZag Line indicator determines the overbought and oversold regions within a trend. The indicator determines the overbought region by the candlestick high and the oversold region by the candlestick low in a form of a line. To utilize the full strategy i recommend using "Ska ZigZag Line" together with "Ska ZigZag BuySell". NOTE: This indicator is a line based indicator. HOW TO USE: Sell Signal; Place a sell trade when the Ska ZigZag BuySell indicator arrow appear on top of the Ska ZigZag Lin
FREE

This indicator plots another symbol on the current chart. A different timeframe can be used for the symbol, with an option to display in multiple timeframe mode (1 overlay candle per several chart candles). Basic indicators are provided. To adjust scaling of prices from different symbols, the overlay prices are scaled to the visible chart price space.
Features symbol and timeframe input MTF display option to vertically invert chart, eg overlay USDJPY, invert to show JPYUSD
data window values; o
FREE

Parabolic MA Pro - Système de Trading Avancé Détectez les retournements de tendance avec précision grâce à notre système unique combinant SAR Parabolique et Moyenne Mobile ! CARACTÉRISTIQUES RÉELLES SYSTÈME HYBRIDE INNOVANT SAR Parabolique calculé sur la Moyenne Mobile (au lieu du prix direct) Filtrage des faux signaux grâce à la double validation Algorithme exclusif de retournement de tendance ALERTES PRÉCISES Notifications sonores aux points de retournement Détection automati
FREE

Mejore la precisión de sus operaciones con el Sesiones de trading de WH MT4 Indicador para MetaTrader 4. Esta potente herramienta te ayuda a visualizar y gestionar sesiones clave del mercado sin esfuerzo. Basado en: Indicador WH SMC MT4
Versión MT5: WH Trading Sessions MT5 Características principales: Panel GUI interactivo – Seleccione y alterne fácilmente entre Asia, Londres y Nueva York sesiones de negociación.
Alertas y configuraciones personalizables
FREE

Relative Volume or RVOL is an indicator that averages the volume of X amount of days, making it easy to compare sessions volumes.
The histogram only has 3 colors:
Green - Above average volume
Yellow - Average volume
Red - Below average volume
The default setting is 20 days, which corresponds more or less to a month of trading.
With the data obtained from this indicator you can better gauge the commitment behind a move. For example, you will be better equipped to judge if a breakout of a r
FREE

This indicator scans for you up to 30 trading instruments and up to 8 timeframes for occurrences of the high probability reversal patterns: Double Tops/Bottoms with fake breakouts . Please read also the blog post " Professional Trading With Double Tops/Bottoms And Divergences! " which explains the concepts behind the ULTIMATE Double Top/Bottom indicator and how you can use a professional top-down approach. This FREE Version of the Scanner scans only EURUSD and GBPUSD. The full version of the sca
FREE

The Correlation Matrix indicator shows the actual correlation between the selected instruments. The default setting is set to 28 currency pairs, gold, and silver, but the indicator can compare any other symbols.
Interpretation of the indicator Positive correlation (correlation is above 80 %). Negative correlation (correlation is below -80 %). Weak or no correlation (correlation is between -80 and 80 %).
Main features The indicator shows the actual correlation between the selected instrumen

High-Precision Volatility Notifier V1.10 Developed by: Grazia-system-com Title: Stop Chasing Volatility: Get Notified Only When the Real Breakout Starts. The professional, noise-filtered tool that transforms your MT4/MT5 into a smart, proactive monitoring system. Never miss an institutional-level move again. Why This Detector Is Different (Dual-Layered, Noise-Filtered Intelligence) Most volatility tools use fixed thresholds that fail in dynamic markets. Our Notifier eliminates false signals
FREE

The indicator displays market profiles of any duration in any place on the chart. Simply create a rectangle on the chart and this rectangle will be automatically filled by the profile. Change the size of the rectangle or move it - the profile will automatically follow the changes.
Operation features
The indicator is controlled directly from the chart window using the panel of buttons and fields for entering parameters. In the lower right corner of the chart window there is a pop-up "AP" button
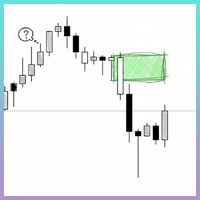
这个指标内置了交易量统计,根据实时交易量以及对比最近500根K线的交易量,实现了真实的流动性区域识别功能。 根据识别的结果,在图表中绘画出流动性区域,这些流动性区域预示着价格将会去到哪些价位。 我们通常在相对大一些的周期去寻找还未被触碰到的关键流动性区域,然后在小周期内寻找合适的入场机会。 当价格触碰到关键流动性区域时,即可平仓离场。 流动性监测能够有效的帮助客户了解,价格将要去到哪里,为什么去到那里,哪些区域能够促使价格反转等等作用。 流动性区域也分为高阻力流动性区域和低阻力流动性区域,价格往往会通过低阻力流动性区域,而高阻力流动性区域则往往会让价格产生回调或反转。 掌握这些知识和理论,有助于帮助投资者了解价格走势逻辑。

Stochastic Candles Indicator It will convert the stochastic indicator from separate window to the chart window by drawing oversold-overbought coloring candles. Red is overbought and blue is oversold by default.And you can change the color later on the external indicator setting.This is Multi timeframe indicator that means it can show appearance result from another timeframe.E.g: If you set timeframe H1 then it will draw candles from Timeframe H1 whatever timeframe you attach on. It will be us

Indotrend is a Smart indicator to detects the Trend and also view support & resistance, multiple timeframe to get validate the trend. it can be use for Forex,Index,Metal,Stock and Crypto. Parameters: Alerts - show popup alert message on Metatrader Hi Lo H1 Timeframe - Show LIne Hi/Low Price base on H1 timeframe Show Fibonaci level - Show Fibonaci retracement level
Show Support Resistance, - Show Support & Resistance H1 timeframe.
FREE

Smart Liquidity Levels is a valuable tool for identifying optimal liquidity levels, enabling retail traders like us to strategically set our stop-loss orders. T he essential tool for traders seeking to maximize their trading success. The liquidity level is a critical component of inner circle trading (ICT). It assists us in determining when and how we should enter the market. Watch the video for detailed instructions. Here's why understanding liquidity levels is crucial in trading and how our

Trading system for scalping. The indicator shows the direction of the price, the amplitude (channel) of its movement and the pivot point. The system automatically analyzes the market using the tick volume averaging algorithm for a certain period of time. After that, Scalper Thunder compares the data with other analysis indicators to identify potential pivot points. As soon as such a point is found, the indicator shows the price reversal and its current direction on the chart. The essence of trad

This indicator signals about crossing of the main and the signal lines of stochastic (lower stochastic) in the trend direction which is determined by two stochastics of higher time frames (higher stochastics). It is not a secret that stochastic generates accurate signals in a flat market and a lot of false signals in a protracted trend. A combination of two stochastics of higher time frames performs a good filtration of false signals and shows the main tendency. The indicator is recommended for
FREE

FZR indicator determines fractal zigzag reversal pattern of all the time frames of the chosen symbol and shows the information in the Info label. Indicator draws the detected pattern in the chosen time frame and also you can select in the menu to draw the trend line according to FZR peaks. What it is FZR? See the first picture in the screenshots. As you can see for every peak of FZR the AO indicator must cross zero line. FZR indicator determines the trend direction.
How to use FZR for trading?
FREE

The indicator displays the probable ( Support and resistance ) levels. The indicator draws horizontal and trend levels of support and resistance. The indicator settings: Trends - the mode for displaying trend lines or horizontal lines of support and resistance Yes - display trend lines only No - display horizontal lines only UseResource - use the resources built into the indicator. Yes - use the ZigZag indicator from the resources of the product. No - use a custom ZigZag indicator. HistoryBar -
FREE
学习如何在MetaTrader AppStore上购买EA交易,MetaTrader平台的应用程序商店。
MQL5.community支付系统支持通过PayPay、银行卡和热门付款系统进行交易。为更好的客户体验我们强烈建议您在购买前测试EA交易。
您错过了交易机会:
- 免费交易应用程序
- 8,000+信号可供复制
- 探索金融市场的经济新闻
注册
登录