适用于MetaTrader 4的技术指标 - 9

The Omega Trend Indicator is an advanced tool that has been specifically designed to detect market trends early, and follow them efficiently. The indicator draws two lines. The main (thicker) Trend Line represents the presumed lower or upper volatility limits of the current market trend. A break in the main Trend Line indicates a potential reversal or shift in the movement of the trend. The Trend Line also indicates the best point to place a stop loss order. In Omega Trend Indicator, the Trend L
FREE
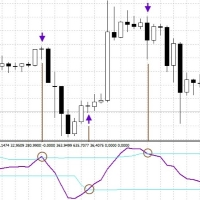
Cyclic Smoothed Relative Strength Indicator
The cyclic smoothed RSI indicator is an enhancement of the classic RSI, adding
additional smoothing according to the market vibration,
adaptive upper and lower bands according to the cyclic memory and
using the current dominant cycle length as input for the indicator. The cRSI is used like a standard indicator. The chart highlights trading signals where the signal line crosses above or below the adaptive lower/upper bands. It is much more responsive
FREE
NYXORA SIGNAL – Precision Scalping Power for XAUUSD (M1) NYXORA SIGNAL is an advanced scalping indicator designed exclusively for XAUUSD (Gold) on the M1 timeframe .
It automatically detects potential reversal zones and refines them into a precise 30-pip area , giving traders fast and accurate entries in the ultra-volatile Gold market. Main Features Auto Reversal Zone Detection – Smart algorithm that identifies and refines potential reversal areas into a consistent 30-pip zone. Custom SL & TP Le
FREE

多时间框架锯齿形调整浪指标。 它显示支撑/阻力水平线及其突破,并绘制当前的市场目标。 它还可以显示分形指标的线条和其他时期(最多季度)的蜡烛。指标——连接关键低点和高点以显示趋势线。
该指标重新绘制最后一个(当前)点,并且在某些情况下可以更改最后 2-3 个点。
所有线条均绘制为对象(不是指标缓冲区,但有可能接收 EA 的数据)。 在 Expert Advisor 中使用时,您可以使用 iCustom 读取 ZigZag 点。
设置 Mode — 根据计算支撑位和阻力位 — Zig Zag — ZigZag 指标; — ZigZag Close — 之字折线收盘指标; — Fractals — 分形指标; — High-Low of the period — 通过高低水平构建指标。 时间范围在Period参数中指定; — Candles only — 仅绘制蜡烛; Depth — 如果最后一根蜡烛的偏差小于(或大于)前一根,则 Zigzag 将不会绘制第二个最大值(或最小值)的烛台的最小数量; Deviation — 锯齿形形成局部顶部/底部的两个相邻烛台的最高点/最

This indicator has been created for finding the probable reversal points of the symbol price. A small candlestick reversal pattern is used it its operation in conjunction with a filter of extremums. The indicator is not redrawn! If the extremum filter is disabled, the indicator shows all points that have a pattern. If the extremum filter is enabled, the condition works – if the history Previous bars 1 candles back contains higher candles and they are farther than the Previous bars 2 candle, such
FREE

Upper and Lower Reversal - 早期预测反转时刻的系统。允许您在价格变动通道的上限和下限的边界处找到价格转折点。
指示器永远不会重新着色或改变信号箭头的位置。红色箭头是买入信号,蓝色箭头是卖出信号。
适应任何时间范围和交易工具 该指标不会重新绘制,仅在蜡烛收盘时起作用。 信号警报有多种类型 该指标易于使用,只有 2 个外部可配置参数: Channel Length - 调整构建信号的价格通道的长度。 Signal Normalization - 改变信号箭头的质量水平,参数越高 - 错误信号越少(对于 BTC、黄金和高波动性工具,变化几个数量级) Alerts play sound / Alerts display message / Alerts send notification / Send email - 当输入信号箭头出现时使用通知。 Sound for signals - 信号箭头的声音文件。

Channel Searcher MT5 — 多货币价格通道检测指标 这是一款辅助型工具,用于基于分形极值点和几何分析自动检测并可视化价格通道。本指标仅适用于手动交易,专为采用结构性市场分析方法的交易者设计。它通过多项标准识别通道:触碰次数、通道斜率、填充密度、突破深度以及分形点的相对位置。同时支持针对任意价格图表的灵活自定义。 以下链接可帮助您获取更多功能 如果您希望: 获取 MetaTrader 5 版本的指标 提问或获取技术支持 本指标适合哪些交易者? 适合希望识别清晰价格结构并查看高质量通道(无多余噪音或随机线条)的交易者。 适合希望获得更多兴趣点、又不愿手动监视大量图表的交易者。系统提供通知功能,助您及时掌握机会。 适合重视灵活配置的用户:您可以调整灵敏度、颜色、声音、绘图模式,甚至限定在特定K线范围内进行搜索。 功能与优势 多维度分析 指标基于分形点搜索通道,并验证几何结构、触碰密度、斜率及抗突破能力——所有功能集成于一体。 灵活可视化 完全控制显示内容:可开启/关闭分形点、通道线、跟随模式、颜色及线宽。 声音与文本通知 当发现新通道、通道延续或发生突破时,指标可通过声音
FREE

ADX arrow
该指标将 ADX indicator (平均方向移动指数)的信号显示为图表上的点。
这便于信号的视觉识别。 该指示器还具有警报(弹出消息框)和向电子邮件发送信号。
参数 Period -平均周期。 Apply to -用于计算的价格:关闭,开放,高,低,中位数(高+低)/2,典型(高+低+关闭)/3,加权关闭(高+低+关闭+关闭)/4。 Alert -启用/禁用警报。 EMail -启用/禁用向电子邮件发送信号。 Period - averaging period. Apply to - price used for calculations: Close, Open, High, Low, Median (high+low)/2, Typical (high+low+close)/3, Weighted Close (high+low+close+close)/4. Alert - enable/disable alerts. EMail - enable/disable sending s

Adjustable Fractal MT4 is a modification of Bill Williams' Fractals indicator. The fractal consists of a two sets of arrows - up (upper fractals) and down (lower fractals). Each fractal satisfies the following conditions: Upper fractal - maximum (high) of a signal bar exceeds or is equal to maximums of all bars from the range to the left and to the right; Lower fractal - minimum (low) of a signal bar is less or equal to minimums of all bars from the range to the left and to the right. Unlike a s
FREE

FOLLOW THE LINE GET THE FULL VERSION HERE: https://www.mql5.com/en/market/product/36024 This indicator obeys the popular maxim that: "THE TREND IS YOUR FRIEND" It paints a GREEN line for BUY and also paints a RED line for SELL. It gives alarms and alerts of all kinds. IT DOES NOT REPAINT and can be used for all currency pairs and timeframes. Yes, as easy and simple as that. Even a newbie can use it to make great and reliable trades. NB: For best results, get my other premium indicators for more
FREE

The Support & Resistance Breakout Indicator with Smart Alerts a utomatically identifies key support and resistance levels using fractal detection, and receive instant breakout signals enhanced by RSI/CCI confirmation filters. This versatile tool includes push notifications, email alerts, pop-up alerts, and sound alerts so you never miss a trading opportunity. Key Features:
Dynamic Level Detection – Draws real-time support and resistance based on market fractals. Breakout Arrows – Clear vis
FREE

Gold Flux Signal – 针对 XAUUSD 的非重绘信号指标
专为清晰信号执行而设计 – Gold Flux Signal 专为在 XAUUSD 上提供清晰、稳定的进场信号而开发
– 专注于趋势跟随和突破策略,避免图表杂乱和误信号
– 此指标仅基于 已收盘的蜡烛图 生成信号,确保信号真实可靠
– 最适用于 M1、M5 和 H1 时间周期
稳定的可视化信号 – 一旦信号生成,它将固定在图表上,不会闪烁或消失
– 箭头直接绘制在图表上:
• 洋红箭头 = 买入信号
• 青色箭头 = 卖出信号
– 所有箭头 不会重绘 ,只基于确认后的市场行为,而非预测
基于自适应价格行为的逻辑
– 信号逻辑基于以下内容生成:
• 实时波动范围测量
• 使用修改后的 WPR 指标确认动量变化
– 可识别趋势延续或反转点
– 信号 不会连续频繁生成 ,而是通过过滤减少噪音,强调高概率交易时机
– 特别适用于活跃市场阶段,尤其在 M1 与 M5 时间框架中表现出色
智能警报系统
– 每个信号生成时将同步触发警报
– 通过弹出窗口提示交易者及时反应,即使在

2 copies left at $65, next price is $120
Scalper System is a user-friendly indicator designed to detect market consolidation zones and anticipate breakout movements. Optimized for the M1 or M15 timeframe, it performs best on highly volatile assets like gold (XAUUSD). Although originally designed for the M1 or M15 timeframe, this system performs well across all timeframes thanks to its robust, price action-based strategy.
You can visually backtest the indicator to evaluate the accuracy of its si

Smart Volume Box is designed to give MetaTrader users a powerful, analytical tool for uncovering the hidden dynamics in the market. This precision-built tool, complete with user-friendly settings, integrates essential volume insights and advanced features like Volume Profile, VWAP (Volume Weighted Average Price), and Point of Control (POC) levels. Unlike typical indicators, Smart Volume Box doesn’t provide specific trade signals but instead offers a clearer perspective on market trends, making

BUY INDICATOR AND GET EA FOR FREE AS A BONUS + SOME OTHER GIFTS! ITALO LEVELS INDICATOR is the best levels indicator ever created, and why is that? Using high volume zones on the market and Fibonacci the Indicator works on all time-frames and assets, indicator built after 7 years of experience on forex and many other markets. You know many levels indicators around the internet are not complete, does not help, and it's difficult to trade, but the Italo Levels Indicator is different , the Ital
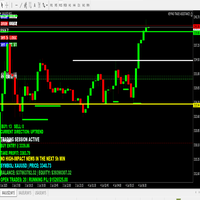
TRADING STRATEGY GUIDE DELIVERY The full Trading Strategy Guide will be sent directly to you after purchase.
Just message me on MQL5 and ask for it — you'll receive it instantly, along with priority support and setup help. Powered Market Scanner for Smart Trading Decisions Keypad Support & Resistance is a next-generation MT4 trading system built for serious traders who demand precision, reliability, and clarity. It combines advanced smart filters with real-time price structure logic to gener
FREE

World Trend is a hybrid trend indicator, as it is based on the signals of elementary indicators and a special algorithm for analysis. The indicator shows favorable moments for entering the market. The intelligent algorithm of the indicator determines the trend, filters out market noise and generates entry signals.
You can use the indicator as the main one to determine the trend. The indicator can work both for entry points and as a filter. Uses two options for settings. The indicator uses colo
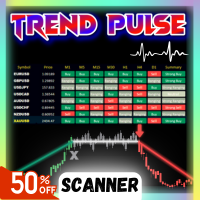
Introducing Trend Pulse , a unique and robust indicator capable of detecting bullish, bearish, and even ranging trends! Trend Pulse uses a special algorithm to filter out market noise with real precision. If the current symbol is moving sideways, Trend Pulse will send you a ranging signal, letting you know that it's not a good time to enter a trade. This excellent system makes Trend Pulse one of the best tools for traders!
Why Choose Trend Pulse ?
Never lags and never repaints: Signals appea
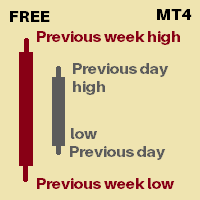
Its an indicator that will show you
Previous day high Previous day low Previous week high Previous week low You can set how many days of history you would like to see for previous day high low and previous week high low Currently 30 days of PDH/L will be marked 4 weeks of PWH/L will be marked You can change it from indicator settings. Dates are shown at marking lines to identify which date does that marking belongs to.
Thank you :) Always open to feedback and criticism if it helps me provide yo
FREE

Indicator determines the direction of price movement, calculates the possibility of entering the market using an internal formula and displays a breakout entry signal. Indicator signals appear both at the beginning of trend movements and in the opposite direction, which allows you to open and close orders as efficiently as possible in any of the market conditions. Version for МТ5: https://www.mql5.com/en/market/product/58980
Benefits: a unique signal calculation formula; high signal accuracy; d
FREE
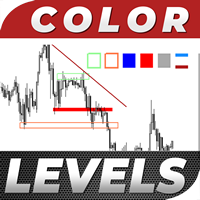
Color Levels is a convenient tool for traders using a Trendline and a Rectangle in their technical analysis. It allows setting two empty rectangles, three filled ones, and two tredlines. The indicator parameters are very simple and divided into numbered blocks: The ones beginning with 1 and 2 - empty rectangle (frame) parameters; 3, 4, and 5 - filled rectangle parameters; 6 and 7 - trendline parameters. Simply click a desired object and it will appear in the upper left corner. Main Adjustable Pa
FREE

前一交易日的收盘价与K线位移 MetaTrader! 前一交易日的收盘价与K线位移指标是一种旨在改善技术分析和交易决策的工具。借助该指标,您可以获取有关任何K线的开盘价、最高价、最低价和收盘价的详细信息,从而实现对市场走势的精确和全面分析。 想象一下,您可以将一个时间框架放置在另一个时间框架之内,以便在当前时间框架内详细分析每根K线。通过前一交易日的收盘价与K线位移指标,您可以轻松实现这一令人难以置信的功能! 前一交易日的收盘价作为支撑位和阻力位的重要性已经得到交易者社区的广泛认可。现在,通过这个工具,您可以清晰准确地看到价格在前一收盘价停止的水平,为您的买卖决策提供宝贵的见解。 将该指标应用于您的图表上后,您将立即获得前一交易日的开盘价、最高价、最低价和收盘价等关键信息,以视觉上引人注目的方式突出显示。此外,您还可以调整K线的位移,使您能够在当前时间框架内分析MetaTrader的任何时间框架的数据。 这个独特的功能将使您能够根据所选时间框架中前一交易日收盘价提供的支撑位和阻力位,识别基于任何所需时间框架的蜡烛图形态,开启新的交易机会,并增加您的成功机会。您可以基于前一交易日的收盘价
FREE

指标在图表上显示基于终端RSI振荡器的信号。 从而能够滤除重复信号。
这里振荡器用于搜索反向信号。 建议将其作为波段策略和水平交易的切入点。
多币种仪表板可用。 有了它,您可以轻松地在图表之间切换。 在产品讨论中,您可以建议一种可以在其中嵌入仪表板的算法。
输入参数 。
主要设置 。
Bars Count – 指标将工作的历史柱的数量 。 RSI Period – 振荡器周期 。 RSI Level – 振荡器的电平。 振荡器在0到100之间。 如果选择10,信号将高于10,低于90 。 RSI Applied Price 。 Repeat Signal - 重复信号 。 Enable – 所有重复的信号将与箭头/图标 。 No Signal – 所有重复的将被忽略 。
视觉箭头 。 Sell Code – Sell rsi图标的代码编号 。 Sell Color – 出售RSI图标的颜色 。 Buy Code – 购买RSI图标的代码编号 。 Buy Color – 购买RSI图标的颜色 。 Indent Coeff – 由波动系数从阴影缩进 。 Size – 图标大
FREE

我们创新的基本烛台形态仪表盘专为自动识别图表上的盈利烛台形态而设计。该仪表盘使用先进的算法实时扫描价格图表,并检测从经典到复杂的各种烛台形态。此外,它还有一个易于使用的界面,允许您在不同的时间框架上对检测到的形态进行可视化,从而轻松做出明智的决策/ MT5 版本
免费指标: Basic Candlestick Patterns
包括谐波形态 看涨形态 Hammer Inverse hammer Bullish engulfing Morning star 3 White soldiers 看跌形态 Hanging man Shooting star Bearish engulfing Evening star 3 Black crows
指标列 Symbol: 将显示所选符号 Pattern: 形态类型(锤子型、反向锤子型、看涨吞没型......) Bar: 自检测到该形态以来所经过的柱状图数量 Age (in minutes): 自检测到该形态以来的年龄
主要输入 Symbols : 从 "28 种主要货币对 "或 "选定符号 "中选择。 Selected Symb
开盘区间突破指标 是一款基于交易时段的交易工具,专为遵循机构交易理念(例如 ICT(内部圈交易者)、智能货币理念(SMC) 以及基于 交易量 或 订单流 的策略)的交易者设计。该指标绘制了重要的开盘区间,帮助交易者识别全球主要外汇交易时段中潜在的 流动性扫荡、突破区域、假突破 以及 关键的日内水平 。 该策略植根于 开盘区间的概念, 这是一个在每个交易日开盘后预先定义的时间框,可帮助交易者判断做市商的意图、短期偏好以及日内方向性走势。通过标记区间的高点和低点并延伸这些水平,该指标能够直观地协助监控 智能货币突破 、 交易日横扫 、 假突破 、 公允价值缺口 (FVG) 以及 区间扩张 。 该工具重点介绍了四个主要基于会话的时间盒: 伦敦开盘区间突破(格林威治标准时间 07:00–08:00) :伦敦开盘区间突破通常被认为是波动性最大的时段,它对于捕捉伦敦开盘期间最初的 区间扩张 和 流动性抢夺 至关重要。它可以作为识别 受困交易者 、 持续突破 或早期 假波动的 基础。 纽约开盘区间突破(格林威治标准时间 13:00–14:00) :该区间对于发现纽约时段 的盘中反转 、 突破

Monster reverse is a reverse trading indicator that gives powerful reversal points trades that have high probability to hit, the indicator doesn't repaint and signal is not delayed. Note : please combine the indicator with your system for best experience with the indicator indicator parameters : 1.signal periods 2.bands periods 3.arrow colors 4.alerts ----------
FREE

Here is the English version of the sales copy. I have maintained the aggressive, high-energy marketing tone of the original Japanese text while correcting the "Facebook" error to the proper "Fibonacci Retracement." ONI GEAR PRO v2.22 Professional Dow Theory & Drawing Assist System Launch Sale: $499 (Limited Time Special Offer) The era of "Manual Analysis" is completely over. With the evolution to v2.22, even "hesitation" is a thing of the past. Endlessly clicking through charts, straining you

This indicator help to mark the high and low of the session Asian,London,Newyork , with custom hour setting
This indicator is set to count from minute candle so it will move with the current market and stop at the designated hour and create a accurate line for the day.
below is the customization that you can adjust :
Input Descriptions EnableAsian Enables or disables the display of Asian session high and low levels.
EnableLondon Enables or disables the display of London session high and
FREE

Market Profile 3 MetaTrader 4 indicator — is a classic Market Profile implementation that can show the price density over time, outlining the most important price levels, value area, and control value of a given trading session. This indicator can be attached to timeframes between M1 and D1 and will show the Market Profile for daily, weekly, monthly, or even intraday sessions. Lower timeframes offer higher precision. Higher timeframes are recommended for better visibility. It is also possible t
FREE

Royal Scalping Indicator is an advanced price adaptive indicator designed to generate high-quality trading signals. Built-in multi-timeframe and multi-currency capabilities make it even more powerful to have configurations based on different symbols and timeframes. This indicator is perfect for scalp trades as well as swing trades. Royal Scalping is not just an indicator, but a trading strategy itself. Features Price Adaptive Trend Detector Algorithm Multi-Timeframe and Multi-Currency Trend Low

The Penta-O is a 6-point retracement harmonacci pattern which usually precedes big market movements. Penta-O patterns can expand and repaint quite a bit. To make things easier this indicator implements a twist: it waits for a donchian breakout in the right direction before signaling the trade. The end result is an otherwise repainting indicator with a very reliable trading signal. The donchian breakout period is entered as an input. [ Installation Guide | Update Guide | Troubleshooting | FAQ | A
FREE

Description: This indicator draw ZigZag Line in multiple time frame also search for Harmonic patterns before completion of the pattern.
Features: Five instances of ZigZag indicators can be configured to any desired timeframe and inputs. Draw Harmonic pattern before pattern completion. Display Fibonacci retracement ratios. Configurable Fibonacci retracement ratios. Draw AB=CD based on Fibonacci retracement you define. You can define margin of error allowed in Harmonic or Fibonacci calculations
FREE

FREE

This Indicator is a affordable trading tool because with the help of Popular Developers & Support of M Q L Platform I have programmed this strategy. I tried to combine logic of Moving Averages, Parabolic Stop And Reverse, Trend Strength, Oversold, Overbought . Furthermore, I have also care about Support Resistance that Trader can easily get in touch with market by selecting one indicator only. What is in for Trader?
Trading Modes: This selection is for activate whole strategy "Power A
FREE
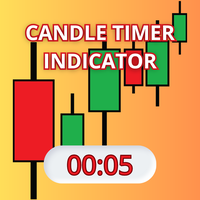
Candle Timer Indicator is a custom tool designed for the MetaTrader 4 (MQL4) trading platform. Its primary purpose is to display a moving timer on the chart, indicating the remaining time before the current candle closes. This feature is particularly useful for traders who need precise tracking of candle closing times for their technical analysis strategies. My indicators for free. I onl
FREE

这 蜡烛电源专业版 是一款旨在解码的复杂交易工具 实际成交量压力、报价数据不平衡以及机构订单流动态 通过测量 牛市蜱虫与熊市蜱虫之间的斗争 实时。该指标将原始 成交量数据转化为可操作的见解 ,帮助交易者识别 智能货币运动、流动性追逐和隐藏的市场心理 在每个价格 K 线图背后。通过分析 买方/卖方成交量百分比、分歧模式和基于成交量的确认 ,它弥补了 价格行为和交易量分析 ,对于关注以下交易者来说非常有价值 ICT、SMC 和机构交易方法 。 与传统的成交量指标不同, 蜡烛电源专业版 专注于 报价数据粒度 ,揭示每根蜡烛的走势是否与标的一致 牛市/熊市强度 或发出潜在信号 做市商陷阱、逆转或突破延续 。它与 基于时段的策略(伦敦/纽约杀戮地带)、公允价值缺口(FVG)和区间突破 ,提供对 市场流动性和参与者意图 。
工作原理: 指标流程 实时报价量数据 ,计算百分比 看涨交易与看跌交易 每根蜡烛内。这揭示了: 买家/卖家不平衡: 看跌蜡烛图上牛市跳动百分比较高,警告 潜在的逆

交易实用必备工具指标 波浪自动计算指标,通道趋势交易 完美的趋势-波浪自动计算通道计算 , MT4版本 完美的趋势-波浪自动计算通道计算 , MT5版本 本地跟单复制交易 Easy And Fast Copy , MT4版本 Easy And Fast Copy , MT5版本 本地跟单复制交易 模拟试用 Easy And Fast Copy , MT4 模拟账号运行 Easy And Fast Copy , MT5 模拟账号运行 砖图PRO->>> 砖图在主图上的显示 .
砖形图因为比较理想地剔除掉了价格毛刺,因此,看上去令人感觉非常舒服。特别是, 在其上建立基于形态的交易系统看起来非常理想。 比如,如果我们打算使用趋势线,我们会经常发现,有些趋势线的突破并没有多大的意义,它不过是在震荡而已。荡着荡着,趋势线就突破了。而使用砖形图就可以有效地避免类似的尴尬。
FREE
指示器显示垂直体积. 在设置中,有2个系数用于确定高和极值,1个用于确定低音量。 类似的算法也用于指示器 UDP1 Volume Pixel 。 当检测到指定的体积时,直方图以适当的颜色着色。 直方图的宽度会根据比例自动选择。 作为一项规则,价格反应的最大和最小体积。 但有必要使用确认信号。
输入参数 。
基本设置 。 Bars Count - 指标将显示在其上的蜡烛数 。 Calc Bars - 确定体积偏差的平均蜡烛数 。 Low Volume Factor - 我们定义低容量的系数 。 High Volume Factor - 我们定义大体积的系数 。 Extreme Volume Factor - 我们定义极值体积的系数 。
视觉设置 。 Histo Color - 根据蜡烛的体积和方向选择颜色来着色直方图 。 Width Histo (-1 auto) - 规则直方图的厚度 。 Width Color Histo (-1 auto) - 颜色直方图的厚度。 默认情况下,自动选择厚度。
电线杆 。 Draw Polus - 显示两极。 极点被定义为逆分形。 左右的音量
FREE

US30 Revolt a Technical indicator that is 100% non-repaint and appears on the current candlestick works on all timeframes (recommended M15,M30,H1) The indicator is made for US30 but it can be used on other pairs as well When a blue arrow appears look for buying opportunities When a orange arrow appears look for selling opportunities Please watch the YouTube video on how to properly set up and use the indicator
FREE
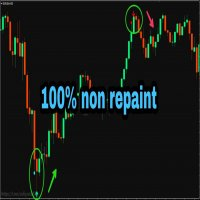
PLEASE NOTE You can customize the settings of K_period value, the oversold and the overbought value is customizable. You can change it as per your requirement. The accuracy will change as per your settings.
100% Non repaint indicator
Pre-alert (get ready) signals
Non-delay indications
24/7 signals
100% No lag
No recalculating The arrows wont repaint even if the signal fails, or you refresh or restart the mt4 Indicator is based on simple crossover strategy of main line and signal line of St
FREE

Did You Have A Profitable Trade But Suddenly Reversed? In a solid strategy, exiting a trade is equally important as entering.
Exit EDGE helps maximize your current trade profit and avoid turning winning trades to losers.
Never Miss An Exit Signal Again
Monitor all pairs and timeframes in just 1 chart www.mql5.com/en/blogs/post/726558
How To Trade You can close your open trades as soon as you receive a signal
Close your Buy orders if you receive an Exit Buy Signal. Close your Sell orders if
HTF MACD – Trend-Aligned Signals (one subwindow, arrows on chart) What it does
This indicator keeps you trading with the higher-timeframe trend while using MACD crosses for precise entries. In a single subwindow it shows: HTF Trend Histogram — green = uptrend, red = downtrend (neutral is hidden for a cleaner view) MACD Lines — blue = MACD main, orange = MACD signal Arrows on the price chart when a valid, trend-aligned MACD cross occurs Optional alerts on bar close Entry logic (strict, closed-ba
FREE

UR伽瑪 (由機器學習系統中的類似計算提供支持)
UR Gamma 是一種尖端的金融分析工具,它對經典的 WaveTrend 指標進行了全新改進。 通過結合先進的數字信號處理技術,UR Gamma 解決了傳統 WaveTrend 算法的一些局限性,並提供了一種更準確、穩健和動態的方法來識別和衡量價格行為的趨勢。
使用 UR Gamma 的優勢:
簡約設置 所有數據都在後台計算 - 用戶只有 1 個輸出 - 清晰整潔。 表明疲憊的背景水平 適應各種資產。 有一個特殊的電報聊天,您可以在其中了解最新的工具更新,如果您覺得缺少什麼,也可以發送請求!
為什麼選擇 UR Gamma?
目標是讓概率分佈在 -1 和 1 之間振盪,中間點為 0。 為實現這一目標,使用機器學習中稱為激活函數的技術來轉換數據。 一個這樣的函數是雙曲正切函數,它經常用於神經網絡,因為它保持 -1 和 1 之間的值。通過對輸入數據進行一階導數並使用二次均值對其進行歸一化,tanh 函數有效地重新分配輸入 信號進入 -1 到 1 的所需範圍。
UR Gamma 是交易者和投資者的強大工具,為他們提供對市場趨勢
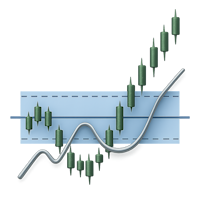
PriceDensity – Professional Price Density Indicator for Accurate Market Level Detection PriceDensity is a smart, non-volume-based indicator that analyzes historical price action to determine key price levels with the highest frequency of occurrence . It automatically detects where the market has spent the most time – revealing hidden areas of support and resistance based on actual market behavior, not subjective drawing. This tool is ideal for traders using price action, support/resistance conce
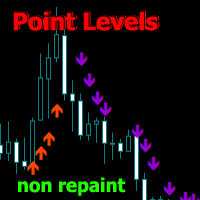
Point Directions - 款显示价格变动期间支撑位和阻力位的指标。箭头指示价格在指定方向的反弹。
箭头不会重绘,且在当前蜡烛图上形成。适用于所有时间框架和交易工具。提供多种警报类型。
它具有高级设置,可用于自定义任何图表的信号。它可以配置用于趋势交易和修正交易。
绘制箭头时,有两种移动平均线类型和一种箭头强度级别。详细设置请参见输入参数。
如有任何使用方面的问题,请发送私信。
输入参数
Method MA - 选择是否使用移动平均线生成箭头(标准或加速) Accelerated MA period/Standard MA period - 更改移动平均线周期 (5-500) Ma Metod - 更改移动平均线方法 Ma Price - 更改移动平均线价格 Arrow Intensity - 箭头强度(随着数值增加而增加) Arrow thickness - 箭头粗细 Sell arrow color/Buy arrow color - 箭头颜色 play sound / display message / send notification / send emai

The indicator draws the time scale on the chart. You can specify the time offset, adjust the size and font to display on the chart (it is displaying your local time on your chart instead of MT time). You can also select the desired format for displaying the date and time. While holding down the middle mouse button, and moving the cursor, a slider will appear on the scale. You may be interested in my other product , which contains a more advanced version of the Time Scale.
You can also find my o
FREE
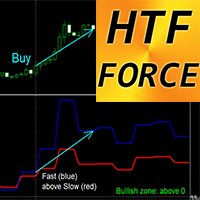
适用于 MT4 的 Crypto_Forex 指标 HTF 力度震荡指标。
- HTF 力度指标是一款强大的多时间框架交易指标。HTF 代表“更高时间框架”。 - 力度指数是将价格和交易量数据合并为一个数值的顶级指标之一。 - 更高时间框架的数值可以显示趋势方向(下行趋势 - 低于 0;上行趋势 - 高于 0)。 - 快速力度指标 - 蓝线,慢速力度指标 - 红线。 - 买入信号 - 快线向上穿过慢线,且两者均高于 0(见图)。 - 卖出信号 - 快线向下穿过慢线,且两者均低于 0(见图)。 - 指标内置移动端和 PC 端警报。 ..................................................... 点击这里查看高质量的交易机器人和指标! 本产品为独家产品,仅在 MQL5 网站上提供。

Katana_Price_Action Original Version → https://www.mql5.com/ja/market/product/158150 Product Description [Product Name] (Please enter the safe name you chose, e.g., Katana Trade System) Concept: Return to Roots – The "Pure KATANA" This product is the "Pure KATANA" , created by stripping away all unnecessary features to return to the essence of the KATANA series. While we have continuously evolved the series by incorporating feedback from many traders, the system eventually became too complex

Backtest with good trend detection results from January 2023
EURUSD Time frame: m15, m30, H1
AUDUSD Time frame: m15, m30 NASDAQ Time frame: m15 S&P 500 Time frame: m15, m30 XAUUSD Time frame: m30 BTCUSD Time frame: H4
These are just some of the assets tested (Please note that past results are no guarantee of future results). Note that this is not a complete strategy, you can use this indicator as an entry trigger after your analysis by setting stop loss and take profit values that you deem
FREE
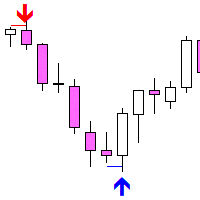
Fakey Detector — 假突破(Fakey)形态指标 Fakey Detector 是一个可以自动识别经典 Fakey(内部K线的假突破)形态的指标,并在图表上用箭头和突破水平线进行显示。 工作原理: Fakey 模式由三根K线组成: 母K线(Mother Bar) — 区间最大的K线 内部K线(Inside Bar) — 完全包含在母K线的范围内 Fakey K线 — 向上或向下突破,但又收盘回到范围之内 当满足设定条件时(包括可选的实体方向过滤器),指标会显示: 向下箭头 — 表示 Fakey Sell 信号 向上箭头 — 表示 Fakey Buy 信号 突破线 — 显示关键突破水平 ️ 参数设置: LookBackBars — 分析的K线数量 MinBreakoutPips — 最小假突破深度(点) UseBodyDirectionFilter — 启用对 Fakey 和 Inside K线实体方向的过滤 UseMotherBarBreakout — true 表示从母K线判断突破, false 表示从内部K线判断 特点: 不重绘 适用
FREE

Detect strength for uptrends and downtrends by tracking Buy Power and Sell Power. Stay on the right side of the market by being able to determine whether the market is in a bull or bear trend and how strong the trend is.
Free download for a limited time! We hope you enjoy, with our very best wishes during this pandemic!
Trend Trigger Factor aims to ride out sideways movement, while positioning the trader in the correct side of the market to capture big trends when they occur. It was origin
FREE

Gartley Hunter Multi - An indicator for searching for harmonic patterns simultaneously on dozens of trading instruments and on all classic timeframes: (m1, m5, m15, m30, H1, H4, D1, Wk, Mn). Manual (Be sure to read before purchasing) | Version for MT5 Advantages 1. Patterns: Gartley, Butterfly, Shark, Crab. Bat, Alternate Bat, Deep Crab, Cypher
2. Simultaneous search for patterns on dozens of trading instruments and on all classic timeframes
3. Search for patterns of all possible sizes. From t

Heikin Ashi Smoothed – MT4指标 Heikin Ashi Smoothed 是一款适用于 MetaTrader 4 (MT4) 的自定义指标,在传统的平均线蜡烛图基础上,通过加入额外的移动平均平滑处理,让趋势显示更加平滑直观。该方法极大减少了图表噪音,使得主趋势和可能的反转信号更加清晰,有助于把握市场方向。 主要特点 在图表上显示经过进一步平滑处理的 Heikin Ashi(平均足)K线,更清晰地反映价格走势 有效过滤小幅波动与虚假信号,趋势一目了然 更容易识别趋势反转,帮助避免因市场噪音导致的多余交易 适用于所有时间周期和任何品种(包括外汇、CFD、指数等) 计算轻巧高效,可在多图表、多周期下流畅运行 原理说明 Heikin Ashi Smoothed 首先计算标准的平均足四价(开盘、高点、低点、收盘),然后在此基础上再应用移动平均(如SMA或EMA)进行二次平滑处理。最终在图表上展现出极其平滑的K线,使细小波动被最大限度压制,主趋势方向更加明显。
通过不同的颜色和形状,趋势方向和强度一目了然,有助于持仓信心和避免因短期回调而频繁操作。 适用对象 采用趋势跟随
FREE

Ichimoku Trend Alert is the Ichimoku Kinko Hyo indicator with Alerts and signal filters.
Ichimoku Trend Alert features: Optional check of Ichimoku cloud, Tenkan sen(Conversion Line), Kijun sen(Base Line), Senkou span A, Senkou span B, and Chikou span relative to price, and more. Popup, email, and phone notification alerts for selected symbols and timeframes.
There are 9 classic Ichimoku trend filters you can enable/disable in settings: Price/Cloud Order: Checks the price position relative to t
FREE

智能趋势通道指标 描述:
智能趋势通道是一款强大而灵活的工具,通过在价格图表上动态绘制支撑与阻力通道,帮助交易者清晰识别市场的关键趋势。利用高级分形计算,该指标能自动生成趋势线,根据市场变化进行调整,助力交易者发现突破与反转区域。 主要功能: 通道显示控制: 可随时开启或关闭趋势通道显示。 动态分形计算: 根据不同时间周期和分形参数自动调整趋势线。 清晰的趋势可视化: 包括上轨线、下轨线和中线,帮助交易者更好地理解市场走势。 颜色自定义: 可个性化设置线条颜色,以提高视觉效果并突出关键市场区域。 适应多种时间周期: 从1分钟到1个月自动适应不同时间框架。 优势: 识别强劲市场趋势与潜在反转点。 提供市场结构信息,增强交易信心。 自动绘制趋势线,节省交易者的时间。 适用场景: 适合突破交易、趋势跟随以及技术分析的交易者。 适用于短线剥头皮交易和长期市场分析。 智能趋势通道指标为市场分析提供了智能化、可定制的解决方案,帮助交易者掌握市场动态,做出明智的交易决策。
FREE

Dark Trend Pro V1.0 Signal - 终极商业级交易系统 (推荐图片:一张深色/霓虹风格的截图,显示仪表盘面板正处于“强 (Strong)”或“极强 (Ultra)”信号激活状态) 执行摘要 (EXECUTIVE OVERVIEW) Dark Trend Pro (商业级 v1.0) 不仅仅是一个简单的指标,它是一个专为专业交易者设计的综合市场分析引擎。基于专有的 “多层共振算法 (Multi-Layer Confluence Algorithm)” 构建,该系统能有效过滤市场噪音,以手术刀般的精准度识别高概率入场点。 与那些充斥着低质量信号的普通指标不同,Dark Trend Pro 采用了独特的 “信号质量评分 (Signal Quality Score)” (0-100%) 技术。底层的 AI 会实时评估市场结构、动量和波动率,为每一笔交易分配一个概率评分。您只在数学概率对您有利时才进行交易。 为什么选择 DARK TREND PRO? 100% 不重绘 (Non-Repainting): K线收盘后信号永久固定。不闪烁,不消失历史记录。可靠性

順勢而為 —— 專為「追隨趨勢」設計的明確交易信號 在金融市場中,最穩定、最有機會獲利的時機,往往出現在「明確趨勢已經形成」的情況下。然而,即使是有經驗的交易者,也常常難以成功搭上這波趨勢。 Ride the Trend Signal 是一款專注於趨勢行情中的「回調買入」與「反彈賣出」的信號型指標工具。它的設計理念是不追逐趨勢的起點,而是在趨勢已經確認之後,抓住第2波、第3波等較可靠的切入時機。 本指標結合了三種技術分析工具:移動平均線、隨機指標(Stochastic)、以及平均蠟燭圖(Heiken-Ashi)。運作邏輯簡潔實用,適合希望穩定執行順勢交易的使用者作為輔助判斷工具。 所使用的技術指標及其角色 移動平均線: 用於判斷趨勢的存在與方向。該指標透過分析價格對移動平均線的乖離與回歸行為,來確認趨勢是否持續。 隨機指標(Stochastic): 作為進場時機的過濾器,僅當條件符合時才顯示信號,以提高有效性。 平均蠟燭圖: 幫助濾除市場雜訊,使趨勢方向更清晰,並作為信號觸發的依據之一。 不搶第一波 —— 僅在趨勢確認後發出信號 Ride the Trend Signal 的邏輯設定為
FREE

Pipfinite creates unique, high quality and affordable trading tools. Our tools may or may not work for you, so we strongly suggest to try the Demo Version for MT4 first. Please test the indicator prior to purchasing to determine if it works for you. We want your good reviews, so hurry up and test it for free...we hope you will find it useful.
Combo Razor Scalper with Trend Laser Strategy: Scalp in the direction of the trend Watch Video: (Click Here)
Features Scalping indicator using a confirme

- Real price is 200$ - 50% Discount (It is 99$ now) - It is enabled for 3 purchases. Contact me for extra bonus (Gann Trend indicator), instruction or any questions! - Non-repaint, No lag - I just sell my products in Elif Kaya Profile, any other websites are stolen old versions, So no any new updates or support. - Lifetime update free Gann Gold EA MT5 Introduction W.D. Gann’s theories in technical analysis have fascinated traders for decades. It offers a unique approach beyond traditional c
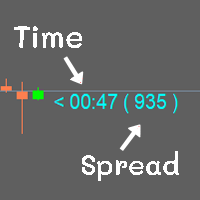
Show the time of candlesticks and spread. All data will be displayed in a rod. Can change color Can fix the size as needed
MT4 : Link https://www.mql5.com/en/market/product/102742 MT5 : Link https://www.mql5.com/en/market/product/102834
Most free code on various websites I didn't write it myself. I only do a little bit.
If you like it, please give 5 stars with it. Thank you.
FREE

Evolutionize Your Trading with the UT Alert Bot Indicator for MQL4 The UT Alert Bot Indicator is your ultimate trading companion, meticulously designed to give you an edge in the fast-paced world of financial markets. Powered by the renowned UT system, this cutting-edge tool combines advanced analytics, real-time alerts, and customizable features to ensure you never miss a profitable opportunity. Whether you’re trading forex, stocks, indices, or commodities, the UT Alert Bot Indicator is your k
FREE

RSI TrendGate 3MA 是一款用于图表显示的指标,通过结合 RSI 与三条移动平均线(MA)来帮助更清晰地确认趋势方向。
当根据设定条件判断市场处于“偏多(上升)”或“偏空(下降)”状态时,指标会在图表上绘制箭头。 本产品不用于将箭头作为单独的进出场信号。推荐用法是:在较高周期确认方向,在较低周期依据用户自己的规则选择入场时机。 概述 本指标根据以下要素进行方向判定。 三条 MA 的排列判定(方向基础)
指标计算短期/中期/长期三条 MA,并按其排列关系对市场状态分类: 上升状态:MA Short > MA Mid > MA Long 下降状态:MA Short < MA Mid < MA Long 其他:无状态(MA 交织,方向不明确) 短期 MA 斜率过滤(可选)
通过比较短期 MA 在两个指定 shift 上的差值(例如 Shift1 与 Shift3)判断短期 MA 是否具有足够斜率。
可设置以点(points)为单位的最小斜率阈值,用于减少接近横盘的状态。 RSI 平滑(对 RSI 数组进行移动平均)
先计算 RSI,然后对 RSI 数组应用移动平均(MA on
FREE

或 M oving 一个 verage 小号 upport [R esistance 带 。
MASR Bands 指标是一条移动平均线,由两条带共同作为支撑位和阻力位。据统计,MASR 波段 93% 的时间都包含价格蜡烛。以下是分步计算的方法: 1. 第一步是计算 X 时间段内的最高价 (HHV) 和最低价 (LLV)。
2. 第二步是用HHV除以LLV,得到它们之间的距离有多宽的百分比。我称这一步的结果为 MASR Filter。
3. MASR 过滤器 = 总和 ((HHV / LLV)-1) / 柱数
4. 我将上带称为 MAR,这是移动平均阻力的捷径。我将下频带 MAS 称为移动平均线支持的捷径。波段之间的移动平均线称为中心线。
5. MAR = MASR 中心 + (75% x MASR 过滤器 x MASR 中心)
6. MASR 中心是移动平均线。
7. MAS = MASR 中心 - (75% x MASR 过滤器 x MASR 中心)
重要链接
MASR 工具手册: https://www.mql5.com/en/blogs/post/721889

该程序将使分析多个时间范围更加方便。
这将有助于在不同的时间范围同步图表中同步所有图表以显示相同的符号, 相同的特定时间段和同步绘图对象同时显示在所有图表上
在这个版本中,只有 6 种对象类型可以同步所有图表。
绘图对象类型支持:垂直/水平线、趋势线、矩形、箭头、斐波纳契回撤
附加功能:趋势线警报 如果您想在价格触及趋势线时获得警报,您只需在描述字段中将“alert”一词放在趋势线属性中, 当价格触及该趋势线时,MT4 会弹出提示信息,您也将通过 MT4 App 收到通知
使用方法>> https://youtu.be/NEHUW7v1h1c
报告问题或关注最新版本更新
网站: www.RookieTraders.com LineID:@RookieTraders
FREE

Keltner Channel is a well known indicator that not in MT4's indicators default lineup (You can get this from your broker somehow). This indicator helps you to define trend and sometimes overbought/oversold prices during flat trend. Input Description: EMAperiod: Moving Average period used for indicator. Must be higher than 1. ATRperiod: Average True Range period used for indicator. Must be higher than 1. multiplier: Multiplier used for determine channel's wide. Must be higher than 0 but may not b
FREE

BREAKOUT-SESSION-BOX LONDON EU US ASIA Open
watch the expectation of a volatile movement above or under the opening range We take the high of the range as Entry for a long trade and SL will be the low of the range and vice versa the low of the range as Entry for a short trade and the high for SL The size of the range is the distance to the TP (Take Profit) The range of the opening hours should not be larger than about 1/3 of the average daily range 4 breakout examples are already predefined: A
FREE
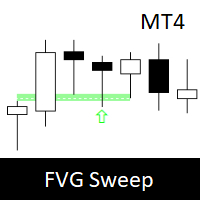
Fair Value Gap Sweep is a unique and powerful indicator that draws fair value gaps on your chart and alerts you when a gap has been swept by the price. A fair value gap is a price gap that occurs when the market opens at a different level than the previous close, creating an imbalance between buyers and sellers. A gap sweep is when the price moves back to fill the gap, indicating a change in market sentiment and a potential trading opportunity.
Fair Value Gap Sweep indicator has the following
FREE
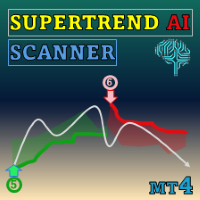
Special offer : ALL TOOLS , just $35 each! New tools will be $30 for the first week or the first 3 purchases ! Trading Tools Channel on MQL5 : Join my MQL5 channel to update the latest news from me 通过 SuperTrend AI Clustering with Scanner ,体验人工智能的强大力量。这款革命性的交易工具适用于 MetaTrader4 (MT4),结合了 K-means 聚类和广受欢迎的 SuperTrend 指标,帮助交易者在趋势和信号中掌握主动。 See more MT5 version at: SuperTrend AI Clustering MT5 with Scanner See more products at: https://www.mql5.com/en/users/ndhsfy/seller
为何此工具独树一帜 虽

SMC Venom 模型 BPR 指標是針對在智慧貨幣 (SMC) 概念內工作的交易者的專業工具。它會自動辨識價格圖表上的兩種關鍵模式: FVG (公平價值缺口)是三根蠟燭的組合,其中第一根和第三根蠟燭之間存在缺口。它在水平之間形成一個沒有成交量支撐的區域,這通常會導致價格調整。 BPR (平衡價格區間)是兩種 FVG 模式的組合,形成一個「橋樑」 - 當價格以低成交量活動移動時,突破並返回到水平的區域,從而在蠟燭之間產生間隙。 這些模式可協助交易者透過分析圖表上的交易量和價格動態(大型市場參與者和普通參與者之間的互動)來識別關鍵的支撐/阻力位、突破區域和切入點。 此指標以矩形和箭頭的形式可視化模式,也支援靈活的警報設定。 主要特點:
模式顯示模式:選擇顯示 BPR 模式(看漲和看跌)或 FVG 模式(看漲和看跌)。 可以隱藏所有圖表分析模式。 以條數過濾:BPR 結構中 FVG 之間的最小/最大距離。
訊號的附加視覺化:
箭頭有 9 種類型可供選擇(標準、細、分形等)或手動輸入 Wingdings 代碼,其表格可以選擇性地顯示在圖表上。 使用 ATR 配置顏色、尺寸及其相對於價格
中文(简体)Iceblock 简短描述:
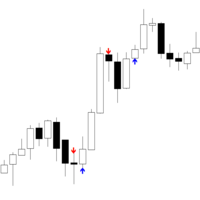
Iceblock — MT4 指标,识别高成交量但价格波动小的聚簇(类似冰山单行为)。 时间框架:
适用于所有时间周期(M1 至 D1)。 品种:
兼容外汇、指数、黄金和差价合约(CFD)。 参数: VolumeLookback – 计算平均成交量的蜡烛数量 VolumeThreshold – 判定成交量异常的乘数 ClusterSize – 用于确认簇的相邻蜡烛数量 RangeComparisonPeriod – 用于平均价格区间(高–低)的周期 简短结论:
Iceblock 高亮显示成交活跃但价格变动有限的区域——类似冰山单导致的现象,但仅基于 MT4 的成交量与价格数据。箭头为异常活动标记,不等同买卖信号。
FREE
MetaTrader市场提供了一个方便,安全的购买MetaTrader平台应用程序的场所。直接从您的程序端免费下载EA交易和指标的试用版在测试策略中进行测试。
在不同模式下测试应用程序来监视性能和为您想要使用MQL5.community支付系统的产品进行付款。
您错过了交易机会:
- 免费交易应用程序
- 8,000+信号可供复制
- 探索金融市场的经济新闻
注册
登录