适用于MetaTrader 4的技术指标 - 16

Zen Arrows
專為專業用途而設計,它擁有強大的訊號邏輯和安全的運算,可消除延遲或錯誤更新。
它不會重繪、刪除或修改過去的訊號。
所有買入和賣出訊號均在K線圖上產生並保持不變。
在實際交易中,訊號不會重繪-它會立即顯示在K線圖上。
它提供專業級的穩定性、準確性和靈活性。
該系統能夠準確識別趨勢反轉和動量變化,
提供高勝率的訊號,同時最大限度地減少雜訊和錯誤訊號。
主要功能
多級過濾系統(模組化,完全可自訂)
逼真的即時視覺化效果
圖表上直接顯示清晰的買入/賣出訊號
多級警報系統
彈出窗口,聲音提示
每個訊號僅觸發一次-不會重複。
針對MT4平台進行了全面最佳化。
適用於所有貨幣對、指數、股票、外匯和加密貨幣。
趨勢交易、波段交易、反轉確認。
尋求可靠、清晰的專業交易訊號的交易者。
交易者選擇此指標的原因:
高精度和高勝率,經多層過濾驗證。
無噪音、無重繪、無延遲。
清晰的視覺化效果,即時呈現趨勢資訊。
簡單易用、穩定可靠,適用於實盤交易。
FREE
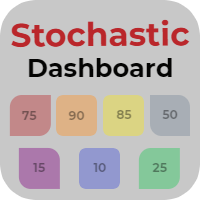
Stochastic Dashboard is an information panel which allows you to have a global market vision through a stochastic indicator. Stochastic Dashboard analyzes and tracks all the assets you want to invest in. Take advantage of this useful dashboard where you can open in a few seconds the chart and quickly invest in it.
Main features of Stochastic Dashboard Graphical panel that allows you to know the situation of many assets. 7 different stochastic situations to discover when an asset is overbought o
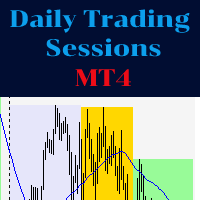
The indicator represents the session boxes for the Asian, European and American sessions. It is possible to change the time of each session, such as color. It is also possible to disable the display of each session. You will find in input parameters variables to modify time sessions in format hh:mm and the color of boxes of each sessions. If you need some implementations please contact me.
FREE
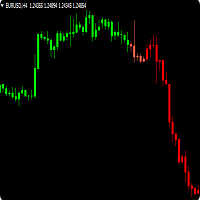
Trendfinder SMA are Colored candlesticks showing the trend based on two Simple Moving Averages and the slope of the slow moving average. This indicator will give you the color change on the next bar on the confirmation candle and will never repaint Trendfinder SMA is optimize to trade on any market and to be used trending and None trending markets. PLEASE TAKE NOTICE: For best results use this indicator as an extra tools after you have completed your regular analysis and use it for alerts base
FREE
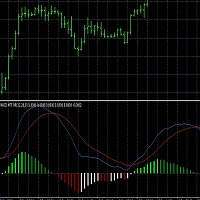
This script generates a MACD with 6 color-coded histogram bars based on the position (above or below zero) and direction (rising or falling) of the histogram. It provides multi-time frame support , allowing users to view the MACD from different time frames on a single chart. The indicator uses customizable settings for MACD periods, histogram width, and vertical scaling. This script could be useful for traders who want a visually enhanced MACD with clearer trend and momentum representation acro
FREE

The indicator displays the probable ( Support and resistance ) levels. The indicator draws horizontal and trend levels of support and resistance. The indicator settings: Trends - the mode for displaying trend lines or horizontal lines of support and resistance Yes - display trend lines only No - display horizontal lines only UseResource - use the resources built into the indicator. Yes - use the ZigZag indicator from the resources of the product. No - use a custom ZigZag indicator. HistoryBar -
FREE

Note : New in 1.6: the indicator now exports the trade signal (but not displayed). Go long with light blue. Go short with red. Exit otherwise. Signal to be imported to your EA using iCustom. This indicator provides Best of the Best linear filter momentum oscillators that I am aware of (Low Pass Differentiators, LPD's) . All of them are recent developments by this developer, or other researchers. The oscillator line is the first buffer of the indicator, and can be called in other indicators or
FREE

The three white soldiers and the three black crows candlestick patterns are reversal patterns that predict a change in the direction of a trend. The pattern consists of three consecutive long-bodied candlesticks that open within the previous candle's real body and a close that exceeds the previous candle's. It's important to note that both formations are only valid when they appear after a strong uptrend or a downtrend, while their efficiency decreases in choppy markets.
Inputs AlertOn - en
FREE

Gina Dual TPO — Brief MQL4 indicator TPO + Volume profile overlaid on chart — fast, scalable, and beginner-friendly. Built for traders who read market structure by POC and Value Area. What it is An MQL4 indicator that overlays dual market profiles—Time-at-Price (TPO) and Volume-at-Price (VPO)—directly on your chart. It’s fast (pixel-based drawing), scalable, and beginner-friendly. Who it’s for Intraday and swing traders who read market structure via POC (Point of Control) and Value Area to spot
FREE

FOTSI is an indicator that analyzes the relative strength of currencies in major Forex pairs. It aims to anticipate corrections in currency pairs following strong trends by identifying potential entry signals through overbought and oversold target areas. Theoretical Logic of Construction: Calculation of Individual Currency Momentum: FOTSI starts by calculating the momentum for each currency pair that includes a specific currency, then aggregates by the currency of interest (EUR, USD, GBP, CHF,

This indicator is based on Guppy's GMMA Strategy. And shows arrows when GMMA lines cross up or down. To have this indicator and get alerts for Multiple Timeframes and multiple Pairs you can check out the demo of this GMMA Trend Scanner indicator: https://www.mql5.com/en/market/product/38747
About GMMA In Brief:
GMMA attempts to identify trends by combining two groups of moving averages with differing time periods: The long-term EMAs (30, 35, 40, 45, 50, and 60) the behaviors of investors that h
FREE

Gold TL MTF - this is a fine stock technical indicator. The indicator algorithm analyzes the movement of the asset price and reflects trend lines along the fractals of a specific timeframe (TF).
Benefits of the indicator: The indicator produces signals with high accuracy. The confirmed signal of the indicator does not disappear and is not redrawn. You can trade on the MetaTrader 4 trading platform of any broker. You can trade any assets (currencies, metals, cryptocurrencies, stocks, indices e
FREE

Профессиональный индикатор "Choch Pattern Levels" с RSI-фильтром для MT4 Описание: Вы устали от ложных пробоев и хотите находить точки разворота тренда с высокой точностью? Индикатор Choch Pattern Levels — это ваш профессиональный инструмент для определения смены характера рынка (Change of Character), дополненный мощным фильтром RSI и анализом объемов , чтобы вы входили в рынок только по самым надежным сигналам. Этот индикатор автоматически находит и отрисовывает на графике ключевые паттерны раз
FREE

"WinWiFi All in Signal is designed based on the principles of Candlestick Consolidation (กระจุกตัว) and Price Expansion (กระจายตัว). By identifying these key behaviors on the M5 timeframe, traders can execute high-frequency entries with confidence. Our system eliminates timezone discrepancies between brokers, focusing purely on price action."
WinWiFi All in Signal – Master the M5 Gold Market "Unlock the power of Price Action with our $600 proven strategy. WinWiFi uses a unique logic of Candlest
FREE

This is an unconventional version of the Heiken Ashi Smoothed indicator implemented as lines rather than a histogram. Unlike a usual histogram, the indicator draws the readings of the two moving averages in the form of colored lines.
Example If the candle crosses two indicator lines upwards, a trend is assumed to be changing from bearish to bullish. If the candle crosses two indicator lines downwards, a trend is assumed to be changing from bullish to bearish. The indicator is good at displaying
FREE
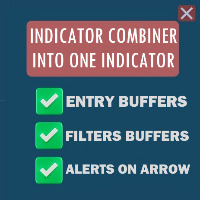
Optimize your trading strategy of your custom indicators with the "Indicator Combiner Into One Indicator". This advanced tool combines multiple indicators, including your custom indicators, into a single, user-friendly interface. It generates an arrow signal based on your custom indicators, simplifying your decision-making process. Ideal for traders of all levels, this indicator offers:
Arrow Signals : Get a clear, single arrow signal that combines insights from your custom indicators, mak
FREE

Trend Lines Cross This indicator will alert you on any cross of a Trendline. You can draw up to two trend lines and form a channel, a pennant , a triangle or a simple trend and when the price crosses either trend line the indicator will provide you with alerts that you define plus an up or down arrow when the cross happened. How to: Draw the 1st trendline and name it tl1. Draw the 2nd trendline and name it tl2. Select which type of alerts you would like in the indicator properties and you a
FREE

The Keltner Channel is a volatility-based technical indicator composed of three separate lines. The middle line is an exponential moving average (EMA) of the price. Additional lines are placed above and below the EMA. The upper band is typically set two times the Average True Range (ATR) above the EMA, and the lower band is typically set two times the ATR below the EMA. The bands expand and contract as volatility (measured by ATR) expands and contracts. Since most price action will be encompasse
FREE
Smart Liquidity Zones (SLZ) — Your All‑in‑One SMC/ICT Radar for MT4
Why SLZ? Tired of squinting at charts trying to spot liquidity grabs, break‑of‑structure candles and Fair Value Gaps before the smart‑money sharks do? SLZ turns your chart into a tactical map —drawing every high‑probability zone and screaming (politely) when price dives in. Core Edge Powered by a rule‑set distilled from Smart Money Concepts (SMC) and ICT mentorship material, SLZ auto‑marks: Component What it shows Why it
FREE

重要通知 – 需要许可证和激活
激活说明:
完成购买后,请立即联系我们以获取您的许可证密钥、密码或激活详情。没有这些,软件将无法运行。我们将确保激活过程顺利进行,并随时为您解答任何疑问。
多语言定制
为了提升您的交易体验,我们提供软件的多语言完整定制服务。我们的团队可以提供以下语言的翻译:
中文 | 法语 | 葡萄牙语 | 西班牙语 | 俄语
日语 | 德语 | 韩语 | 意大利语 | 土耳其语
只需告诉我们您偏好的语言,我们将定制指标,确保为您提供用户友好的体验。
成交量分布 – 高级市场分析工具
成交量分布是一个复杂的分析工具,旨在为交易者提供对市场动态的深入洞察。它捕捉价格随时间的变化,提供实时图形化的拍卖数据表示,揭示影响价格变动的集体行为模式。
其核心是 价值区域 (Value Area) ,代表包含当天68%交易活动的价格范围。这一区域与标准差对齐,突出显示大多数交易发生的区域。
主要功能:
成交量控制点 (VPOC): 识别在指定时间内交易量最高的价格水平,作为公平价格。

Introduction To Time Box Indicator Time Box Indicator is a must have indicator for any trader. It will display daily, weekly and Monthly box according to your preferences. Yet, you can extend any important price levels in your chart automatically. You can use them as the significant support and resistance levels. It is very simple but effective tool for your trading.
Graphic Setting Use White Chart Line Style for Current Open price
Daily Setting Update Timeframe for daily box Number of days to
FREE
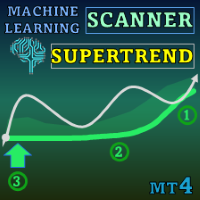
Special offer : ALL TOOLS , just $35 each! New tools will be $30 for the first week or the first 3 purchases ! Trading Tools Channel on MQL5 : Join my MQL5 channel to update the latest news from me 利用先进的机器学习技术,体验 Machine Learning Adaptive SuperTrend 的强大功能,这是一款创新的指标,能够无缝适应市场变化。通过将k-means聚类与SuperTrend方法结合,该指标能够精准识别趋势并评估波动性,为交易者在动态市场中提供宝贵的优势。 查看更多MT5版本: Machine Learning Adaptive SuperTrend MT5 查看更多产品: 所有产品 精准的机器学习与自适应SuperTrend 此指标基于实时市场数据进行调整,将波动性分为高、中、低三个等级。利用k-means聚类,它将ATR(平均真实范

Fibomathe Indicator: Support and Resistance Tool for MT4 The Fibomathe Indicator is a technical analysis tool designed for MetaTrader 4 (MT4) that assists traders in identifying support and resistance levels, take-profit zones, and additional price projection areas. It is suitable for traders who use structured approaches to analyze price action and manage trades. Key Features Support and Resistance Levels:
Allows users to define and adjust support and resistance levels directly on the chart. L
FREE

TG MTF MA MT5 is designed to display a multi-timeframe moving average (MA) on any chart timeframe while allowing users to specify and view the MA values from a particular timeframe across all timeframes. This functionality enables users to focus on the moving average of a specific timeframe without switching charts. By isolating the moving average values of a specific timeframe across all timeframes, users can gain insights into the trend dynamics and potential trading opp
FREE
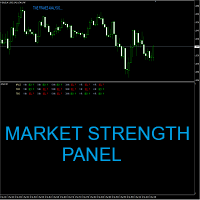
阿波罗市场强度面板是一个多时间框架指标,对外汇和二元期权交易者有帮助。该面板代表了从 M1 到 H4 的几个时间范围内的市场状况。该指标提供有关三个重要市场方面的信息。它们是趋势、力量和冲动。如果所有这 3 个组件都对齐,则该指标将根据市场方向为您提供买入或卖出信号。该指标在您的图表上绘制信号。您可以选择它应该生成信号的时间范围。当所有时间框架都对齐时,它也可以给你一个信号。该指标为您进行市场分析。你准备好应用信号了。该面板可以用作独立系统或作为您现有交易系统的一部分。 无论您喜欢在什么时间范围内交易,该指标都会对您有所帮助。即使您是黄牛或长期交易者,您也可以使用此工具。顺便说一句,即使您使用 D1 图表,您仍然可以使用此工具。我可以教您如何在您想要交易的任何时间范围内使用该工具。 购买后请联系我以获得我的个人交易建议和一个很棒的奖金指标!

Are you tired of drawing trendlines every time you're analyzing charts? Or perhaps you would like more consistency in your technical analysis. Then this is for you. This indicator will draw trend lines automatically when dropped on a chart. How it works Works similar to standard deviation channel found on mt4 and mt5. It has 2 parameters: 1. Starting Bar 2. Number of bars for calculation The starting bar is the bar which drawing of the trend lines will begin, while the number of bars for c
FREE
Этот индикатор является уникальным в своём роде, больше всего подходит для скальпинга на XAUUSD а также для торговли на более старших таймфреймах!
Уведомление сообщит самые важные точки входа, поэтому следует торговать по тренду. Идеален для скальпинга! The Best Trend Signals - трендовый мультивалютный индикатор, может использоваться на любых финансовых инструментах валюта, криптовалюта, металлы, акции, индексы. Рекомендуемый тайм-фрейм M15, M30, H1, H4, D1.
Как торговать с помощью индикатора
FREE

布林带指标的多货币和多时间框架修改。 在仪表板上,您可以看到布林带的突破和触及。 在参数中,您可以指定任何所需的货币和时间范围。 当价格触及布林线、当前波动率发生变化(扩大或下跌)以及价格触及所有布林线时,该指标还可以发送通知。 通过单击带有句点的单元格,将打开该符号和句点。 这是 MTF 扫描仪。
默认情况下,从图表中隐藏仪表板的键是“D”.
参数 Bollinger Bands Settings Averaging period — 计算指标的平均周期。 Standard deviations — 与主线的标准差数。 Bands shift — 指标相对于价格图表的移动。 Applied price — 用于计算的价格。 Show BB on the current chart — 在当前图表上显示 BB
仪表板 Clear the chart at startup — 启动时清除图表。 Set of Pairs — 符号集 — Market Watch — 来自 MT 的“市场观察”的货币对。 — Specified manually — 在参数“Pairs”中手动指定对

水平指标基于前一天的数据。 数学公式决定进场和出场水平。
交易建议。 在欧洲交易时段开始时,当波动出现时进行 Levels 交易。 在波动不足的情况下,使用一半的止盈位出场。 如果价格在一半止盈位反转,则在反转时也在一半止盈位寻找目标。 如果价格从进场水平反弹,那么在反方向上价格可以达到第二个止盈。
不应总是在突破时进场。建议等待回测(突破水平并从反方向测试)。 如果市场上有几个最低成交量水平,则回测效果很好。请参阅 UPD1 剖面水平指标。
输入参数 。
Start Hour - 一天从几点开始。 00 - 默认 。
Visual Button - 按钮显示(启用/禁用) 。 Corner - 按钮锚定角度 。 X indent - 以像素为单位的水平填充 。 Y indent - 以像素为单位的垂直填充 。
Label Visual - 显示级别标签 。 Label Font Size - 字体大小 。 Label Shift Bars - 在酒吧的铭文的缩进 。 Label Tooltip - 在关卡上方的光标下显示文本 。
FREE

The indicator builds a Renko chart in the sub window for the current symbol. The bars are formed from live data and the desired bar size can be set in the inputs tab. Most importantly, because the Renko chart only uses price to construct bars and ignores time, the indicator can be applied to any time frame and same results can be achieved. Recommended usage
As Renko charts are famous for eliminating noise so traders can use this tool to see clear picture of the trend to help their analysis, entr
FREE

比特币预测器是一个基于箭头的指标,旨在预测价格反转。 此工具可与 BTC 和其他加密货币一起使用。它也可以与货币一起使用。但是您需要首先检查哪些配对最有效。一些配对和时间框架可以工作得非常好。您可以自由测试并自己查看。 该指标非常易于使用。所有你需要的是按照箭头。该指标可以作为独立系统工作,也可以作为您已经在使用的任何系统的一部分。购买后我将与您分享我的交易建议和奖金指标! 指示信号可以很容易地调整。您可以使指标算法适应任何时间范围,以及加密货币以外的其他货币对。 信号不要重绘!无论您目前拥有何种级别的交易经验,该交易指标都会对您有所帮助。 购买后请联系我!我将与您分享我的交易建议和奖金! 感谢您对我的指标的关注和兴趣!

Check my p a id tools they work perfect please r ate Here is an Upgraded version with Bonus Ea in case of purchase it costs 30$ only and you get Ea as Bonus: https://www.mql5.com/en/market/product/96835 This indicator is experimetal, it shows TMA channel arrows with Volatility filter built in to avoid lagging. Try to experiment with it, search for better conditions of use. It is possible to adjust different timeframes for TMA and for Volatility filter Same time on the current chart, so it ma
FREE

For some trader's charts analysis use, specially for multi timeframe trading strategies . When you need to check something of the time within different timeframe at the same symbol chart, even different symbol charts, this indicator will show the crosshair at sync moving. You just need to load this indicator into some charts, then the crosshair will shown automatic.
FREE

The indicator is designed for displaying the following price levels on the chart: Previous day's high and low. Previous week's high and low. Previous month's high and low. Each of the level types is customizable. In the indicator settings, you set line style, line color, enable or disable separate levels. The version of the exact same indicator but only with sound alerts there - Time Levels with Alerts .
Configurations ----Day------------------------------------------------- DayLevels - enable/
FREE
Trend Reversal Master Unlock Your Trading Potential with Precision Are you tired of missing key market reversals? Do you struggle to find high-probability entry points? "Trend Reversal Master" is the smart MQL4 indicator designed to help you spot potential trend shifts with confidence and clarity. This powerful tool combines the best of two worlds: the dynamic Parabolic SAR (PSAR) and the robust 200-period Exponential Moving Average (EMA). By filtering PSAR signals through the long-term trend de
FREE

Behaving in a similar fashion as the price action of a chart, the indicator uses " Trix " to opportune itself to the exposure of divergency, flat/low market volume, and price action expansion . The TRIX indicator nicknamed after the Triple-Exponential-average, is a momentum-based oscillator that filters minor price changes and fluctuations that are considered insignificant for forex trading whilst providing money making opportunities! Overall, TRIX is a leading indicator that shows diverge
FREE
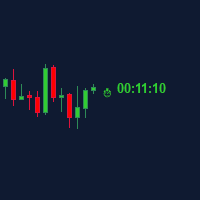
Candle Time (MT4) The Candle Time indicator shows the remaining time for the current candle on the active chart timeframe. It adapts automatically to the chart period and updates on every tick. This is a charting utility; it does not provide trading signals and does not guarantee any profit. Main functions Display the time remaining for the current candle on any timeframe (M1 to MN). Color-coded state: green when price is above the open (up), gray when unchanged, and red when below the open (do
FREE

该指标可搜索脉冲蜡烛并将其显示在图表上。 它包括一个阴影过滤器。它还能找到布林线的突破水平。 在设置中可以启用多货币仪表盘。 警报可选择当前图表或整个列表。 Blog-Link - Retest and Fake Breakout with UPD1
交易模式: 趋势回测。 假突破。 其他。
EURUSD, GBPUSD, XAUUSD, ... M15、M30、H1。
输入参数。
基本参数。 Bars Count - 指标运行的历史条数。 Coeff Period - 计算周期。 Min HL Coeff - 在该系数之上搜索蜡烛图。默认值为 2.0,但如果要在更高时间框架上获得更多信号,可以设置为 1.5。 Shadow Filter – 数值越大,烛台上阴影的大小就越大。最好设置为 50 或更低。
烛台的可视化。 Color Bar – 启用/禁用蜡烛填充。 Width Color Bar (-1 auto) – 填充厚度。默认为-1 自动,此时填充厚度与蜡烛图厚度一致。 Show Arrows On Chart – 在大蜡烛图上方显示数值。它们表示蜡烛比平均值大多

SMC 时段指标 是一种精确工具,专为依赖 ICT 概念、流动性搜寻 和 基于时段的策略 的 智能货币交易者 而设计。它使用机构级交易者使用的最成熟和最流行的概念,无缝地绘制出关键的基于时段的交易区域。这种一体化时段指标将最有效和高概率的区间策略叠加到您的图表上,包括: ICT 亚洲区间、伦敦突破、纽约区间、ICT 伦敦开盘杀戮区、ICT 纽约开盘杀戮区、开盘区间突破 (ORB) (涵盖 伦敦、纽约、东京 )和强大的 午夜开盘区间 。它还突出显示 主要的外汇交易时段, 包括 悉尼、东京、伦敦 和 纽约 。每个区间都使用 TimeBox 方法以最高精度绘制, 有助于识别关键的 FVG(公允价值差距)、区间扫描、时段高点/低点 和潜在的 做市商操纵区域 。该指标专为严肃的 SMC 交易者设计,高度可定制,以与任何经纪商的服务器时间保持一致,从而能够在任何图表或时间范围内精确执行。
ICT 亚洲区间策略: ICT 亚洲区间 策略是智能货币和 ICT 框架下的基础策略。它识别 格林威治标准时间 23:00 至 04:00 之间的累积和盘整区域,这些区域通常会设置流动性陷阱,并使交

RoundNumbers indicator is a simple and powerful psychological price levels. Trader usually use these levels as a Support and Resistance (SnR). Indicator Input: Levels - Numbers of levels drawn on chart. Default 30 levels. BoxSize - Box size drawn on each levels, indicate buffers around levels. Default value 1pips (10point) above and below each levels. ZoneSize - Distance between each levels, default value 10pips (100point). Style & Colours - User inputs customization.
For MT5 version, please re
FREE

多货币和多时间范围指标 Inside Bar (IB)。 在参数中,您可以指定任何所需的货币和时间范围。 该面板显示最后找到的内部柱线(和母柱线)形态、当前价格位置以及母线和内部柱线水平的突破。 您可以设置单元格中的条形和文本的大小和颜色。 当水平被突破时,该指标还可以发送通知。 通过单击带有句点的单元格,将打开指定的交易品种和句点。 这是 MTF 扫描仪。
默认情况下,从图表中隐藏仪表板的键是“D”.
参数 How long pattern will be valid after first breakout (bars) — 信号将在单元格中显示多少柱 IB body must be inside of the MB body - IB 主体必须位于 MB 主体内部。 IB body and wicks must be inside the MB body - IB 主体和灯芯必须位于 MB 主体内。 If MB is IB, choose the next MB — 如果找到的母柱是前一个信号的内柱,则将显示前一个信号。 MB body must be large tha

CandleStick Countdown – 蜡烛剩余时间显示指标 CandleStick Countdown 是一款简单实用的 MT4 指标,能够实时倒计时当前蜡烛剩余的分钟和秒数,帮助提升交易时机的准确性,深受众多交易者欢迎。 主要功能 以“分:秒”格式显示当前蜡烛剩余时间 以文本形式显示在图表上,具有高可视性 显示位置自动调整,靠近当前价格,便于观察 支持自定义字体大小和文字颜色 兼容所有时间周期(从M1到MN) 使用亮点 一目了然蜡烛收盘时间,有助于进出场判断 非常适合短线交易者和剥头皮交易者,时间把控至关重要 提升交易精度,帮助避免过早进出场 参数设置 参数名称 说明 默认值 LabelColor 显示文本颜色 黄色 FontSize 文本字体大小 12 使用方法 只需将指标加载到MT4图表上,即可自动显示当前蜡烛剩余时间。LabelColor和FontSize可根据喜好调整。 注意事项 本指标仅用于信息显示,不包含自动交易或交易信号功能。 若在多个图表中使用,请分别加载至各图表。 若未显示倒计时,请尝试刷新图表或重启MT4。 本指标由 TOKYO-EA 开发并提供。欲获取
FREE

Bitcoin 999 - is a trend indicator that automatically analyzes the market and provides information about the trend and each of its changes, as well as giving signals for entering trades without redrawing! The indicator uses each candle, analyzing them separately. referring to different impulses - up or down impulse. Exact entry points into transactions for currencies, crypto, metals, stocks, indices!
Main functions: Accurate entry signals WITHOUT REPAINTING! Once a signal appears, it remains
FREE

通过 Consecutive Candle Indicator MT4 增强您的趋势识别能力,这是一款动态工具,旨在识别连续的看涨或看跌K线序列,为外汇、股票、加密货币和商品市场提供及时的趋势确认和潜在反转警报。在 Forex Factory 和 Reddit 的 r/Forex 等交易社区中备受推崇,并在 Investopedia 和 TradingView 的讨论中因其简化动能分析的能力而受到赞扬,该指标是寻求在波动市场中获得清晰信号的交易者的首选。用户报告称,使用较高的K线计数(例如,3-5根连续K线)时,检测持续趋势的准确率高达80%,许多人指出通过避免过早入场并专注于确认的动能变化,交易时机提高了15-25%。其优势包括精确识别趋势强度、可定制的警报实现免手动监控,以及用户友好的设计,无需额外工具即可增强剥头皮、日内交易和波段交易者的决策能力。 Consecutive Candle Indicator MT4 在用户定义的连续看涨K线数量(默认 N_CANDLE=3)后跟一根看跌K线后,在K线下方绘制绿色向上箭头(BuyBuffer),提示潜在的趋势耗尽或反转;在连续看跌K线
FREE

MT4 的 R 2EMA 颜色指标基于 2 个 EMA 的交叉提供可靠的交易信号。
关键点 当价格交叉并收于两条绿色 EMA 上方时,它会产生买入交易信号。 当价格交叉并收于两条红色 EMA 上方时,它会产生卖出交易信号。 R 2EMA Color Forex 指标使确定何时买卖变得更加容易
当 2 条 EMA 线变为绿色时,出现买入信号。 当 2 条 EMA 线变为红色时,出现卖出信号。 如何与之交易? 一旦两条 EMA 信号线从红色变为绿色,就开始买入交易,现在趋势是积极的。 一旦两条 EMA 信号线从绿色变为红色,就开始卖出交易,现在趋势是负面的。 当图表上出现相反的交易信号时退出交易。
随意使用您自己喜欢的交易方法通过 R 2EMA 颜色指标打开和关闭交易。
规格 交易平台:Metatrader 4 (MT4)
货币对:适用于任何货币对
时间范围:适用于任何时间范围
输入参数:快、慢、模式、价格、信号条、警报消息、警报声音、警报电子邮件、警报移动、颜色设置和样式
指标类型:价格行为
FREE
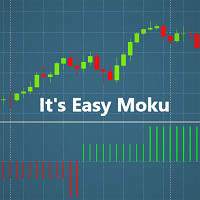
Introduction:
Welcome dear Users, This indicator has been developed in order to help traders who are daily struggling to find a strategy . I have always been acctracted by Ichimoku Strategy, however took me sometime figure out how it does work. Easy Moku makes Ichimoku Simple!
Aspect:
Easy Moku shows 2 principal ICHIMOKU signals: kijun sen/tenken sen sen crossover Span A Span B + Kijun sen/tenken sen Get Rid of all the Ichimoku Lines!
On the Mt4 Chart the Easy Moku paints an Histogram: (
FREE

The Grand Signal indicator is a unique tool that not only provides an understanding of market behavior but also precisely identifies trend entry points after intraday correction limits, with accuracy down to a five-minute candlestick! It includes individual settings for each currency pair. After purchasing, be sure to message me directly for instructions! Telegram: @Lapinsania or here in the Market! I
The indicator calculates reversal points based on the past trend and forms a channel (outer) on this basis. This elapsed time span from which the reversal points are determined can be specified in the settings.
An inner channel is also drawn in white. The trend continues in this channel, if there is a sideways trend. Here the upper / lower line form the possible turning point.
The indicator is suitable for all trading areas, whether forex, crypto, metals, indices or futures. All areas traded

DBD AND RBR CANDLESTICK PATTERN: This indicator based on the concept of two candlestick patterns. DROP BASE DROP (DBD) is a buy candlestick pattern and RALLY BASE RALLY (RBR) is a sell candlestick signal pattern. The arrows indicate potential signal setup for long trade and short trade. This indicator includes pop-up alert, push to phone and send to email alert which can be enabled and disabled. The color and size for DBD and RBR can be changed.

This indicator analyzes the ranges in the selected LookBack Bars and shows the relative strength of the price movement with the Level percentage you set. The blue line indicates that the current price movement is strong, and the yellow line indicates that we are in a flat price movement. The blue line does not determine whether the price action is up or down, it just shows relative strength. Therefore, as seen in the picture, direction can be determined with a simple zigzag indicator on the main

Use with disciplined risk management. Fibonacci entry system based on the golden zone 38.2 - 61.8 where the entry is confirmed at 23.6 with indications of Take Profit 3:1. Automatically plotted Fibonacci contains retracement and expansion Fibonacci in a single indicator. Up to 77% win rate with this system. FTMO challenge pass with 0.50% risk and 1.50% R:R.
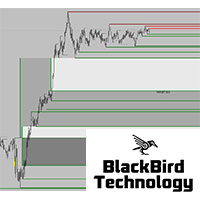
Dear Traders, check out my new multi level market liquidity indicator : https://www.mql5.com/en/market/product/73098
Many of you have been trading very good with this indicator, thanks for the support and positive feedbacks ! For more information about market liquidity, a manual on how to use this indicator please send me a message. A lot of information can be found on the net. (search liquidity trading/ inner circle trader)
https://www.youtube.com/watch?v=yUpDZCbNBRI
https://www.youtube.com/

Introducing a powerful, precision-engineered indicator that seamlessly combines Pivot Points, Moving Averages, and Multi-Timeframe Analysis to deliver high-probability Buy and Sell signals in real-time. This tool is your strategic edge, designed to identify trend reversals, market momentum, and optimal trade entries, no matter your preferred trading style.
Our algorithm goes beyond standard indicators—by analyzing multiple timeframes simultaneously, it spots true market turning points while fi
This Indicator only places quality trades when the market is really in your favor with a clear break and retest. Patience is key with this price action strategy!
If you want more alert signals per day, you increase the number next to the parameter called: Support & Resistance Sensitivity. After many months of hard work and dedication, we are extremely proud to present you our Break and Retest price action indicator created from scratch. One of the most complex indicators that we made with over

This outside bar indicator is the opposite of the inside bar. So what this MT4 outside bar indicator does is identifies outside bars for you as they form on your charts. Outside bar is a famous trading pattern in which the bar carry higher high and lower low compared with the previous bar, also known as mother bar. To trade based on Outside Bars, simply place buy stop order above the high price level of a bullish Outside Bar, and sell stop order should be placed below the low price level of a be
FREE
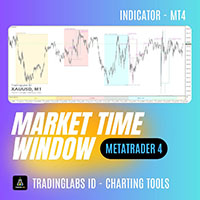
ICT Market Time Cycle – Complete Session & Time Window ICT Market Time Cycle is a professional trading indicator designed to help traders follow the ICT (Inner Circle Trader) methodology with ease.
It automatically displays the main market sessions (Asia, London, and New York), along with Killzones, Silver Bullet windows, and Macro times directly on your chart. With this tool, you no longer need to calculate session times manually – everything is plotted automatically in a clean and professional
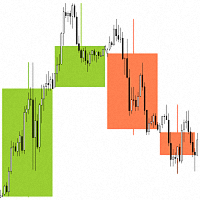
"Candlesticks MTF 4" is an information indicator that displays "Japanese Candlesticks" . The indicator analyzes and determines the opening and closing times of candles from higher time frames.
An algorithm has been developed for the "Candlesticks MTF 4" indicator that corrects the discrepancy between the opening and closing times of candles from higher time frames. For example, if the opening time of a candle on a weekly time frame is the 1st of the month, and on the smaller time frame this da
FREE

The statistical indicator for the metatrader 5 TradingStatisticPro collects statistical data on your trade, which makes it easier to assess the effectiveness of trading, the profit received and the risks. The indicator is compactly placed in the corner of the main chart of the terminal and displays the following information: 1. The profit earned. 2. Maximum drawdown. 3. The recovery factor. 4. Profit factor. 5. The ratio of profitable and unprofitable transactions (winrate). 6. Average profit a
FREE

The Chart High Low Indicator is an indicator for META TRADER 4, with the function of analyzing and showing the weekly MAXIMUM, weekly MINIMUM, monthly MAXIMUM and monthly MINIMUM levels.
This can help a lot when creating TrendLine or even plotting your FIBONNACI line, as there is no need to access Internet sites to analyze the MAXIMUM/MINIMUM levels. In graphical analysis, it can assist in breaking HIGH/MIN levels, creating support and resistance breakOuts. There are "mark" functions on the in
FREE

When prices breakout resistance levels are combined with Larry Williams' Percentage Range "WPR" oscillator breaks out its historical resistance levels then probability emerges to record farther prices. It's strongly encouraged to confirm price breakout with oscillator breakout since they have comparable effects to price breaking support and resistance levels; surely, short trades will have the same perception. Concept is based on find swing levels which based on number of bars by each side
FREE

磁性价格发现指标,即价格倾向于回归的平均价格。 针对XAUUSD H1优化。它有3条线,中间线是需要重点关注的价格。 根据历史数据,在默认设置下,价格回归到平均价格的成功率超过92%;在其他情况下,默认设置的止损会被触发。 入场点和入场时间大致在新的一天开始时,为方便起见,新一天的第一根K线会根据其开盘价是低于还是高于磁力线而用箭头标记。 该指标适用于日内单次入场的交易策略,重点关注价格回归,也适用于网格策略。 可用设置: Candles:用于精细调整的K线数量。建议使用12-24-48的值或保持默认设置。 ATR设置:用于根据您的策略精细调整止损。 ShowLabels:显示线条右侧的标记文本。 LabelOffsetBars:文本缩进。 ArrowOffset_Multiplier:箭头缩进。
FREE

Round Numbers Levels indicator for MT4 Round Numbers indicator is a simple but useful indicator to draw 00 and 50 price levels in your chart.
These levels act as supports and resistances, and therefore should be taken into account when trading.
These levels can be used as profit targets or entry points.
Inputs of the indicator are:
TGridColor00: color to be used for xx00 levels GridStyle00: line style to be used for xx00 levels GridWidth00: line width to be used for xx00 levels GridColor50:
FREE

产品标题 Smart ADX (MT4) – SmartView 系列的一部分 简短描述 具有独特用户体验的 ADX 指标,在 MetaTrader 平台上提供。提供以前不可用的高级功能,例如双击打开设置、隐藏和显示指标而无需删除它们,以及以全图表大小显示指标窗口。设计用于与 SmartView 指标系列的其余部分无缝协作。 概述 SmartView 系列通过创新功能为 MetaTrader 平台上的指标提供独特且与众不同的用户体验,使指标管理更快、更轻松。每个指标都配备了图表上的智能控制面板,显示基本信息并提供对所有重要功能的快速访问。 以前不可用的独特功能 SmartView 系列提供使指标工作更简单、更快速的高级功能: 双击打开设置: 无需在指标列表中搜索,双击面板上的指标名称即可直接打开设置窗口。 隐藏和显示指标: 一键隐藏和显示指标,无需从指标列表中删除和重新添加它们。 以全图表大小显示指标窗口: 在子窗口中,您可以最大化指标窗口以全图表大小显示,并临时隐藏其他窗口。 折叠和展开子窗口: 折叠子窗口以减少其高度并节省屏幕空间,然后在需要时将其展开回全尺寸。 重新排列子窗口:
FREE

Chart Patterns Detect 15 patterns (Ascending Triangle, Descending Triangle, Rising Wedge, Falling Wedge, Bullish Flag, Bearish Flag, Bullish Rectangle, Bearish Rectangle Symmetrical triangle, Head and Shoulders, Inverted Head and Shoulders, Triple top, Triple Bottom, Double Top, Double Bottom) Use historical data to calculate the probability of each pattern to succeed (possibility to filter notification according to the chance of success) gives graphic indication about the invalidation level and

The Smart Liquidity Profile is color-coded based on the importance of the traded activity at specific price levels, allowing traders to identify significant price levels such as support and resistance levels, supply and demand zones, liquidity gaps, consolidation zones, Buy-Side/Sell-Side Liquidity and so on. Smart Liquidity Profile allows users to choose from a number of different time periods including 'Auto,' 'Fixed Range,' 'Swing High,' 'Swing Low,' 'Session,' 'Day,' 'Week,' 'Month,' 'Quar

Dark Oscillator is an Indicator for intraday trading. This Indicator is based on Counter Trend strategy, trying to intercept changes in direction, in advance compared trend following indicators. We can enter in good price with this Indicator, in order to follow the inversion of the trend on the current instrument. It is advised to use low spread ECN brokers. This Indicator does Not repaint and N ot lag . Recommended timeframes are M5, M15 and H1. Recommended working pairs: All. I nst

The Donchian channel is an indicator that takes a series of user-defined periods and calculates the upper and lower bands. Draw two lines on the graph according to the Donchian channel formula. This straightforward formula is based on:
The top line is the highest price for the last periods n The bottom line is the lowest price for the last periods n
Trend systems follow periods when support and resistance levels are broken. in this case when the price breaks the upper line or the lower line o
FREE

Lord Auto Fibonnaci is a free indicator for Meta Trader, in order to show the most famous chart in the financial market known as "Fibonnaci".
As we can see in the images below, the fibonnaci table will automatically analyze the graph for you, with trend factors through percentage, almost infallible use, you can always work when the percentage is low or high, start shopping and sales on time, great for analyzing entries!
In the images below we can see an example in gold in H4, where we are at
FREE

Market Time Watch 一款轻量、简洁且对每位交易者都至关重要的时间显示工具 Market Time Watch 是一款专业的图表时间显示工具,为需要精确本地时间、服务器时间和当前 K 线倒计时的交易者设计。 该工具可以在图表上直接显示 本地时间 、 服务器时间 和 K线倒计时 , 无需复杂界面或多余元素。 无论您是剥头皮交易、波段交易、新闻交易,或只是需要一个简洁清晰的时间参考, Market Time Watch 都能以最简约、最优雅的方式呈现所有关键信息。 为什么交易者喜欢 Market Time Watch 超轻量级 ,适用于所有 MT4/MT5 环境 不重绘图表 ,不干扰 EA 或指标 零延迟 、零负载、几乎不占用 CPU 完美适配剥头皮、日内交易、消息面交易以及指数 (US30, NAS100, Gold, Forex) 专业视觉设计,适用于任何图表主题 主要功能 实时时钟 在图表上清晰显示当前时间(本地或服务器)。 K 线倒计时 显示当前 K 线剩余时间,特别适合剥头皮和新闻交易者。 现代信息面板 精美弹出面板包含: 所有 TesterM
FREE

该指标是TradingView平台"Duyck"开发的"ATR Based Trendlines - JD"指标的MetaTrader 4移植版本。 本指标通过自动持续绘制趋势线运作,其独特之处在于不仅基于价格,还结合ATR反映的波动率。因此趋势线的角度由ATR(的特定百分比)决定。 趋势线角度会跟随价格变化,这种变化由发现枢轴点时的ATR值决定。ATR百分比参数控制趋势线是跟随ATR变化率(100%),还是其分数(<100%)或倍数(>100%)。 输入参数
回溯深度:设定检测枢轴点时需要检查的K线数量
ATR目标百分比:调整趋势线方向上ATR影响的敏感度
依据影线/实体绘制:选择枢轴点和ATR计算使用K线实体还是影线
选择趋势线方向:看涨/看跌/双向
显示全部趋势线开关
最大趋势线数量(当"显示全部趋势线"关闭时)
上升趋势线颜色设置
下降趋势线颜色设置
接收图表提醒
接收应用通知
交易策略指南:
本交易策略结合了我开发的两个指标来确认交易信号——"RC ATR Based Trendlines"和"RC ATR Volatility Hedge Zones"。核心原则是必须两个指
FREE
MetaTrader市场是您可以下载免费模拟自动交易,用历史数据进行测试和优化的唯一商店。
阅读应用程序的概述和其他客户的评论,直接下载程序到您的程序端并且在购买之前测试一个自动交易。只有在MetaTrader市场可以完全免费测试应用程序。
您错过了交易机会:
- 免费交易应用程序
- 8,000+信号可供复制
- 探索金融市场的经济新闻
注册
登录