 MetaTrader 5
 专家
专家
 指标
指标
 程序库
程序库
 实用工具
实用工具
 窗口小部件
窗口小部件
 规则
规则
适用于MetaTrader 4的技术指标 - 169
 下面列出的技术指标信号对MetaTrader 4平台的开仓交易和平仓交易起着至关重要的作用。
指标的本质就是一种交易品种的数学转换,旨在预测价格变化。
下面列出的技术指标信号对MetaTrader 4平台的开仓交易和平仓交易起着至关重要的作用。
指标的本质就是一种交易品种的数学转换,旨在预测价格变化。 
Gold Session Trap Distance Map Gold Session Trap Distance Map is a clean intraday liquidity-mapping indicator designed for XAUUSD traders who want to track where price still has unfinished business from major trading sessions. Instead of filling the chart with random support and resistance, this indicator focuses on one simple idea: unbroken session trap zones can act like future liquidity magnets. The indicator tracks key session trap areas from the major trading periods and displays live dista

Overview EMA Cross Pullback Pro is a professional non-repaint trend-following indicator designed for traders who use EMA crossovers and pullback entries. It combines fast and slow EMA analysis with reversal confirmation to identify high-probability trading opportunities. The indicator automatically detects: EMA Cross BUY and SELL signals Pullback/Reversal confirmation Trend direction Profit/Loss statistics Monthly performance summary Historical signal analysis from a user-defined start date Buil

QB Schumann Market Resonance MT4 QB Schumann Market Resonance MT4 is an advanced market rhythm indicator inspired by the concept of resonance and market pressure analysis. Instead of relying on traditional lagging indicators, it evaluates the balance between bullish and bearish pressure using candle structure, volatility, momentum, and tick activity to identify potential turning points and directional strength. The indicator displays an intuitive dashboard with live Bull Pressure, Bear Pressure,

The indicator MTF Sidebar is part of the of the Shved Market Analysis System (SMAS). Collects and synchronizes multi-timeframe market data, providing a comprehensive overview as part of the integrated SMAS ecosystem.
About the Creator and Algorithm Uniqueness: This indicator was designed and developed by the original creator of the very first, now classic, Shved Supply and Demand indicator, which has earned the trust of thousands of traders worldwide. The current MTF Sidebar for MT4 is the

Crypto_Forex 指标“RSI 和 2 条移动平均线”适用于 MT4,无需重绘。 - 此指标非常适合动量交易系统。 - “RSI 和 2 条移动平均线”指标允许您查看 RSI 本身的快速和慢速移动平均线。 - 指标让您有机会尽早发现趋势变化。 - “RSI 和 2 条移动平均线”可用于从超买/超卖区域捕捉趋势方向的动量。 - 此指标可通过参数轻松设置。 - 指标适用于任何时间范围。 PC/Mobile alerts! ............................................................................. Click here to see high quality Trading Robots and Indicators! 此为原创产品,仅在 MQL5 网站上提供。

MT4 加密货币外汇鳄鱼线高位时间框架指标。 - 鳄鱼线指标是最强大的趋势指标之一。HTF 表示“高位时间框架”。 - 该指标非常适合趋势交易者,也可与价格行动入场相结合。 - HTF 鳄鱼线指标允许您将高位时间框架的鳄鱼线附加到当前图表。 - 仅当绿线高于红线且红线高于蓝线时才考虑买入入场 - 在图表上最新波动幅度的最大值处设置买入止损挂单。 - 仅当绿线低于红线且红线低于蓝线时才考虑卖出入场 - 在图表上最新波动幅度的最小值处设置卖出止损挂单。 - HTF 鳄鱼线指标提供低风险获取高额利润的机会。 Click here to see high quality Trading Robots and Indicators! 本产品为原创产品,仅在本 MQL5 网站提供。

Borders Arrow Signals MT4 The Ultimate Non-Repainting Smart Arrow Trading Indicator Borders Arrow Signals MT4 is a professional-grade MetaTrader 4 indicator designed for traders who demand precision, reliability, and high-probability trade entries. Built for the MT4 trading platform, it delivers intelligent Buy and Sell signals based on advanced market analysis while maintaining exceptional speed and efficiency. Unlike conventional arrow indicators that repaint historical signals and create fals

Crypto_Forex MT4 版“双锤形态”指标,无需重绘,无延迟。 ...................................................................... - “双锤形态”指标是一款非常强大的价格行为交易指标。 - 指标可检测罕见但有效的形态:图表上出现看涨双锤形态。 - 看涨双锤形态 - 图表上出现蓝色箭头信号(见图)。 - 内置电脑和手机端提醒。 - “双锤形态”指标非常适合与支撑/阻力位结合使用。 ............................................................................. Click here to see high quality Trading Robots and Indicators! 这是仅在 MQL5 网站上提供的原创产品。

Volume Profile ASA Professional Volume Profile Indicator for MetaTrader 4 Volume Profile ASA is a modern professional Volume Profile indicator designed for traders who make trading decisions based on real market activity rather than price movement alone. The indicator builds a Volume Profile directly on the chart, displaying the distribution of trading volume across price levels and helping traders quickly identify the most important market areas. Volume Profile ASA automatically calculates and

Gold Fuel is a professional MT4 chart-mapping indicator designed for traders who study price-leg movement, candle structure, reaction zones, and 161.8 completion targets. The indicator uses a selected market leg as the active structure, then automatically projects the working direction and displays the relevant zone and target map. It shows only the active directional zone, helping keep the chart clean and focused. When the selected leg projects downward, the indicator displays the active sell

版本 2 新功能: - 图表控制面板:所有功能一键切换,面板可拖动到图表任意位置,位置自动保存 - 每周期蜡烛数量:日线、周线、月线、年线可独立显示 1..N 根蜡烛( 1= 当前, 2= 当前 + 上一根,以此类推) - 新配色方案:每个周期一种颜色 —— 看涨蜡烛用浅色调,看跌蜡烛用同色深色调 - 图表调色板:一键更改任意周期的颜色,无需打开设置窗口 - 每周期 FILL 按钮:强实体填充,方向由透明度区分(看涨 60% 透明,看跌 40% 透明) - 可直接在面板上调整标签字体大小 - CANDLES 按钮:隐藏 / 显示图表自身的价格蜡烛;原图表模式始终会恢复 - 像素级精确对齐:大蜡烛现在精确贴合其图表 K 线(修复周末 / 交易时段间隙造成的偏移) - 所有面板设置(状态、数量、颜色、位置)在切换时间周期和重启终端后保留

Crypto_Forex 指标“DeMarker 带动态超卖/超买区域”适用于 MT4。无需重绘。 - DeMarker 振荡器曲线指示指标计算期间当前价格相对于先前高点和低点的位置。 - 从动态超买区域卖出和从动态超卖区域买入都很棒。 - 此指标也非常适合与价格行动条目结合使用。 - 动态超买区域 - 黄线上方。 - 动态超卖区域 - 绿线下方。 - DeMarker 本身提供了其他振荡器中最有效的常规发散信号。 - 带有 PC 和移动警报。 ............................................................................. Click here to see high quality Trading Robots and Indicators! 这是仅在此 MQL5 网站上提供的原创产品。

Crypto_Forex MT4 指标 Heiken Ashi Histo Filter - 是一款出色高效的辅助交易工具!无需重绘! .................................................................................................................. - 采用先进的全新计算方法 - “计算价格”参数提供 10 个选项。 - 非常适合与价格行为模式结合使用: - 绿色直方图 - 寻找看涨形态进行买入。 - 洋红色直方图 - 寻找看跌形态进行卖出。 - 使用此指标,即使是标准策略也能获得大量升级机会。 - 指标内置移动端、PC 端和邮件提醒。 ............................................................................. Click here to see high quality Trading Robots and Indicators! 这是仅在 MQL5 网站上提供的原创产品。

Part of the Shved Market Analysis System (SMAS).
Identifies areas of maximum Supply and Demand zone density and confluence, providing deeper market insight as part of the integrated SMAS ecosystem.
Shved Supply and Demand Cluster Profile is a revolutionary, high-performance visualization tool designed to map market volume density and supply/demand zone clusters, created by a professional trader for traders.
The Shved Supply and Demand Cluster Profile is a core component and the analytical h

Divergence Matrix Pro for MetaTrader 4 Divergence Matrix Pro is a confirmed multi-oscillator divergence indicator for MetaTrader 4. It detects regular and hidden divergence between price and selected oscillators, then presents the confirmed structure through divergence lines, pivot labels, action markers, an optional current-timeframe Matrix Panel and optional alerts. The indicator is an analysis and confirmation tool. It does not open or close trades, and the signal score is not a win rate or a

Read detailed blogpost here: https://www.mql5.com/en/blogs/post/772233
Features at a Glance Linear regression center line with statistically accurate curved deviation bands Three band calculation modes: RMA of High-Low Range, Standard Deviation, and True ATR Candle coloring in two modes: Heatmap (position inside the bands) and Volume-Weighted Colored Bars (VWCB) Straight regression channel (Channel 1) with up to 3 deviation levels Future projection channel (Channel 2) with optional Higher Timef

Gold Swing Break Target Map is a MetaTrader 4 indicator designed to display projected target levels after a confirmed swing high or swing low is broken. The indicator is intended to help traders answer a common chart question: If price breaks this swing high, where could it continue upward? If price breaks this swing low, where could it continue downward? The tool does not open, close, or manage trades. It is designed for chart analysis and discretionary trading decisions. Main Purpose Gold Swin

概述 Candle Timer Countdown Pro for MT4 是一款用于 MetaTrader 4 的K线收盘倒计时指标。它可以在图表上显示当前K线距离收盘还剩多少时间,并配合圆形进度弧,让交易者一眼就能判断当前K线所处的时间阶段。 相比普通倒计时指标只在新 tick 到来时刷新,本指标使用服务器时间锚定与本地时钟插值方式,在 tick 稀少时仍能保持稳定倒计时显示,减少冻结、跳动和时间漂移问题。 无论您是在 M1 图上进行短线交易,还是在 H1、H4、D1 图上观察趋势和K线形态,准确知道当前K线何时收盘,都有助于更好地把握入场时机、确认收盘形态,并避免过早做出交易判断。 为什么本计时器与众不同 很多 MT4 倒计时指标主要依赖 TimeCurrent() 。在 MetaTrader 4 中,服务器时间通常随市场报价更新;当市场波动较低、报价间隔变长,或者当前品种暂时没有新 tick 时,普通倒计时容易出现短暂停顿,然后突然跳动。 本指标通过在新 tick 到达时锚定服务器时间,并在两次 tick 之间使用本地时钟进行时间插值,使倒计时显示更加平滑、稳定。配合圆形进度弧

Hull Suite — Responsive Trend Engine for MT4 (figure 1) Overview **Hull Suite** brings the famous **Hull Moving Average** — created by Alan Hull in 2005 — to MetaTrader 5 in a single, flexible, ready-to-trade package. The Hull Moving Average is prized for one reason: it is **extremely responsive yet remarkably smooth**. It hugs price closely, cuts lag to a minimum, and still delivers clean, readable curves — exactly what a discretionary or systematic trader needs to read trend direction at a gl

Indo Scalper Multi TF Multi Pair Indo Scalper Multi TF Multi Pair is a powerful trading indicator designed to help traders identify trend direction and high-probability entry opportunities using Multi-Timeframe (MTF) confirmation . Built for multiple currency pairs, it is ideal for both scalping and intraday trading. Features Multi-Timeframe (MTF) Trend Confirmation Supports Multiple Currency Pairs Helps Identify Trend and Market Momentum Suitable for Scalping & Intraday Trading Clean,

OSB Pro 震荡指标 - 是一款高级自定义指标,高效的价格行为辅助工具。 - 采用先进的全新计算方法。 - 新一代震荡指标 - 参见图片了解如何使用。 - OSB Pro 震荡指标是一款辅助工具,用于精准定位价格行为和超卖/超买趋势信号的入场点。 - 超卖值:低于 30。 - 超买值:高于 70。 - 使用此指标,即使是标准策略,也能获得大量升级机会。 - 它比标准震荡指标更快、更精准。 - 指标具有信息显示功能 - 显示当前外汇对的点差和隔夜利息。 - 信息显示还显示账户余额、净值和保证金。 - 信息显示可放置在图表的任意位置 . 使用方法: - 用作价格行为过滤器(见图)。 - 用于进入主要趋势方向的入场信号(见图)。 Click here to see high quality Trading Robots and Indicators! 本产品为独家产品,仅在本 MQL5 网站上提供。

适用于MT4平台的加密货币外汇指标“流星形态”,无重绘,无延迟。 ............................................................................... - “流星形态”指标是一款非常强大的价格行为交易指标。 - 该指标可检测图表上的看跌流星形态:图表上的红色箭头信号(见图)。 - 支持电脑、手机和邮件提醒。 - “流星形态”指标非常适合与支撑/阻力位结合使用。 - 在下跌趋势或横盘整理的市场行情中,使用此指标效果极佳! Click here to see high quality Trading Robots and Indicators! 本产品为MQL5官方网站独家销售的原创产品。

Ultimate AIO ICT Concept Indicator for MT4:自动掌握 Smart Money Concepts 您是否厌倦了每天花费数小时手动绘制图表?AIO ICT Concept 指标是您掌握 Smart Money Concepts 的一体化完整解决方案。这款强大的算法工具旨在消除手动技术分析的猜测和情绪疲劳,自动在您的图表上绘制出最关键的价格行为元素。 掌握市场方向和高级时间框架偏见 (High Timeframe Bias): 知道市场走向就成功了一半。借助我们先进的 Market Structure 映射和 Change in State of Delivery (CISD) 检测,您可以立即识别真实的市场趋势。一目了然地轻松确定您的每日和每周方向偏见。对于波段交易者和日内交易者来说,该指标在 H4、H1 和 M15 时间框架上绝对是游戏规则的改变者。它帮助您建立高度准确的 ICT 叙事并预测未来的价格行为,而无需您自己费力地绘制线条和区域。 在较低时间框架上进行精准的盘口解读 (Tape Reading): 到了执行的时候,AIO ICT Con

The Ultimate Market Structure Indicator: Essential Tape Reading Tool for All Traders (终极市场结构指标:所有交易者的必备盘口解读工具) 停止猜测市场方向,开始以绝对清晰的思路进行交易。 Market Structure Indicator 是一款专业级的图表工具,经过精心设计,可精准绘制出您 MetaTrader 图表上价格行为的真实节奏。 虽然该工具采用了由 Smart Money Concepts (SMC) 和 Inner Circle Trader (ICT) 方法论普及的术语,但 该指标并非专为 SMC 或 ICT 交易者设计。 市场结构是金融市场的通用语言。无论您是经典的 price action 交易者、波段交易者还是剥头皮交易者,掌握 盘口解读 (tape reading) 都需要对结构性高点和低点有深入的理解。该指标充当您的自动化盘口解读助手,让您无需面对杂乱的图表,即可瞬间可视化机构足迹、流动性池和实时订单流动态。 如果您想像专业人士一样解读市场,准确了解市场在何处打破结构、扫荡流

Pattern Builder — MetaTrader 4 自定义摆动形态扫描器 Pattern Builder 是一款 MetaTrader 4 指标和市场扫描工具,允许交易者手动绘制任意自定义摆动形态(swing pattern),并在市场观察窗口的所有品种、多个时间周期上实时扫描相似的价格形态。与仅支持头肩形、三角形、旗形等固定形态的传统图表形态指标不同,这款 MT4 形态识别工具让您自行定义价格行为形态——任意数量的摆动点、任意形状——并通过包含 11 项加权指标的相似度引擎(含动态时间规整 DTW 与普氏分析 Procrustes)实时查找匹配设置。 主要功能: 交互式形态绘图板,基于 XY 网格,可像素级精确放置摆动点 多指标相似度引擎:几何形状、角度序列、斜率、回撤比例、扩展比例、摆动数量比、宽高比、趋势方向、结构顺序与波段振幅顺序 可选启用动态时间规整(DTW)与普氏分析,实现与尺寸、方向无关的形态匹配 当日最高价/最低价(HOD/LOD)点验证,精确过滤交易设置 异步市场扫描——可在 M5 至 D1 多个周期扫描数百个品种而不卡顿终端 可排序、分页的结果表,显示相似

Quantum Trend Ribbon Quantum Trend Ribbon is a premium trend-following indicator designed to help traders identify market direction with confidence. By combining an adaptive moving average with a dynamic trend ribbon, it filters out market noise and highlights the dominant trend, allowing you to focus on high-probability trading opportunities. The clean and intuitive interface makes it easy to understand market conditions at a glance without cluttering your chart. Key Features Adaptive Trend De

BALOGUN SMC ELITE — Professional Smart Money Concepts Indicator
KEY FEATURES: Strict BUY/SELL Alternation — Only 1 BUY followed by 1 SELL (no signal spam) Non-Repainting Signals — Signals confirmed on closed bars only Zone-Limited NO TRADE Markers — Clear visual zones showing when NOT to trade Multi-Factor Confluence Scoring — 0-100% quality score per setup Professional Dashboard — Real-time trend, confluence, and signal status Multi-Channel Alerts — Popup, Push, Email, and S

Crypto_Forex 指标“CCI 平缓探测器”是一款高效的交易辅助工具!无需重绘。 我推荐您使用这款适用于 MT4 的出色指标来升级您的交易方法。 - 指标在图表上显示价格平缓区域。它具有“平缓敏感度”参数,用于平缓检测。 - “CCI 平缓探测器”可用于价格行动入场确认,或与其他指标结合使用。 - 您可以将其用于趋势跟踪系统,以检测平缓区域并避免在该区域交易。 - 您可以将其用于反转剥头皮交易 - 从平缓边界进行反转交易。 - 有很多机会可以使用“CCI 平缓探测器”替代标准 CCI 震荡指标。 - 商品通道指数 (CCI) 衡量当前价格与历史平均价格之间的差异。 - 非常适合在 +200 以上区域进行卖出入场,在 -200 以下区域进行买入入场。 Click here to see high quality Trading Robots and Indicators! 这是仅在 MQL5 网站上提供的原创产品。

Crypto_Forex 指标“MA Speed”适用于 MT4,无需重绘。 移动平均线速度 - 是一种独特的趋势指标。 - 该指标的计算基于物理方程。 - 速度是移动平均线的一阶导数。 - MA 速度指标显示 MA 本身改变方向的速度。 - 有很多机会使用 MA Speed 升级标准策略。适用于 SMA、EMA、SMMA 和 LWMA。 - 建议在趋势策略中使用 MA Speed,如果指标值 < 0:趋势下降;如果指标值 > 0:趋势上升。 - 时间范围 - 任意;交易对 - 任意。 - 指标具有内置移动和 PC 警报。 参数(设置非常简单): 1) 速度周期。建议值为 3 到 7。速度周期较低时,指标的灵敏度增加,反之亦然。 2) MA 周期(将计算此 MA 的速度)。 3) MA 方法:SMA、EMA、SMMA、LWMA。 4) MA 应用价格(7 个选项)。 点击这里查看高质量的交易机器人和指标! 这是仅在此 MQL5 网站上提供的原创产品。
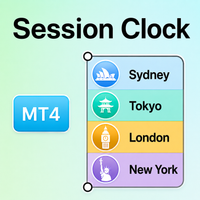
Session Clock MT4 Know Which Forex Session Is Active – Without Manual Time Calculations Session Clock MT4 is a clean trading-time dashboard for MetaTrader 4. It displays the four major Forex market sessions – Sydney, Tokyo, London, and New York – together with their opening times, closing times, live status, and the countdown to the next session. Forex market activity changes throughout the day. Some periods are quiet, while others bring faster price movement and higher volatility. Session Clock

Smart Moves Binary Indicator for MT4 Overview Smart Moves Binary Indicator is a technical analysis indicator for MetaTrader 4 (MT4) designed to help traders identify potential BUY and SELL opportunities after candle confirmation. Signals are generated only after the current candle has closed, ensuring that confirmed arrows remain fixed on historical bars without recalculation. The indicator is suitable for any Forex currency pair and supports multiple timeframes, making it adaptable to differen

多周期锚定VWAP指标(自定义周期与标准差通道)技术说明 概述
本指标在传统VWAP(成交量加权平均价)基础上扩展了多周期锚定、会话重置及标准差通道功能,为用户提供动态的“公允价值”参考区域。指标计算基于当前可见价格与成交量数据,不包含未来函数,不重绘,不漂移。 核心功能特性 多时间框架锚定 支持自动附加更高时间周期的VWAP(如H4以上→月线,H1→周线,M30以下→日线),亦允许手动指定任意周期(MN1、W1、D1、H4等)。 自定义基础周期 提供手动选择计算周期的开关,用户可自由设定。 会话多重置点 支持输入多个每日重置时间点(如 00:00,08:00,16:00 ),使VWAP在指定时刻重新计算,以匹配不同交易时段。 三重标准差通道 基于实际成交量加权计算标准差,生成±1σ、±2σ、±3σ共六条对称通道线。各层标准差倍数可独立调整(默认1、2、3)。 显示范围控制 可设定显示的历史周期数量(如最近10个交易日/会话),聚焦近期数据。 周期自动断开 每个周期(或会话)结束时线条自动断开,不产生跨周期连线。 自定义每日起始时间 允许设置任意“开盘时间”(如09:30、00:0

这个代码是一个为 MetaTrader 4 (MQL4) 编写的 Smart Money Concepts (SMC) 智能货币概念交易引擎与多品种看板 indicator 。它能够全自动识别市场结构破位,在图表上精确绘制机构订单块与不平衡区,并同时在后台扫描一整篮子货币对的市场动态。 以下是该指标的核心功能逻辑与信号解读: 1. 核心架构:市场结构计算引擎 该指标将 Smart Money Concepts 中的三大核心要素进行了自动化建模: 摇摆高低点 (Swing High / Low): 算法通过 SwingPeriod 参数(默认 5 根 K 线)来寻找波峰和波波谷。只有当一根 K 线的最高点(或最低点)同时高于(或低于)左右两侧各 5 根 K 线时,才会被确认为有效的结构点。 结构破位 (BOS - Break of Structure): 当市场价格(以 收盘价 为准)完全突破上方或下方的有效摇摆点时,指标会在图表上绘制一条彩色虚线,并标注 "Bullish BOS"(牛市结构破位) 或 "Bearish BOS"(熊市结构破位) 。 机构足迹生成 (OB & FVG)

HARMONIC STRATEGY SUITE PRO MT5 Harmonic Strategy Suite Pro 是一款专为 MT5 设计的专业谐波形态指标及回测分析面板。与仅绘制线条的普通形态查找器不同,本指标内置了实盘模拟回测引擎,能够精确计算目标概率,并可动态优化图表视觉布局。 核心优势 可拖动交互式面板: 实时跟踪统计数据(入场成功、T1/T2 胜率、平均/总回报率),数据基于每种形态类型最近 100 次历史交易自动计算。 图表一键开关 (ON/OFF): 点击面板上的按钮可随时在图表上显示或隐藏对应形态,而后台的回测统计数据仍保持完整计算。 严格的限价单回测: 模拟真实交易流程。在形态确认后,在 D 点挂限价单。如果价格在回调成交前已触及 TP1 或 SL,该设置将自动作废(撤单),杜绝回测漏洞。 动态执行线条: 初始阶段交易水平线呈点状。当入场位、TP1 或 SL 被触及时,线条立即变为实线,并精准终止于触发的 K 线。 极致视觉美化: 标签高度随形态自适应缩放、三角形填充不透明度与胜率挂钩、文本水平重叠防冲突保护,确保图表始终清晰易读。

Ichimoku Strength Meter MT4 is a professional multi-timeframe indicator for MetaTrader 5 that combines currency strength, pair recommendations, Ichimoku trend direction and moving average bias in a clear dashboard. The indicator analyzes the 8 most important currencies: USD, EUR, GBP, JPY, CHF, AUD, CAD and NZD From this, all 28 major currency pairs are automatically calculated and evaluated according to strength, trend direction and signal quality. Main functions Multi-timeframe currency stre

Trend Scanner Dashboard Matrix is an advanced, ultra-optimized matrix panel for MetaTrader 4 designed for trend and institutional traders who need to monitor multiple financial instruments and timeframes simultaneously from a single screen. Stop clogging your platform with dozens of open charts. This dashboard analyzes market flow correlation in real-time and alerts you the exact moment an asset enters a strong trend or a correction phase. Key Features Real-Time Trend Matrix: Dynamically

VWAP Volume Price Customized Cycle FX-AIEA —— 多周期锚定VWAP指标(技术特性与参数讨论) 概述 本指标在传统VWAP(成交量加权平均价)的基础上引入了多周期锚定与自定义会话重置机制,旨在提供动态的“公允价值”参考区域。指标通过三重标准差通道(±1σ/±2σ/±3σ)构建对称的波动边界,可作为动态支撑阻力的参考。 核心算法特性 智能多时间框架锚定 :指标可根据当前图表周期自动附加更高维度的VWAP(例如:H4及以上→月线VWAP;H1→周线VWAP;M30及以下→日线VWAP),也支持手动指定任意周期(MN1/W1/D1/H4等)。 自定义基础周期模式 :开放周期自定义开关,可在参数面板中自由选择计算周期。 会话锚定(多重置点) :支持输入任意多个每日重置时间点(如 00:00,08:00,16:00 ),使VWAP在每天这些时刻重置,对应不同交易时段。 三重标准差通道 :基于实际成交量加权计算的标准差形成六条对称通道线,可用于观察价格偏离程度。标准差倍数可独立调整(默认1、2、3)。 显示周期数量控制 :可自由设定VWAP显示的历史

Quiet Confluence 是一款用于 MT4 图表的多因素技术分析指标,将布林带趋势、突破评分、MACD 背离、波动状态以及支撑阻力信息整合在同一界面中。它适合希望减少图表切换并从多个角度观察市场环境的交易者。
主要功能:
- 显示布林带上轨、下轨及随趋势方向变化的中轨。 - 结合价格穿越、成交量和 MACD 条件计算突破评分。 - 标记看涨与看跌 MACD 背离,可选择传统增强模式或枢轴确认模式。 - 使用布林带宽度识别收缩、扩张及常规波动状态。 - 显示近期支撑阻力及价格标签。 - 支持收盘 K 线信号、弹窗、声音和推送通知等可选设置。
指标参数可用于调整周期、阈值、历史计算范围、颜色和显示组件。Quiet Confluence 是分析辅助工具,不执行交易,也不构成投资建议。历史信号不代表未来结果,使用者应结合自身交易计划和风险管理进行判断。

Bollinger Insight 是一款基于 Tick Volume 的价格分布分析工具,用于在 MT4 主图中显示成交量轮廓、控制点、价值区域和低成交量区域。它可帮助观察指定区间内市场活动在不同价格层级的分布情况。
主要功能:
- 按价格区间绘制 Tick Volume Profile。 - 显示控制点 POC,并支持发展中控制点模式。 - 计算并显示 VAH 与 VAL,价值区域比例可调。 - 识别低成交量节点,并将其转换为可视化供需区域。 - 支持固定回看区间、轮廓行数、宽度和水平偏移设置。 - 可优先采用 M1 数据构建轮廓,并在数据不足时回退到当前周期。 - 支持当前 K 线更新、未完成 K 线包含方式及多实例标识。
Tick Volume 表示报价变动次数,并不等同于交易所真实成交量。不同经纪商的数据源可能产生不同结果。本指标仅用于分析,不执行交易,也不构成投资建议。

Market Structure Toolkit 用于在 MT4 图表上识别和标注价格结构、结构突破、市场特征变化、摆动点以及供需区域。它将常用的市场结构观察工具集中在一个可配置指标中。
主要功能:
- 支持外部结构和内部结构分析模式。 - 标记 BoS、CHoCH,并可选择显示 CHoT 与流动性扫盘线。 - 识别看涨和看跌订单块、供应区及需求区。 - 可删除已失效区域,或保留、弱化已经缓解的区域。 - 可选 ZigZag、HH、HL、LH、LL 摆动标签及内部变化箭头。 - 支持当前周期或指定信号周期。 - 提供供需、摆动高低点、结构突破和市场变化提醒。 - 可限制历史计算 K 线和图表对象数量,以控制图表负载。
市场结构会随着新价格数据和摆动确认而发展,尚未确认的结构可能发生变化。本工具用于辅助图表分析,不提供自动交易或结果保证。
---

Squeeze Momentum 将布林带与 Keltner Channel 的相对位置用于识别波动收缩和释放,并通过彩色动量柱显示方向与强弱变化。它适合观察低波动阶段以及随后可能出现的波动扩张。
主要功能:
- 识别无挤压、挤压进行中和挤压释放状态。 - 使用四色柱体区分看涨动量增强、看涨动量减弱、看跌动量增强和看跌动量减弱。 - 布林带周期、倍数、Keltner Channel 周期和倍数均可调整。 - Keltner Channel 可选择使用 True Range。 - 支持挤压释放、动量零轴穿越、挤压开始和动量颜色变化提醒。 - 提供弹窗、声音、推送及邮件通知选项。 - 可限制最大计算 K 线数量以减少终端负载。
挤压状态表示波动条件,并不直接代表价格方向或入场信号。动量和波动均可能迅速变化。本指标仅用于技术分析,使用者应独立评估市场风险。

MQL5 博客: https://www.mql5.com/en/blogs/post/772494
MT4 版本: https://www.mql5.com/en/market/product/185408
MT5 版本: https://www.mql5.com/en/market/product/185407
RSI 热力图 [tambangEA] 是一款专业的动量和市场结构指标,它结合了相对强弱指数 (RSI)、RSI 信号线、确认交叉逻辑、动态支撑位和阻力位、实时市场信息以及快速的多品种图表导航。
该指标旨在帮助交易者了解动量方向、识别重要的反应位、监控波动性和交易成本,并在无需手动重新打开图表的情况下快速切换选定的品种。
它适用于外汇、黄金、指数、商品以及其他 MetaTrader 支持的品种。
主要功能
基于简单移动平均线 (SMA) 的信号线 RSI 震荡指标
RSI 交叉确认检测
动态看涨支撑位
动态看跌阻力位
最近支撑位和阻力位计算
超买、超卖和超压可视化
看涨和看跌确认标记
实时仪表盘
当前和收盘价 RSI 信息
点差和 ATR

//+---------------------------------------------------------------------------------------------------------------------------- //+----------------------------------------------------------------------------------------------------------------------------
支撑阻力指标.无漂移.参考波浪理论构建. 设计参数: 初始显示K线数:参数为自定义历史K线起点.参数为1000表示从当前K起前1000根K线起算. 周期数:过滤连续上涨或下跌的周期间隔.即:此周期内再次突破视为继续前述趋势,不计入新的波浪极值点. 突破至少M点:此参数限制新高(低)须比前高(低)突破至少此点数,才视为有效突破. //+----------------------------------------------------------------------------

Session Volume Profile SMC 让您看清市场真正在哪里成交,而不仅仅是价格走到哪里。它为每个交易时段(日、周或月)在图表上直接构建一个横向成交量分布图,揭示吸引了最多活动、且价格随后往往会尊重的价格水平。
大多数图表只显示价格。Volume Profile 补上了缺失的维度: 每个价格上成交了多少 。本指标将其转化为清晰的按时段解读,并在其上叠加 Smart Money Concepts(SMC)市场结构视图,使成交量与结构集中在一个工具中。
它绘制什么
对每个时段,指标绘制完整的成交量分布图,包含 POC (控制点,成交最集中的价格)、 VAH 与 VAL (价值区上下沿)以及一个包含该时段大部分成交量的阴影 价值区 。时段收盘后,其 POC、VAH 与 VAL 会投射到下一时段,常充当 支撑与阻力 ——由订单流留下的水平。
成交量与市场结构同框
在分布图之上,指标标记 市场结构 ——Higher Highs、Higher Lows、Lower Highs 与 Lower Lows(HH / HL / LH / LL)——并跟踪 突破水平 (Break

4‑Bar Breakout Indicator — MT4 The 4‑Bar Breakout Indicator is a clean, mechanical, non‑repainting tool designed to highlight potential turning points and continuation signals based on a simple four‑candle pattern. It works on any timeframe and any symbol, providing clear visual arrows and dots whenever a breakout condition is met. This indicator is intentionally simple: no filters, no smoothing, no repainting, no lagging logic. Just pure price action — the same way discretionary traders have us

UT Bot Alerts — ATR Trailing Stop Buy/Sell Signals Overview UT Bot Alerts is a trend-following signal indicator built on the popular ATR Trailing Stop method. It automatically detects when price breaks through the trailing stop level and prints clear Buy / Sell arrows directly on your chart, backed by a complete real-time alert system . Whether you are a scalper or a swing trader, UT Bot Alerts helps you catch entries the moment the trend shifts — without staring at the screen all da

Spartan: T rend, Reversals and Exhaustions Indicator I believe trading must be made easy. Spartan is a premium indicator designed to identify the direction of price movements and reversal and exhaustion point. I know it is hard to find quality indicators. Spartan is free from repainting. To cut noise, it layers optional filters on top of the core RSI logic. ATR can require minimum volatility before a signal is allowed, or adjust how far arrows sit from the candle. ADX can block signals in flat,

SSL Hybrid — Complete NNFX Baseline, Trend & Exit System **Baseline, confirmation, continuation and exit — the four pillars of a rules-based trend system, in one indicator.** SSL Hybrid is the MetaTrader port of one of the most popular NNFX (No Nonsense Forex) tools on TradingView. It combines a configurable **baseline** with a volatility channel, the classic **SSL trend line**, an **SSL2 continuation signal** filtered by ATR, and a fast **exit line** that prints unambiguous exit arrows — plus

Shved Structure Engine Part of the Shved Market Analysis System (SMAS) Shved Structure Engine is a professional market structure analysis module designed to automatically build dynamic market channels based on Supply & Demand technology. Unlike traditional channel indicators that rely on moving averages, regression lines, or price extremes, Structure Engine analyzes market structure and automatically generates adaptive channels that reflect changing market conditions. Using proprietary

Nova Multi Timeframe Ema Scanner Pro 是一款专业的 MetaTrader 4 市场扫描与交易规划指标,旨在减少频繁切换图表,并将多时间周期趋势分析集中到一个清晰的仪表盘中。 该指标可扫描 Market Watch 中符合条件的交易品种,并基于三个时间周期上的可配置快速、中速和慢速 EMA 结构进行分析。符合条件的交易机会会经过筛选、排序,并显示信号强度、质量评分、高时间周期一致性、风险回报比、计划评分以及信号年龄等信息。 内置的高时间周期目标引擎可寻找实用的波段目标区域,并构建结构化的 T1、T2 和 T3 目标规划,同时显示入场参考、失效水平以及目标区域。 主要功能: 多时间周期 EMA 共振扫描 扫描 Market Watch 中的多个交易品种 可配置 Fast、Mid 和 Slow EMA 周期 Scalp、Day、Swing、Position 和 Custom 交易风格预设 Strength 强度评分 Quality 质量评分 高时间周期一致性分析 高时间周期目标引擎 T1、T2 和 T3 多级目标规划 风险回报比计算 目标计划内部评分 失效

Support Resistance Channels (SRchannel) **Automatic, self-adjusting support & resistance zones — ranked by real strength, with break alerts straight to your phone.** Most S/R tools draw a thin line at every swing and leave you to guess which one matters. **SRchannel** does the opposite: it finds the pivot points, groups the ones that cluster together into a **zone (channel)**, scores each zone by how many pivots and price touches it holds, and then shows only the **strongest** ones. The colors

Chandelier Exit / Stop — ATR Stop-and-Reverse Trend Filter **Know where the trend ends before it turns against you.** Chandelier Exit is a classic volatility-based trailing stop that hangs off the highest high (in an uptrend) or the lowest low (in a downtrend) by a multiple of Average True Range. It plots a clean stop-and-reverse line that follows price as long as the trend holds — and flips the moment price closes through it. The current trend is highlighted right on the chart, and every flip

Asymmetric Swing Intelligence System: A Nonlinear Market State Classification Algorithm
Is Your System Getting Stopped Out in a Dead Flat? ▷ This is the ultimate challenge for automated trading systems. During prolonged sideways consolidation, standard algorithms react linearly to every tick, chasing the price and opening a flood of false trades inside market noise. It is time to upgrade your market analysis to rigid, discrete logic. KPTF Technology: Physics Against Chaos ▷ The ASI prod

KT Opening Gaps 指标会在图表上绘制新周开盘缺口(New Week Opening Gaps)和新日开盘缺口(New Day Opening Gaps),标记每个缺口的 CE 中点,跟踪价格是否已经触及或完全回补缺口,并统计当前交易品种过去缺口的实际表现。 每个缺口都会以阴影区域显示,并可选择显示边界线、位于 50% 位置的 CE 虚线,以及包含缺口类型、日期、点数大小和 CE 价格的标签。周缺口和日缺口使用不同颜色, bullish 和 bearish 缺口也会分别使用不同颜色,方便你快速区分市场结构。
统计面板
开盘缺口在不同交易品种上的表现并不相同,所以这个指标不会直接假设缺口一定会回补,而是通过历史数据进行测量。加载时,它会扫描当前图表历史,找出该品种过去出现的开盘缺口,并记录每个缺口之后价格的运行结果。 对于周缺口,指标会显示样本数量、平均缺口大小(点数)、价格在五个交易日内回到缺口区域的频率、价格在 CE 位置发生反应的频率、缺口完全回补的比例,以及首次触及所需柱数的中位数。对于日缺口,指标会报告同样的数据,但触及窗口会按同一个交易日来衡量。 实时状态行会

Interactive Structure Dashboard(SMC Engine) Interactive Structure Dashboard(交互式市场结构仪表盘) 是一款专业级、机构级的 市场结构(Market Structure) 与 Smart Money Concepts(SMC) 指标,旨在自动化您的自上而下(Top-Down)市场分析流程。通过实时跟踪市场流动性变化与订单流,该指标能够有效过滤市场噪音,帮助交易者精准识别高概率交易区域。 结合实时多品种监控面板(HUD Dashboard)和智能区域反应监测系统,您只需打开一个图表,即可同时监控整个交易列表,并覆盖 6 个不同时间周期 。 核心功能 智能摆动点识别引擎 采用严格的多K线分形算法自动识别真实市场结构高点和低点,彻底避免手动绘制造成的误差。 动态 BOS(结构突破)投影 自动识别并绘制 Break of Structure(BOS) 水平,并持续跟踪市场结构变化,确保关键结构位置始终保持准确。 Smart Money 区域识别 一旦市场结构发生突破,系统立即计算并标记尚未回测的: Order Block

专业 RSI 多周期货币强弱 Dashboard 系统(MT4) 1. 货币强弱计算引擎 单一货币不能独立交易,而是通过货币对进行交易。因此,系统通过分析 28 个主要货币对来计算每个货币的绝对强弱。 使用的 8 种主要货币: USD 美元
EUR 欧元
GBP 英镑
JPY 日元
AUD 澳元
CAD 加元
CHF 瑞郎
NZD 新西兰元 指标核心采用 RSI(相对强弱指标),因为 RSI 已经标准化在 0 到 100 之间,可以消除不同货币对价格规模差异。 强弱计算公式 当货币为基础货币: 例如: EUR/USD 计算: Strength = RSI(EUR/USD) 当货币为报价货币: 例如: EUR/USD 中的 USD 计算: Strength = 100 - RSI(EUR/USD) 最终货币强度: Currency Strength =
该货币参与的 7 个货币对强度平均值。 范围: 0 - 100 强度等级: 超过 70: 极强(强烈上涨动能) 60 - 70: 中等偏强 40 - 60: 中性 30 - 40: 中等偏弱 低于 30: 极弱(强烈下跌动能) 2. 多周

Unique Professional 8 Snipe r is a multi-timeframe indicator that combines 8 different technical conditions to generate high probability BUY/SELL signal set ups and gives high probability precise entries. It's a non-repaint indicator with 8 confirmations and then a precise entry when all conditions are met. Alerts and Push Notifications with Entry ,Tp and Sl MT 4 and MT5 Direct EA is free along with the purchase of indicator Limited offer for few users only till 30th of September
Best Fo

Smart Divergence Finder 指标深度解析:趋势、背离与共振的实战指南 指标简介 Smart Divergence Finder 是一款专为 MT4/MT5 平台设计的智能主图综合指标。它突破传统副图背离分析的碎片化局限,通过算法整合趋势判定、多指标背离检测与智能信号过滤功能,将关键交易信号直接呈现在价格图表中。该指标的核心价值在于利用动态验证机制识别高概率反转点,显著降低假信号干扰,帮助交易者在趋势延续与反转临界点做出精准决策。 核心信号详解 1. 趋势与动态均线系统 指标通过自适应均线组实时界定市场状态,避免滞后性干扰:
EMA Fast(亮蓝色实线) :动态调整的短期敏感均线,根据市场波动率自动优化周期参数,紧贴价格运行。
EMA Smart(紫色虚线) :基于波动率加权的智能趋势线,平滑度高于传统EMA,能有效过滤短期噪音,作为多空分界参考。
趋势确认信号(彩色箭头) : 绿色实心箭头 :价格站上双均线且快线向上发散,确认多头趋势。 红色空心箭头 :价格跌破双均线且快线向下收敛,确认空头趋势。 2. 智能多指标背离检测 指标同步扫

Balanced Price Range (BPR) Pro Indicator - Master ICT Concepts (平衡价格区间专业版指标 - 精通 ICT 概念) 别再费力搜寻重叠的公允价值缺口 (Fair Value Gap) 了。使用 Balanced Price Range (BPR) Pro 指标,掌握 Inner Circle Trader (ICT) 交易法中最具爆发力的价格行为特征。该工具专为严肃的交易者设计,通过自动检测市场中概率最高的设置之一,将算法精度直接带入您的图表。 ICT 中平衡价格区间的力量 在 ICT 方法论中,平衡价格区间 (Balanced Price Range, 简称 BPR) 绝不仅仅是一个普通的缺口。它是一个高度具体、概率极高的区域,在此区域内,激进的买方交付 (BISI) 与激进的卖方交付 (SIBI) 发生了完全重叠。 由于银行间价格交付算法 (IPDA) 已经在这一精确范围内向买方和卖方都猛烈交付了价格,该区域在根本上变得 平衡 且高度有效。算法没有理由再次在这个区域停留。因此,当价格回到有效的 BPR 时,它就像一道坚固的

AURORA AUTO FIBONACCI — GOLD EDITION
自动斐波那契回撤 + 可选布林带
自动找出最近一段有意义的摆动
干净地绘制斐波那契回撤,并自行更新
黄金口袋(0.618–0.65)以填充区间突出显示
同一指标内可选布林带
不提供买卖信号——纯分析工具
无需 set 文件
Aurora Auto Fibonacci 免去了您手动画线的麻烦。指标会自行找出最近一段有意义的高点与低点,并在两者之间干净地放置斐波那契回撤位。一旦形成新的摆动,各回撤位会自动更新。
指标做什么
• 依据您设定的搜索深度与回溯范围,自动识别最近一段有意义的摆动。
• 绘制 0、23.6、38.2、50、61.8、78.6 与 100 各回撤位,并附清晰的 价格标签。
• 将 0.618 至 0.65 之间的黄金口袋以填充区间突出显示——这是许多交易者 在回调中特别关注的区域。
• 出现新的摆动时自动更新,您无需重新画任何东西。
可选布林带
此

Black Horse Finder 指标深度解析:趋势、压力支撑与多重信号的实战指南 指标简介 Black Horse Finder 是一款专为 MT4 平台设计的综合性主图指标。它源自经典的通达信综合主图逻辑,突破了单一均线或单一指标的局限,将趋势判断、动态压力支撑、多重买入信号(如老鼠仓、黑马线)以及背离检测高度集成于主图界面。该指标的核心价值在于通过多重算法过滤与冷却周期机制,帮助交易者在复杂的行情中精准捕捉高胜率的反转与突破机会。 核心信号详解 趋势与动态压力支撑系统 指标在主图上绘制了核心趋势线与动态通道,用于界定当前的市场状态: MA8 与 MA12(蓝色实线):代表短期与中期价格趋势,通过两者的排列关系(如 MA8 > MA12)直观判断多空方向。 压力线(青色线):基于过去30根K线的最高价动态计算,代表上方的阻力位。 支撑线(绿色线):基于过去30根K线的最低价动态计算,代表下方的支撑位。 多重买入信号检测 指标内置了多种高胜率的买入逻辑,并自动在主图上标注向上箭头(lime色): 老鼠仓 (Insider):在低价位出现大阴线或特定跌幅后,次日出

Why load 23 indicators when you can have them all in one interactive, clickable dashboard? Stop cluttering your charts with tangled lines and confusing histograms. Trading is about clarity and fast decision-making, not chaos. This advanced dashboard condenses 23 of the most powerful technical indicators into a single, sleek, and highly optimized panel. Get instant, real-time market analysis at a glance without sacrificing your chart space. Key Features The "Single Verdict" Engine: The dashboa

Wave Structure Pulse is a professional MetaTrader 4 indicator designed to identify high-quality trading zones with clearly defined entry, stop-loss, and profit targets. The indicator focuses on selecting precise areas where price may begin a strong directional movement. Its purpose is to help traders enter from better locations, avoid late entries, and follow a clear trading plan directly on the chart. Accurate Trading Zones Wave Structure Pulse identifies carefully selected Buy and Sell zones i

ICT OTE Scanner Pro (MT4) Smart Money Swing Detection + Optimal Trade Entry Zones — With a Built-In Signal Strength Score Stop Guessing Where "Smart Money" Will Enter. Start Measuring It. Every ICT trader knows the theory: find the swing, wait for the retracement into the 62%–79% Optimal Trade Entry (OTE) zone, and enter with the trend. The problem is execution — manually marking swings on every pair, every timeframe, is slow, subjective, and inconsistent. ICT OTE Scanner Pro automates the en

Edge Radar Pro MT4 — every pair, scored by edge. Edge Radar Pro scans your entire Market Watch and, for every symbol, auto-optimizes three price-action strategies — Momentum, Reversal and Breakout — across a grid of signal strengths and ATR-based SL/TP pairs. Each combination is backtested on closed bars only (non-repaint), and the winner is ranked by a single honest number: the Edge Score. Most scanners rank by raw Profit Factor — which flatters tiny samples. The Edge Score is a confidence-adju

Dominant Wave Pro (MT4 Version)
Trade with the market's actual rhythm — not a guessed one Most oscillators lock onto a fixed cycle length and never question it. Real markets don't behave that way — the length of a swing, a trend leg, or a pullback shifts constantly with volatility and momentum. Dominant Wave Pro takes a different approach: instead of assuming a cycle, it measures the market's current dominant cycle directly from price on every bar, and adapts to it automatically. At its core,

双通道趋势主图指标(Channel Breakout Master)深度解析:加权通道、双重EMA与趋势状态实战指南 指标简介 Channel Breakout Master(双通道趋势主图指标)源自通达信SLTD系列,是一款专为MT4/MT5平台设计的高阶主图趋势指标。它突破了传统单一布林带或均线通道的局限,通过 加权高低点EMA90通道 与 双重EMA平滑通道(25/60周期) 的双通道嵌套架构,配合趋势状态判定和通道触及信号,在主图上直观呈现市场的趋势方向、强弱状态及关键转折点。其核心价值在于利用多层通道过滤与信号冷却机制,帮助交易者在复杂行情中精准识别高概率的顺势交易与反转机会。 核心信号详解 1. 双通道系统架构 指标在主图上绘制两套核心通道,用于定义市场的多层级状态: 加权高低点通道(90周期EMA)
采用20,19,...,2,1的加权方式计算高低点,再经过90周期EMA平滑
生成扩展上轨(SLTD8)和扩展下轨(SLTD9),作为通道的宏观边界参考 双重EMA平滑通道(25/60周期)
25周期通道(白色虚线 + 黄色中线) :由双重EMA(E

Axiom Draw (MetaTrader 4) 是一套完整、专业的图表绘图与标注工作台,适合希望直接在图表上分析市场、规划交易、讲解观点和复盘行情的交易者。 您无需在多个绘图工具之间反复切换。Axiom Draw 通过一个结构清晰的面板,提供 38 种可选工具、20 种颜色、4 种绘图尺寸、专业交易标记、艾略特波浪标签、自由手绘、文本工具,以及详细的二维测量系统。 它适合主观交易者、技术分析师、艾略特波浪交易者、交易教育者、内容创作者,以及所有希望让图表更加整洁、清晰和有条理的用户。 适用于不同的交易工作流程 技术分析与交易规划 直接在图表上绘制趋势线、水平线、矩形、填充区域、箭头和自由手绘标注。 可用于标记: 支撑位与阻力位 供需区域 突破与反转 入场区域与止损区域 流动性区域 价格目标 重要市场事件 艾略特波浪分析 Axiom Draw 提供从 0 到 9 的专用圆圈数字标记,帮助交易者清晰标注波浪结构。 这些标记支持: 使用任意已选择的绘图颜色 使用透明颜色 全局标记尺寸控制 移动和重新定位 场景保存与恢复 价格波动测量 高级 2D Measure 工具可以进行垂直、水平或

方法的专业 MetaTrader 指标。
自动寻找价格与动量背离的摆动点,并在图表上绘制背离线和箭头。
输入参数: - InpMomPeriod — 动量周期 - InpSwingBars — 确认摆动点两侧的K线数 - InpDrawLines — 在图表上绘制背离线
交易思路: - 用顶背离收紧止损或对多单止盈。 - 结合支撑/阻力位进行反转入场。
适用于任何品种和周期。无DLL,无外部依赖。
主要特点:参数设置灵活,显示清晰,资源占用低,不会拖慢终端运行速度。适用于外汇、黄金、指数和加密货币等所有品种,兼容所有经纪商账户。安装简单,加载到图表后即可立即使用,无需复杂配置。建议先在模拟账户或策略测试器中熟悉各项参数,找到适合您交易风格的设置,然后再应用到真实账户。如果您在使用过程中有任何问题或建议,欢迎随时通过私信与我联系,我会尽快回复并提供技术支持。
购买后请联系我领取您的礼物!

Prime Vortex Pro— Multi-Layer Confluence Trend & Reversal Signal Indicator Trade with clarity, not noise. The Idea Behind Prime Vortex Pro Most signal indicators on the market fire on almost every candle — dozens of arrows a day, most of them meaningless noise that gets traders into weak, low-probability trades. Prime Vortex Pro was built around one simple rule: silence is the default. A signal only appears when multiple, independent layers of market evidence agree at the same moment. Instead of
您知道为什么MetaTrader市场是出售交易策略和技术指标的最佳场所吗?不需要广告或软件保护,没有支付的麻烦。一切都在MetaTrader市场提供。
