适用于MetaTrader 4的技术指标 - 33

通过新版本的RSI扫描仪,提升您的交易体验,增添更多乐趣! 自动仪器分组 :扫描仪自动从您的市场观察中收集所有仪器,并将其组织为四个类别:主要货币、次要货币、外汇和其他。 可自定义信号选择 :在设置页面,您可以选择要扫描的仪器信号。 灵活的时间框架选择 :您还可以指定希望监控的信号时间框架。 RSI参数配置 :轻松设置RSI参数,包括周期和适用价格,同时定义买入和卖出水平。您可以选择使用当前蜡烛的数据,或在处理信号之前等待蜡烛关闭。 个性化颜色定制 :自定义前景、背景、买入箭头和卖出箭头的颜色。扫描仪会自动调整每个元素的颜色,以创建一个美观的界面。 箭头类型选择 :从各种箭头类型中选择以符合您的偏好。 实时警报 :在所选仪器和时间框架上接收新信号的警报(当RSI穿越买入或卖出水平时)。警报可以直接发送到您的MT4平台,以及您的手机和电子邮件。
如果您觉得这个扫描器有帮助,快速的评分或评论将不胜感激!如果您希望为其他指标创建类似的扫描器,随时联系我们——我很乐意提供帮助️
FREE

The SuPrEs indicator indicates the distance to the next horizontal line whose name begins with the configured prefix (see Options).
usage Draw support & resistance in the chart and let the indicator warn you, as soon as a configured distance is undershot. Use the prefix to provide alarms for other lines as well as standard lines (see screenshot with pivot indicator).
Display of the indicator The indicator displays the distance to the next line above and below the current (Bid) price. Not more
FREE
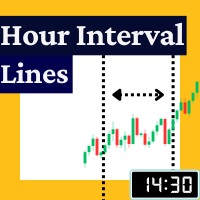
The Rayol Code Hour Interval Lines indicator was designed to assist your trading experience. It draws the range of hours chosen by the user directly on the chart, so that it enables traders to visualize price movements during their preferred trading hours, providing traders a more comprehensive view of price movements and market dynamics. This indicator allows the user to choose not only the Broker's time, but also the Local time. This way, the user no longer needs to calculate local time in re
FREE

THE INDICATOR WITH A DOUBLE MOVING AVERAGE (MA).
Recommendations: The indicator works better if two lines are of the same color at the same time. (if one is green and the other is red, the price is in the flat zone (it's better not to do anything)).
Input parameters:
1. The period of the first and second MATCH. 2. The thickness of the line of the first and second MATCH. 3. The color of the line of the first and second MATCH.
Looking for a good broker? Then I have a good offer for you! - 4
FREE

Relative Strength Index Cross [RSI Cross] A combination of 2 RSI to create a crossover trading setup Input parameters: signal mode: set it to true if you want to plug it into STAT (Signal Tester and Trader) arrow shift: distance between fast EMA line to arrow on chart price line filter fast RSI period slow RSI period RSI price method price upper level price lower level You can find the best setting for 4 hour EURUSD on this video
FREE

Description:
This Free Indicator will allow you to monitor the Max/Min spread in a bar/candle. By running it 24h/24h will allow you to recognize which period of time having maximum spread, based on that you will understand the market more, and could develop/improve to have better trading strategy.
Parameters: limit: <specify the limit of spread, above which the indicator will mark the price, at which high spread occurs>
Note: Beside the price marked due to high spread above, the indicator al
FREE

Unleash Your Trading Potential with the Apex Trend Detector! Are you tired of missing out on profitable trades? Do you struggle to find reliable entry and exit points in the volatile forex market? It's time to upgrade your trading arsenal with the Apex Trend Detector – the intelligent MT4 indicator designed to cut through market noise and pinpoint high-probability trading opportunities! The Apex Trend Detector isn't just another indicator; it's a sophisticated signal system that expertly fuses t
FREE

Resistance and Support is an easy to use indicator to apply horizontal lines of resistance and support. There are two windows for adding levels. When you press the button, a line appears on the price chart. It is possible to double-click this line with the mouse to activate and move it, thereby changing the indicator readings. In the indicator menu there is a choice of possible alerts - no alert, alert on touching the level an alert for closing the candle after the level.
FREE

PLEASE HELP REVIEW/ SUPPORT/ SHARE THIS OTHER INDICATOR HERE https://www.mql5.com/en/market/product/51637 AS YOU DOWNLOAD THIS ONE FOR FREE. THANKS.
This Indicator is based on four moving averages and the PIVOT points. The indicator provides clarity to trading, especially in ranging markets when price is very slow and tight. You can trade intensively daily, every day with this indicator. You may decide to trade with this indicator alone and get the maximum out of the market. The indicator wa
FREE

Daily Weeky Info
it shows you Daily open and weekly open and daily trend open (ie) daily open > previous day open and weekly trend open (ie) weekly open > previous week open Day high low and weekly low high and previous week high and low it will help you to decide your trade no need to check higher timeframe when you trade intraday,
dont trade against the daily trend and daily open level
FREE

Hello. Another free indicator from Sepehr! ;) You can determine the trend with this tool. Using crosses of two Moving averages, you can say that the trend is going to be bullish or bearish; A fast-moving average and a slow one. When the fast-moving crosses up the slow-moving, it's going to be an uptrend and when it crosses down the slow-moving, it means that you are going to have a downtrend. That's easy ;) Hope to enjoy it Sepehr(Faran)
FREE

很棒的实用工具,您可以实时监控账户的平均数和交易品种的点差 这将知道如何准确地识别数据,例如,能够知道您是否有 Prop Firm 帐户、知道正确的平均数以及点差是否被操纵等,以进行精确的批量计算
杠杆和点差指标的组合。 自动检查交易账户杠杆和点差的工具。 在所有经纪商外汇股票中工作。 有助于监控外汇经纪商在经济新闻公告期间是否改变杠杆和价差。 当前交易品种的实时点差检查。 交易账户实时杠杆检查。 易于理解的设计和快速刷新 ETC
杠杆是外汇市场的一个特殊性,它可以让您通过相对较少的投资赚取大量资金。 术语“杠杆”通常被翻译为杠杆或调平。 许多外汇经纪商提供了拥有非常有趣的杠杆的可能性。 例如,1:100的杠杆是指可以以比投资金额大100倍的金额进行外汇交易。 其结果是,在外汇市场上可以获得比实际投资大得多的利润,但损失的风险也更大。
FREE
This is a free helper indicator for MT4 that will help traders setup their constant volume charts depending on their trading style. It will calculate the number of ticks that your constant volume chart should have depending on the following trading styles: Scalper Active Day trader Day trader Swing trader Position trader Instruction video attached.
Enjoy!
FREE

Tired of using the same technical indicators? The "Tekno RSI" is an innovative tool designed to make the interpretation of the Relative Strength Index (RSI) more intuitive and accessible to traders of all levels. It displays the RSI as a 3-color histogram, providing a clear and intuitive visual representation of market conditions.
1)Key Features 3-Color Histogram: RSI is a versatile indicator providing insights into market direction and potential reversal points. However, when analyzing the cha
FREE

The indicator displays on a chart trading results. You can configure the color and font of displayed results, as well as filter trades based on the magic number. If multiple trades were closed within one bar of the current timeframe, the result is summed and output in one value.
Utility parameters Plot profit in - the format of output results: wither in deposit currency taking onto account commission and swap, or in points. Start from - start processing data at the specified time. Plot last dea
FREE
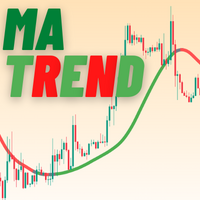
MATrend indicator makes the directional trend of the current market easily recognizable. Settings: MA Period : The amount of candles taken into consideration for the calculation of the moving average; MA Method : The method used for the calculation of the moving average. Selectable methods are: Simple averaging;
Exponential averaging;
Smoothed averaging;
Linear-weighed averaging; Usage: The color of the indcator will change based on the slope of the MA. Green : The indicator has a bullish sl
FREE

This indicator calculates and draws lines over the chart. There are two types of trends: Trend A: the line is drawn using local lows for uptrends and local highs for downtrends Trend B: the line is drawn using local highs for uptrends and local lows for downtrends There are a few conditions, which have to be fulfilled and can be changed by the parameters (see also picture 4): MinBarAge : the count of bars to the last base point of a line is called BarAge and has to be greater than the parameter
FREE

Smart Scalper's Edge: The Triple-Filter Signal Tired of chasing false signals? The "Smart Scalper's Edge" is your unfair advantage in the market, designed for traders who demand precision and confirmation. This indicator doesn't just rely on a simple crossover; it uses a powerful triple-confirmation system to filter out the noise and pinpoint high-probability trading opportunities. Get the clarity you need to enter the market with confidence! Key Advantages: Trade Smarter, Not Harder Filter Out
FREE

Spread Sekanas: The True Cost of Your Trade Stop guessing with pips and points. Start seeing the real , proportional cost of the spread with the Spread Sekanas indicator. The traditional spread, measured in pips, is misleading. A 2-pip spread on EUR/USD is completely different from a 2-pip spread on GBP/JPY or a $2 spread on Gold. This makes it impossible to consistently compare your real trading costs across different instruments. The Spread Sekanas indicator solves this problem by measuring th
FREE

MTF Heiken Ashi MA is a multiple timeframe Heiken Ashi & Moving Average indicator. Fully customizable for advanced & unique Heiken Ashi & Moving Average calculations.
Key Features Modified appearance and appeal from the traditional using only H eiken Ashi MA bodies. MTF Higher or lower timeframes available making this it great for trends and scalping. There are many settings that can be non-repaint for signals at a new bar and at bar 0.
Inputs Timeframe = PERIOD_CURRENT - timeframe of Moving
FREE

updated hidden market support and resistance. this indicator is made for new current market that has new support and resistance that some traders struggle to see. The indicator works on all timeframes from the 1-minute timeframe to the monthly One Trading tip to use When price is at resistance and the indicator appears wait for a bearish candle to close then enter a sell trade. Same applies for a buy trade when price reaches support level, and the indicator appears wait for the bullish candle
FREE
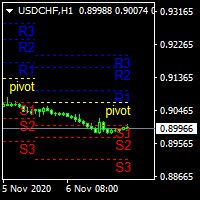
.................................if you need pivot point s levels............................... ............................this is a weekly pivot point level creator........................... ...it is for weekly pivots and show levels at times period d1 , H4 , H1 , M30 ............... .................................also shows levels for 3 last weeks.............................. ................can use it with other indicators and see important levels........
FREE
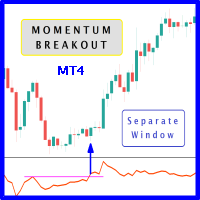
When prices breakout resistance levels are combined with momentum oscillator breaks out its historical resistance levels then probability emerges to record farther prices. It's strongly encouraged to confirm price breakout with oscillator breakout since they have comparable effects to price breaking support and resistance levels; certainly short trades will have the same perception. Concept is based on find swing levels which based on number of bars by each side to confirm peak or trough and in
FREE

AD Trend line draws trend lines on the basis of A/D indicator (Accumulation/Distribution). When A/D indicator breaks a trend line, the probability of the trend reversal is very high. This is a multitimeframe indicator which can display values from higher timeframes. Parameters Time-frame — Select a timeframe; zero is the current timeframe of the chart; Trend Line — Display lines on the chart; Apply to — Apply lines to close the candle's highest/lowest value; Width line — Width of the line; Style
FREE
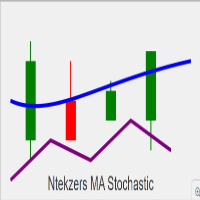
Please remember to leave a review for improvements thank you Overview of Key Functionalities: Buy Signal Conditions : The Stochastic Oscillator's main line crosses above the signal line. The closing price of the current candle is higher than the previous candle's close. The current closing price is above the EMA (Exponential Moving Average). The Stochastic value is below 50. When these conditions are met, a buy arrow is plotted, and alerts (audible or push notifications) are triggered. Sell Sign
FREE
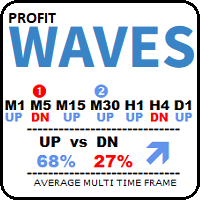
MT Rider — Multi Time-Frame Trend Indicator (Free Edition) Important Update for All MT Rider Users We have created an official community space , where all future improvements, upgrades, and additional tools will be released.
This includes: ️ upcoming upgraded versions of MT Rider
️ access to the MT4 OneClick trading panel
️ early previews of new tools
️ support and helpful resources
️ direct communication and announcements If you already have MT Rider downloaded here on MQL5, you are wa
FREE

It is another simple information indicator. This indicator shows the current spread of a financial instrument and the value of one point with a volume of 0.10 lot.
About the Spread Spread is the difference between the Ask and the Bid price of an asset in the stock or currency exchange. Let's refer to Central Banks and currency exchange in these banks, in order to understand why Spread is so important in currency trading. In Central Banks, we always see the difference between the buying and the
FREE

Indicador de Bandas de Fibonacci para Metatrader 4 . Este indicador funciona de forma similar a las conocidas Bandas de Bollinger clásicas, pero en lugar de usar la desviación estándar para trazar las bandas usa números de Fibonacci y el ATR (Average True Range). Puede usarse para trazar niveles de soporte y resistencia que pueden emplearse en sistemas de scalping de corto plazo y swing trading. Las bandas del indicador son calculadas de la siguiente forma: Línea central : Media móvil de n peri
FREE

Indicator support for only: Entry Point to Trend Pro Link indicator support : https://www.mql5.com/en/market/product/70867
Supports all currency pairs declared in the definition. Help investors do not need to open many charts. Notice the DEAL: multiple time frames confluence M15, H1, H4.
Entry Point to Trend Pro The indicator helps investors to identify the earliest and perfect reversal point. Easy to make decision to trade with the trend Price action trading. support resistance an
FREE

智能趋势线提示, 专业趋势线, 支撑线和阻力线提示
特点: 自动与点击模式,可将任意新绘制的线转换为提示线 (趋势线或水平线); 在较高时间帧内隐藏来自低时间帧的线,避免在图表上显示过多不同时间帧的线,从而造成混乱; 自动切换时间帧,当在较低时间帧里点击较高时间帧的线时; 自动展平水平线,如果用户使用趋势线来绘制支撑或阻力线; 自动支撑至阻力反转,反之亦然; 自动线颜色, 描述, 线形和宽度设置; 当价格触及某条线,则该线闪烁 (直到用户在图表上点击关闭); 当触及某线,该图表自动置上; 连声提示,夜间和日间模式声音类型 (直到用户在图表上点击关闭); 单声提示并弹出消息框; 移动通知; 邮件通知; 图表上的控制台; 自动隐藏控制板; 图表剪裁.
如何使用: 加载指标至图表; 控制台将出现在图表上; 使用 MetaTrader 趋势线或水平线工具,在您希望的价位绘制一条线; 如果自动模式启用, 新的线将被自动转换为提示线, 如果点击模式启用, 新线在点击后转换为提示线。
当价格触及支撑或阻力线,将会发生什么: 指标将图表带到其它图表的上面; 指标将切换到该线所属的时间帧; 该线开
FREE

交易实用必备工具指标 波浪自动计算指标,通道趋势交易 完美的趋势-波浪自动计算通道计算 , MT4版本 完美的趋势-波浪自动计算通道计算 , MT5版本 本地跟单复制交易 Easy And Fast Copy , MT4版本 Easy And Fast Copy , MT5版本 本地跟单复制交易 模拟试用 Easy And Fast Copy , MT4 模拟账号运行 Easy And Fast Copy , MT5 模拟账号运行 Fibo: 来源于KTrade 1.自动计算分析波段.->得出所需波段 2.画出斐波那契 回撤线,以及扩展线作为参考 指标波段分析如何得来->请参考如下 波段分析来源于波浪分析指标↓↓↓ 波浪自动计算指标,通道趋势交易 完美的趋势-波浪自动计算通道计算 , MT4版本 完美的趋势-波浪自动计算通道计算 , MT5版本
FREE

This is yet another non-parametric ZigZag. Its every upward edge continues until next bar's high is formed below highest low of its bars, and every downward edge continues until next bar's low is formed above lowest high of its bars. In addition to zigzag itself (shown in orange color), the indicator shows signal marks on those bars where zigzag direction changes. The blue arrow up denotes that new bullish edge is started (but not yet completed), whereas the red arrow down denotes that new beari
FREE

The Scaled Awesome Oscillator (SAO) represents a refined adaptation of the Awesome Oscillator, aimed at establishing consistent benchmarks for identifying market edges. Unlike the standard Awesome Oscillator, which records the variation in pips across different commodities, the only unchanging reference point is the zero line. This limitation hampers investors and traders from pinpointing specific levels for trend reversals or continuations using the traditional Awesome Indicator, a creation of
FREE

RJT SALAMANDER, the indicator as in a video game
VERSION 2
Pilot your PRICE spaceship inside the cavern and avoid the collision against the stalactites (green) and stalagmites (red), dodging these obstacles to win.
When these objects are forming (or disappearing) then you must make the decision how to move your ship (just like in a video game)
Depending on the market and the size of the candles/bars you can adjust the calculation of stalactites and stalagmites (based on the last bars) in the
FREE

The Awesome Oscillator (AO) Signal Candle Indicator is an indicator used to measure market momentum. Awesome Oscillator (AO) Signal Candle Indicator will change bar's color when set overbought or oversold levels reach. Colored Candles, based on Awesome Oscillator (AO) Signal.
-If the indicator is above zero, the market is bullish. -If the indicator is below zero, the market is bearish. -If the market is bullish, you can take a stand with green candle signals. -If the market is bearish,
FREE

Summary This indicator is based on the MA applied to the RSI indicator. It draws arrows at the confirmed crosses of the MA over the RSI line. When the MA crosses upwards, then a buy arrow is displayed and vice versa. The arrows do not repaint since the indicator only uses confirmed values and waits for the candle to close before painting an arrow. The indicator is also able to alert when arrows appear. There are 3 types of alerts - Popup, Email and Mobile Push Notifications.
Inputs All inputs a
FREE
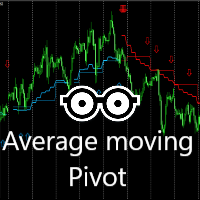
该指标对于每天交易非常有效。
结合移动平均线和2X轴点计算,每天都能产生令人信服的信号。
蓝色表示购买机会。 按照箭头可能的购买点。 蓝色枢轴和平均线是可能的支撑。 红色表示卖出机会。 按照箭头可能的卖点。 红色枢轴和平均线是可能的阻力。 最好在15分钟,30分钟或1小时的时间范围内使用。
Gāi zhǐbiāo duìyú měitiān jiāoyì fēicháng yǒuxiào.
Jiéhé yídòng píngjūn xiàn hé 2X zhóu diǎn jìsuàn, měitiān dū néng chǎnshēng lìng rén xìnfú de xìnhào.
Lán sè biǎoshì gòumǎi jīhuì. Ànzhào jiàntóu kěnéng de gòumǎi diǎn. Lán sè shū zhóu hé píngjūn xiàn shì kěnéng de zhīchēng. Hóngsè biǎoshì mài chū jīhuì. Ànzhào jiàntóu kěnéng de màidiǎn. Hóngsè s
FREE

This semaphore indicator is based in the standard RSI, which is applied over the Envelopes indicator that shows an envelope or envelope fluctuation borders. This is a version of RSI vs Envelopes Graph drawn in a separate window . A sell signal emerges when the upper envelope/border is broken by the RSI indicator from top to bottom. A buy signal emerges when the lower envelope/border is broken by the RSI indicator from bottom upwards. The indicator can draw arrows on the indicator, draw vertical
FREE

Moving Average Dashboard Bars ago is a unique multi currency, multi time frame dashboard. The dashboard is very simple. You select two moving averages, the instruments and timeframes The Moving Average Dashboard Bars ago then shows how how many bars ago the moving averages made a bullish or bearish crossover. It also shows you in real time when there is a bullish or a bearish crossover. The indicator plots in a subwindow. The Moving Average Dashboard Bars ago can be beneficial if you are trading
FREE

TrendFinder VolumeI are Colored candlesticks showing the trend based on Volume and Slope of Trend
This indicator will give you the color change on the next bar on the confirmation candle and will never repaint Lime Green = Possible Buy (Volume up), Teal Green = Bullish Weak (Volume Decreasing), Red = Possible Sell (Volume up) , Orange = Bearish Weak (Volume Decreasing)
TrendFinder Volume is optimize to trade on any market and to be used trending and None trending markets. For best results use
FREE

4H Open Line Indicator - Settings Overview This custom indicator is used to draw and visualize the opening price , midline , and high/low ranges of 4-hour candles on smaller timeframes. It's particularly useful for intraday traders who want to see higher-timeframe levels. Indicator Inputs and Descriptions Parameter Value Description OpenLineColor White Color of the line indicating the open price of the 4H candle. OpenLineWidth 1 Width of the open price line. OpenLineStyle Solid Line style
FREE

Chart Time Indicator is very simple and easy, but it can be very important to control the time before opening any manual trade. This indicator shows the time on the chart between 3 different options.
Input parameters Show Time : Select all the time options that you want to see. Local Time (Personal Computer Time), Server Time (Broker Time) or GMT Time. Recommendations: Use only one Chart Time Indicator for each chart.
FREE

This indicator is the translated version of Kıvanç ÖZBİLGİÇ's PMAX Indicator, developed on the Matriks Data Terminal, into the MQL4 language. It is a trend-following indicator and quite successful. Its usage will be free and unlimited for a lifetime. You can click on my profile to access the MQL5 version of this indicator. You can also get your programming requests for MQL4 and MQL5 languages done at İpek Bilgisayar with an invoiced service. You can reach İpek Bilgisayar at www.ipekbilgisayar.or
FREE

Moving indicator. It is written so that it doesn't signal when two moving averages cross. Easy to operate. It performed well on European and Asian currencies. Designed for long-term and medium-term types of trading. Индикатор мувингов. Написан так что даёт сигнал при пересечении двух скользящих. Прост в управлении. Хорошо себя показал на европейских и азиатских валютах. Рассчитан на долгосрочный тип торговли.
FREE
This indicator show all history orders on chart with the same symbol. It help you see time and price that orders opened and closed. 1) Show all history 2) Open chart with symbol that you need to watch 3) Attach the indicator 4) Press key "h" -Downwards line Blue: sell with profit -Downwards line Red: buy with loss -Upwards line Blue: buy with profit -Upwards line Red: sell with loss.
FREE

Универсальная, очень простая но надёжная торговая стратегия для ловли откатов после сильного импульса. Подходит как для Форекса, Стоков и Бинарных опционов. Чем выше ТФ, тем точнее сигналы, но реже входы. Можно применять как вход для работы по одному(двум) барам, так и для построения небольшой сетки из 3-5 колен как с мартингейлом так и без. Для Бинарных опционов просто время экспирации. В индикаторе есть алерты, пуш уведомления, уведомления на почту. Можно настроить расписание работы. Можно н
FREE
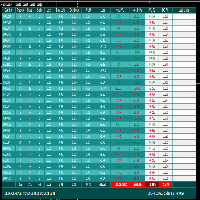
FCK Trade Report This indicator was developed by Fx Candle King. BEFORE CHOOSE CUSTOM PERIOD, GO TO TERMINAL WINDOW (ctrl+T), right click on ACCOUNT HISTORY and CHOOSE ALL HISTORY. This report searches the filtered data in your ACCOUNT CURRENT & HISTORY TRADE, Select your timespan for the report open and closed trades etc... Chose the report type - List only OPEN orders / List only CLOSED orders / List both OPEN and CLOSED orders
FREE

ATSCStrategy is a versatile indicator designed for both binary options and forex markets. Empower your trading strategies with this dynamic tool, providing valuable insights for making informed decisions in the fast-paced world of binary options and forex trading.
-Forex Market
-Binary Option Market
-Binary use timeframe 1M - 5M
-Forex use timeframe M30 or high
FREE
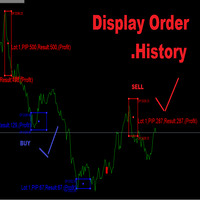
Display Order History Let Try trading.
Button Mark - Red : Order SELL - Blue : Order BUY
Button Lot - Ex. (Lot : 0.01)
Button Profit,Lost - Ex. (Profit:1,Lost:-1) Button PIP - Ex. (PIP:100) Button Open,Close - Ex. Open:3300,Close:3301 VLine M30,H1,H4,D1 IMport CSV Button All Button Summary M30,H1,H4,D1 Profit,Lost Number Order _____________ Start trading Display on chart ____________
FREE

Harami is a two candle pattern with recent candle formed inside the previous candle's high and low . It represents indecision in the market and is used for breakout price action trading strategy. This indi fires all signals to a dashboard on the chart including pop_up alert, push to phone notification and email. Harami has two types, bullish and bearish pattern. Enter long for bullish Harami and enter short for bearish Harami. Inputs : Currency Symbols: EURUSD,GBPJPY,USDJPY,USDCAD (default) , u
FREE
Version History : Date Version Changes 6/20/2022 1.00 Initial release 6/21/2022 1.10 Add global variables for Minimum (SYMBOL_volume_min) and Maximum (SYMBOL_volume_max) History Volumes Description : RedeeCash Volumes Indicator is the Volumes indicator that you have come to trust for market entry and exit with the added benefit of exposing key metrics as global variables. Including global variables in an indicator permits easier interaction with expert advisors (EA) and scripts. When attaching
FREE

The indicator is based on a single Moving Average of a user-defined period. By analyzing the price movement of the price relative to this MA, and also by tracking all updates of the price Highs and Lows over the same period as the MA period, the indicator draws its own picture of the trend, avoiding the ever-breaking MA lines. Therefore, if the trend goes up, the line will also point upwards and will not change its direction even on small retracements, allowing to capture almost the entire trend
FREE
IntradaySignals Intraday Signals is a visual and effective semi-automatic trading system, that: generates possible entry points to open BUY and SELL trades; displays recommended Take Profit and Stop Loss; displays current profit on open trade; displays current spread. The profitability of the indicator is shown in the screenshot on the example of the GBPUSD pair Does not redraw and works on opening bar. Time frames - M1-H1. Recommended TimeFrame-M5-M15. Signals are produced based on the used
FREE

Free Scalping is a comprehensive manual system developed for the most efficient trading at any market conditions and time scale.
The system is based on two main blocks:
1. The block of trend determination that calculates dynamic support and resistance. The function of auto-optimization is available for this block.
2. The block of price deviation from its median based on the big set of regressions to get the statistically-valid result. Entry rules For buys:
1. The trend goes up
2. The price i
FREE

速度阻力线是确定趋势和阻力线的有力工具。 该指标使用图表极值和特殊的数学公式构建线条。 该指标可用于确定趋势方向和枢轴点。
<---------------------------->
指标参数:
"Depth of search" -搜索图表极值的深度(以条形为单位) "Back step of search" -极值之间的最小距离(以条为单位) "Deviation of price" -同一类型极端之间的允许价格差异 "Line color" -带有相应索引的线条颜色 "Line style" -带有相应索引的线条样式 "Line width" -具有相应索引的线宽 <---------------------------->
你可以在"艾德森*古尔德的稀有作品集"一书中找到更多信息,也可以在私人信息中与我联系。
<---------------------------->
提前感谢所有有兴趣的人,祝你好运征服市场!
FREE

Just Currency Strength is a simple, and easy to use as a market analysis tool. It could helps trader to understand the broder view of the market and forcasting the movemt of each currency symbol and trend direction of each specific currency pair. Parameters Timeframe (Move Timeframe box to move the pannel) Currency (Must NOT be less than 5 currencies) Refreshtime in second Colors Strong//Weak//Neutrial Alerts setting Alert On/Off Push notification On/Off Happy Trading...
FREE

This indicator is designed for calculating the value of points for the specified lot sizes. The MT5 version is here https://www.mql5.com/en/market/product/29230 Description by lines Line 1 - deposit currency. Line 2 - lot size (10 input parameters) . All further values are calculated into columns below each lot size. Line 3 - calculation of value for one point. Line 4 - calculation of value for spread. All subsequent lines - calculation of value for points (20 input parameters) . All you need t
FREE

It is an algorithm to detect trend changes early. You should try multiple values for the Multiplier parameter (1 <value <10 recommended). At first glance you can see effective entries. This is, in fact, one of the rows that Geleg Faktor initially had. But it was removed because it was no longer needed. The other rows were sufficient for G.Faktor's effectiveness, but I still wanted to share this one.
Always test before using it on your live account so that you fully understand how it works and
FREE

描述 这款指标在主要金融工具的窗口里绘制彩色线性市场情绪图表。 它有助于判断支撑和阻力级别。 目的 本指标可以用于手工,或自动交易 EA的一部分。对于自动交易, 您可用的指标数值缓存区为 双精度 类型: 上升线 - 缓存区 0, 必须不等于 EMPTY_VALUE。 下降线 - 缓存区 1, 必须不等于 EMPTY_VALUE。
FREE
What is so remarkable about the Nema general PRT indicator? It calculates all known derivatives of "EMA" (you know some: DEMA - or, more simply, EMA of the 2nd depth level, TEMA - EMA of the 3rd depth level...DecEMA ...and so you can dive into your research up to level 50...) If you set the depth = 1, then it will be an analogue of "EMA"; I repeat - depth 2 = "DEMA"; depth 3 = "TEMA"...Experiment - check the behavior of the created average at other depths. The indicator also has the abili
FREE

TickChart Indicator plots the tick line on the main window of MetaTrader.
In the Lite version, the number of ticks is limited to 20 and the alert function described below is omitted. The "tick-line" shows the most detailed, fastest and real-time activities of the market, which are usually hidden in bars or candles longer than 1 minute. Usually, several new tick-line segments appear while a bar of M1 time frame is completed. After the release of an important economic indicator, the number of tic
FREE
This Dashboard is free to download but is dependent on you owning the Flag Trend Pro MT4 indicator. Down load the indicator: Flag Trend Pro
The Dashboard will show you on a single chart all the timeframes (M1 to Monthly) with their own status for the indicator: Gold Pro MT4
all time frame and all symbol: smart algorithm detects the trend, filters out market noise and gives entry signals!!!
How to understand the status: symbol - Fill All the Pair what you want. M1, M5, M15,M3
FREE
Intraday Pulse – Indicatore per il Prezzo Medio Intraday Intraday Pulse è un indicatore progettato per determinare il prezzo medio intraday alla chiusura giornaliera del grafico. Grazie al suo algoritmo avanzato, traccia automaticamente il livello di riferimento, fornendo un supporto essenziale per strategie di trading efficaci. Nota bene: il grafico giornaliero e' ideale per utilizzare l'indicatore (D1). Aggiorna il time frame alla fine della sessione giornaliera.
L'indicatore è versatile e ut
FREE

Introducing Demarker Jurik—an innovative indicator poised to revolutionize your forex trading strategy. This indicator combines the precision of custom moving averages based on the Demarker indicator with the MetaTrader 4 indicator, Demarker.
Jurik moving averages are renowned for their accuracy and reliability in analyzing price movements in the forex market. They offer traders smoother representations of price action, filtering out noise and providing clearer signals for identifying trends a
FREE

The indicator is getting the four most important trading sessions: New York London Sydney
Tokyo The indicator auto calculate the GMT time. The indicator has buffers that can be used to get the current session and the GMT.
You can use it as stand alone indicator and you can turn the draw off and call it from your EA. INPUTS Max Day: Max days back to get/draw. London Session On: Show/Hide London Session. New York Session On: Show/Hide New York Session. Sydney Session On: Show/Hide Sydney Session
FREE

The risk-to-reward ratio is used for assessing the potential profit (reward) against the potential loss (risk) of a trade. Stock traders and investors use the R/R ratio to fix the price at which they'll exit the trade, irrespective of whether it generates profit or loss. A stop-loss order is generally used to exit the position in case it starts moving in an opposite direction to what a trader anticipated.
The relationship between the risk and reward helps determine whether the potentia
FREE

It's a simple but useful tool for creating a grid based on Envelopes.
Only 2 parameters can be set: 1) "Period" - the period of all visible Envelopes (i.e. 4) and 1 Moving Average (Envelopes axis), 2) "Deviations Distance" - the distance between Envelopes.
Naturally, the colors of all 9 lines can be changed as desired. It works with everything that is available in your Market Watch.
Good luck!
FREE

The indicator allows you to trade binary options. The recommended time frame is М1 and the expiration time is 1 minute. The indicator suitable for auto and manual trading. A possible signal is specified as a arrows above/under a candle. You should wait until the candle closes! Arrows are not re-painted Trade sessions: TOKYO section (Half end) and LONDON section (First half) Currency pairs: EUR/USD Working time frame: M1 Expiration time: 1 minute. The indicator also shows good results when using
FREE
Easily track and trade with the trend using this indicator. Uses a circle and line to indicate the trend direction. Excellent for channels. Features alert function.
Parameter TrendPeriod can be changed to your preference. How to use: Simply attach to any chart. Blue circle plus blue line cross below price = Buy. Red circle plus red line cross above price = Sell. Best results when taking higher time frames into consideration before entering a trade. (Hint: Wait for the radar/circle to appear on
FREE

Indicator of vertical lines on the timeframes М5 and М1. It draws the lines for the period of the current day and the previous day. This indicator visualizes visually shows the trader the beginning and end of the chart hour, as well as the past hourly periods, 30-minute and 5-minute chart intervals. The advantage provided by this indicator is that the trader using this indicator on a chart of a currency pair with the smaller timeframe will always be aware of when the new hour begins.
On the con
FREE
MetaTrader市场提供了一个方便,安全的购买MetaTrader平台应用程序的场所。直接从您的程序端免费下载EA交易和指标的试用版在测试策略中进行测试。
在不同模式下测试应用程序来监视性能和为您想要使用MQL5.community支付系统的产品进行付款。
您错过了交易机会:
- 免费交易应用程序
- 8,000+信号可供复制
- 探索金融市场的经济新闻
注册
登录