 MetaTrader 5
 专家
 指标
 程序库
 实用工具
 窗口小部件
 规则
适用于MetaTrader 4的技术指标 - 176
 下面列出的技术指标信号对MetaTrader 4平台的开仓交易和平仓交易起着至关重要的作用。
指标的本质就是一种交易品种的数学转换,旨在预测价格变化。

适用于 MT4 的“8 个交易品种 CCI ”外汇指标,无需重绘。 - CCI 是最受欢迎的交易震荡指标之一。 - 商品通道指数 (CCI) 衡量当前价格与历史平均价格之间的差异。 - 重要水平:+/-200。 - 非常适合在 +200 以上区域进行卖出操作,在 -200 以下区域进行买入操作。 - “8 个交易品种 CCI” 允许在一张图表上控制多达 8 个不同交易品种的 CCI 值。 - 此指标也非常适合与价格行动入场相结合。 ............................................................................. Click here to see high quality Trading Robots and Indicators! 这是仅在 MQL5 网站上提供的原创产品。

适用于MT4的加密货币外汇指标 “Micro M and Micro W patterns Pro” ,无重绘,无延迟。 - “Micro M and Micro W patterns Pro”指标是一款功能强大的价格行为交易指标。 - 该指标可检测图表上的Micro M和Micro W形态: - 看涨Micro W形态 - 图表上的蓝色箭头信号(见图)。 - 看跌Micro M形态 - 图表上的红色箭头信号(见图)。 - 内置PC和移动设备警报。 - “Micro M and Micro W patterns Pro”指标非常适合与支撑/阻力位结合使用。 - 可用于任何时间周期。 - 该指标是检测趋势变化或趋势修正结束的绝佳指标。 - 指标带有信息显示功能 - 显示所关联外汇货币对的当前点差和隔夜利息。 - 显示内容还包括账户余额、净值和保证金。 - 信息显示可以放置在图表的任意角落 . Click here to see high quality Trading Robots and Indicators! 这是仅在 MQL5 网站上提供的原创产品。

ApexConverge 是一款 MetaTrader 5 指标,可自动识别三角形形态(上升、下降和对称三角形),绘制带阴影区域的边界线,并用箭头标记突破的K线。 MT5-version: https://www.mql5.com/en/market/product/200424
工作原理 指标先找出波段高点和低点,通过它们拟合两条趋势线并检验形状:上沿水平、下沿上升为上升三角形;上沿下降、下沿水平为下降三角形;两条线以相近斜率收敛为对称三角形。价格在突破之前必须一直处于形态内部。形态会延迟几根K线出现(参见 Swing confirmation (bars after) ),已确认的信号不会重绘。 交易用法 上升三角形 (水平阻力):通常关注向上突破。 下降三角形 (水平支撑):通常关注向下突破。 对称三角形 :中性形态,顺着突破方向交易。 向上箭头表示收盘价突破上沿,向下箭头表示收盘价跌破下沿。可在箭头出现时或回踩突破线时入场;止损放在对侧边界或最近的波段点之外;常见目标是以三角形最宽处的高度从突破点向外投射。 带有“(no breakout)”或“(expired)”标注的虚线

PRL Levels is a MetaTrader 4 indicator that displays structured and evenly spaced psychological price levels directly on the chart. It is designed to make price structure easier to read visually. It does not open, manage or close trades.
The indicator can be used on Forex symbols, indices and CFDs. Distances are entered in conventional pips for Forex and in direct price units for indices and CFDs. The appropriate unit is detected automatically from the symbol specifications provided by the bro

Signal Confirm watches one symbol and tells you when a trend setup has passed a fixed chain of checks. It works on any symbol and any chart timeframe. It reads only the M1 prices, the prices of the oscillator timeframe (M5 by default) and the daily prices your terminal already has, does not use any server, does not send anything out, and does not open, change or close orders. It shows what happened and when; the decision stays with you. What It Does When the chain below is complete, the indicato

QCL RSI Flow Candles — MetaTrader 4 QCL RSI Flow Candles transforms RSI momentum into smoothed Heikin Ashi-style candles in a separate indicator window. Candle bodies, wicks, a directional trend line and reference zones provide a visual framework for assessing momentum, pullbacks and changing conditions. Key Features RSI-based candles: View momentum through candle structure instead of a conventional RSI line. Directional colors: Green candles indicate that the oscillator close is at or above its

this indicator Draws Two Trend Lines automatically. my intend of use is :- 1 . For Buy Entry Make sure The Blue trend line is in Upward and Trending and also the Redline is in Horizontal.
2 . For Sell Entry Make sure the Red Line is in Downward and its Trending and also the Blueline is in Horizontal.
3. use caution, Technical confirmations is needed always. any info please submit a message.

This is MT4 indicator that automatically finds Edge of Trend where it makes Draw Down.
Examples
1 . Buy if The Two trend lines align up
2. Sell if the two trend lines align down
you can also make likes these
1. Buy if drawdown line is (yellow line) that upwards and Trend (Blue line) is Down 2. Sell if drawdown line is (yellow line) that downwards and the Trend (Blue line) is up
for any comments and contats submit message.

SMC Super position - Smart Money Structure & Liquidity Intelligence Professional multi-module market structure, liquidity and trade-planning indicator for MetaTrader 5, designed to combine structural analysis, liquidity behavior, trend context and confirmed signal logic in one compact workspace. The system includes Smart Money structure tools, an independent Master Signal engine, Confluence setups, Scalping analysis, Queen Trend context, multi-timeframe routing and an integrated Signal History d

Volatility Dots puts a trailing line of dots on your chart. In an uptrend the dots sit under the price, in a downtrend above it, and they flip when price closes through the opposite band. It works on any symbol and any timeframe. It reads only the prices your terminal already has, does not use any server, does not send anything out, and does not open or change orders. What It Shows One dot per bar. White dots under the candles mark a rising trend, red dots above the candles mark a falling trend.

CrowdTrap MultiAsset Liquidity MT4 CrowdTrap MultiAsset Liquidity is a technical analysis indicator for MetaTrader 4 designed to identify market structure, liquidity levels, liquidity sweeps, price retests, and potential trading scenarios. The indicator combines multi-timeframe market structure analysis with price action and liquidity-based analysis. Main Features Market Structure Analysis Uses H1, H4, and D1 market data to assess directional bias and identify Break of Structure (BOS) and Change

Nexus Trend Pulse – Trend & Signal Indicator for MT4/5 Nexus Trend Pulse is a visual trend analysis and trading signal indicator developed for MetaTrader 4/5. It combines dynamic trend zones, directional signals, stop reference lines, and entry level visualization in one chart interface. Designed for traders who prefer a clear and organized trading environment, Nexus Trend Pulse helps identify market direction, observe price reactions, and recognize potential trading opportunities without overcr

Daily Range Ladder draws six horizontal levels across the current trading day. The distances come from how far the symbol usually travels in a day, so the levels adapt to every symbol without any setting. It works on any symbol and any chart timeframe. It reads only the daily bars your terminal already has, does not use any server, does not send anything out, and does not open or change orders. What It Shows Three resistance levels above the day's low and three support levels below the day's hig

适用于 MT4 平台的“移动平均线加速度”( MA Acceleration )加密货币/外汇指标,无重绘(No Repaint)。 MA Acceleration 是一款剥头皮(scalping)交易指标,旨在作为“MA Speed”(移动平均线速度)指标的辅助工具。 该指标基于物理学公式进行计算,用于显示移动平均线的加速度。 利用 MA Acceleration 指标,您可以升级现有的标准交易策略,从而发掘更多交易机会。它适用于 SMA(简单移动平均线)、EMA(指数移动平均线)和 LWMA(线性加权移动平均线)。 MA Acceleration 本质上是相应移动平均线的二阶导数。 该指标反映了 MA Speed 指标数值的变化速率。 当 MA Acceleration 指标值 < 0 时,表示移动平均线在看跌方向上加速;当 MA Acceleration 指标值 > 0 时,表示移动平均线在看涨方向上加速。 建议将 MA Acceleration 指标与 MA Speed 指标结合使用,针对主趋势方向进行快速剥头皮交易:若 MA Speed 指标值 < 0,则趋势向下;若 MA
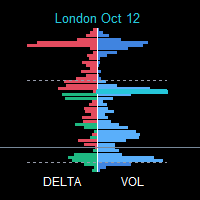
SessionFlowMap — 多时段成交量与Delta分布图(含POC关键位) SessionFlowMap 为外汇交易日的各个交易时段(亚洲、伦敦、纽约,另可选悉尼和自定义时段)生成成交量分布图和Delta分布图(买卖失衡)。对于每个时段,指标会找出 POC(控制点,即成交量最大的价格)和价值区域 Value Area(VAH 与 VAL,容纳大部分成交量的区间),并把这些水平位以水平线的形式向右延伸。你可以一眼看出市场在每个时段把时间和资金花在了哪里,以及哪些价位可能再次变得重要。 MT5-version: https://www.mql5.com/en/market/product/200942
工作原理 每个时段按各自的时间从 M1 历史数据中截取。亚洲、伦敦、纽约和悉尼的时间以 GMT 设置,并自动换算为经纪商服务器时间;自定义时段直接使用服务器时间。 时段的价格区间被划分为若干价格行(目标行数由你设置),成交量分配到各行。外汇没有集中式成交量,因此使用的是 Tick 成交量。 成交量分布图是每一行的总成交量;Delta 分布图是每一行的买入量减去卖出量(绿色表示买方

Know the direction. Know the plan. Know when to stand aside. CS Trend Pro turns a busy chart into a clear decision. It shows which way the market is moving and marks the moment that changes. With every signal it gives you a complete plan: where to enter, where the idea is wrong, and where to take profit. It is built for swing traders and scalpers who move with the swing: take a part of the profit at each target, and stay in for as long as the move lasts. Built on volatility and on support and re

Quantum Enigma Quantum Enigma is a technical analysis indicator based on market structure and price action. It is designed to identify potential Bullish and Bearish setups around established price ranges. The indicator analyses market conditions and can apply several configurable confirmation and filtering conditions before displaying a signal. This allows traders to adjust the balance between signal frequency and selectivity according to their preferred trading approach. How It Works Quantum En

AlphaTrend Pullback Pro MT4 Trend-following pullback signals, economic news filter, and professional dashboard — all in one indicator. AlphaTrend Pullback Pro transforms trend and correction analysis into clear, actionable visual signals. It identifies the macro market direction on a higher timeframe, waits for a pullback to the moving average, confirms rejection with a trend-aligned close, and triggers the entry point. No repainting on closed bars, no noise, no complexity. Why AlphaTrend Pullba

Correlation Radar PRO — MetaTrader 4 专业多资产相关性仪表盘 简短描述: 快速过滤市场噪音,秒级捕捉品种价格背离。Correlation Radar PRO 实时计算多资产在历史、月度、周度及当前周期的相关性,并支持将其他品种 K 线直接叠加至主图表,无需频繁切换品种。 完整描述: 频繁切换图表来判断市场联动不仅耗时,更易错过最佳进场时机。 Correlation Radar PRO 为您提供专业的跨市场分析仪表盘,将多资产联动动态直接集成于 MetaTrader 4 图表中。在 4 个维度(历史 500 棒、24 个月、52 周、当前 30 棒)下精确度量品种间关联度,助您在相关性增强或破裂时抢先捕捉高概率交易契机。 Correlation Radar PRO 的核心优势: 热力图直观视觉: 智能色彩矩阵,瞬间识别强正相关、中度相关或强负相关。 相关性动态趋势指示: 实时提示跨市场关联是在增强、减弱还是保持稳定,为交易决策提供可靠依据。 一键图表 K 线叠加: 点击面板中的任意资产,即可将其 K 线同屏叠加至主图表,无需改变原图表品种即可直接对比走

Mechanical Support Resistance automatically identifies potential support and resistance levels using vertical price profiles built from historical Open, High, Low, and Close (OHLC) prices. Most mechanical support and resistance indicators identify levels based on obvious price swings on the chart. Mechanical Support Resistance takes a different approach by analyzing the vertical distribution of OHLC prices to reveal support and resistance levels that are difficult to identify manually through vi

Enigma Cipher Enigma Cipher is a technical analysis indicator designed to help traders identify potential bullish and bearish market reversals through price pressure, momentum and multiple confirmation conditions. The indicator evaluates the relationship between recent price behaviour and the current signal candle. Additional filters can be enabled to refine the analysis and reduce signals that do not meet the selected conditions. How It Works Enigma Cipher first evaluates market pressure and pr

Renko Chart Pro MT4 is a practical Overlay/Panel Renko indicator designed to give traders a cleaner way to read price action without leaving the standard chart environment. Unlike many Renko tools that require separate offline charts or complicated setups, this indicator displays a fully configurable Renko panel directly inside your active MT4 chart .
You no longer need to have endless offline charts which makes shifting through instruments cleaner and more efficient. This is not an indicator I

MQLTeam Currency Power 把两种货币放在同一张图上,并显示哪一种更强。每种货币有自己的一篮子货币对。指标窗口里的柱状图是两个篮子之间的差,表格则显示是哪一个货币对造成了这个差。现成的例子是欧元对美元。改两个名称和货币对列表后,读法对任意两种货币都一样。 另有版本: MetaTrader 5 版 MQLTeam Currency Power 数值以点为单位。默认测量的是快慢两条移动平均之间的距离。如果想更快地看,还有两种直接按 K 线计算的方法。同一个指标用于 MetaTrader 4 和 MetaTrader 5。 如何阅读 表格每一行把第一列的一个货币对和第二列对应的货币对放在一起。正数表示该货币在这一行更强。 Gap 是货币 1 的强度减去货币 2 的强度。差为负,表示货币 2 更强。差为正,表示货币 1 更强。 可以这样读:EUR −11,USD +17,Gap −28。美元更强,差就是领先的幅度。底部一行是整个篮子的平均值。底部的差为负,表示货币 2 在篮子里更强。为正,表示货币 1 更强。 指标窗口里的柱子显示这个差随时间的变化。绿色表示差在上升,也就是货

ValueOrbit 显示当前周期的“公允价格”所在位置,以及市场偏离它的程度。这是一个背景分析工具:它绘制中心线 Value Core,并在其周围绘制三对“轨道”(±1σ、±2σ、±3σ),面板则显示价格被拉伸的程度。本指标不提供入场信号。 MT5-version: https://www.mql5.com/en/market/product/201292
工作原理 Value Core 是一条参考线,从每个周期(交易日、周或月)开始时逐步形成,新周期开始时重新开始。轨道标出距该线的标准距离,单位为 σ。价格越靠近中心线,市场越均衡;离得越远,拉伸越大。周期切换时线条会断开,避免出现垂直跳跃。 使用方法 将指标加载到图表,并根据交易风格选择 Value Anchor:日内交易(M1–H1)选 Session,波段交易(H1–H4)选 Week,H4–D1 选 Month。 判断背景:价格在 Value Core 上方说明买方占优,下方说明卖方占优。 价值回归:在震荡行情中,价格走到 ±2σ 及以外后,常会向中心线回落。请用您自己的入场方法确认。 顺势交易:趋势中价格通常停留在中心

AI ZONE RADAR — 用价格区域查看支撑与阻力 请选择与平台对应的版本 此页面为MT4版,另有MT5版可选。 查看MT5版商品 MT4版和MT5版是独立Market商品,本次购买仅包含所选平台的版本。 在判断信号之前,也看清价格位置 出现买入信号时,上方是否紧邻阻力?看到回调时,附近的支撑在哪里?增加更多水平线并不一定让这些问题更容易判断。AI ZONE RADAR 将附近价格区域及其相对强度集中呈现,帮助您先确认信号所处的位置。 AI ZONE RADAR 是 MetaTrader 4 图表分析指标。面板、状态信息和提示支持Market全部11种语言,可自动或手动切换。 English / Russian / Chinese (Simplified) / Spanish / Portuguese / Japanese / German / Korean / French / Italian / Turkish 水平线周围的区域、1至5级相对强度以及不同线宽,帮助您查看重要价格位置。面板集中显示品种、周期、附近支撑与阻力、距区域的点差距离(pips)、当前状态及方向倾向。强度

Crypto_Forex 指标 HTF DeMarker 适用于 MT4。 - 该指标是技术交易者用来寻找入场点和出场点的有用工具。HTF 表示 - 更高时间框架。 - DeMarker 振荡器线指示当前价格相对于之前高点和低点的位置。 - DeMarker 提供其他振荡器中最有效的常规发散信号。 - 当 DeMarker 高于 0.7 时为超买区域,当 DeMarker 低于 0.3 时为超卖区域。 - 指标具有内置移动和 PC 警报。 - 该指标非常适合具有价格行动条目或与其他指标结合使用的多时间框架交易系统。 - HTF DeMarker 指标允许您将更高时间框架的 DeMarker 附加到当前图表 --> 这是专业的交易方法。 Click here to see high quality Trading Robots and Indicators! 它是仅在此 MQL5 网站上提供的原创产品。

TraderDesk is an institutional-grade financial spreadsheet and account metrics dashboard meticulously engineered for professional portfolio managers, proprietary firm traders, and systemic asset growth monitors. By integrating a state-of-the-art Time-Weighted Split-Period Capital Engine , TraderDesk transforms your chaotic chart canvas into a beautifully structured, clean financial workspace. It automatically filters out standard candlestick noise, grid line clutter, and price scale bars, allow

Crypto_Forex MT4 上吊线指标“上吊线形态”,无需重绘,无延迟。 .............................................................................. - “上吊线形态”指标是价格行为交易的强大指标。 - 指标可检测图表上的看跌上吊线形态:图表上显示红色箭头信号(见图)。 - 支持 PC、手机和电子邮件提醒。 - “上吊线形态”指标非常适合与支撑/阻力位结合使用。 ............................................................................. Click here to see high quality Trading Robots and Indicators! 这是仅在 MQL5 网站上提供的原创产品。

外汇指标“INFO 价差掉期显示”适用于 MT4,交易辅助工具。 ....................................................................... - INFO 价差掉期显示指标显示其所附外汇对的当前价差和掉期。 - 它还显示账户余额、净值和保证金。 - 可以将指标值定位在图表的任何角落 . - 也可以设置颜色和字体大小。 ............................................................................ Click here to see high quality Trading Robots and Indicators! 这是仅在 MQL5 网站上提供的原创产品。

*Strong Hosoda Pro - Edizione COMPLETA - Premium*
Strong Hosoda Pro è un indicatore professionale di trend e livelli basato sul metodo originale Ichimoku Hosoda, sviluppato per trader esperti.
Questa è la versione Premium COMPLETA, valida per tutti i tempi, da M1 a D1. Nessuna restrizione.
*Perché Premium?* A differenza degli indicatori standard, combinazione direzione del trend, tempistica di ingresso e livello di take profit in un unico sistema chiaro, basato sulla logica completa dell'Ich

ZZ Impulse PRO is an authoring toolkit for reading market structure: two independent fractal ZigZags, Classic and Impulse/Correction modes, non-standard period candles, and full panel control — on a single chart. Concept The market speaks on both lower and higher scales at once. A typical ZigZag often keeps only one of those voices. ZZ Impulse PRO delivers controlled structure : two markups with separate settings, two ways to read waves, a flexible multiplier, and HTF/synthetic candles overlaid

GT Direction Dashboard — Comprehensive User Manual & Technical Guide 1. Executive Summary & Core Purpose The GT Direction Dashboard is a multi-timeframe, multi-metric currency alignment dashboard built for MetaTrader 4. It is designed to solve one of the greatest challenges manual currency traders face: Analysis Paralysis and Information Overload . Rather than manually switching across 6 or 8 timeframe charts ( MN1 down to M5 ) and adding 4 or 5 separate indicators (RSI, ADX, PBR, Volatility, RO

NOTE: Only 10 copies left at current price! Final price: 990$
Trade the Breakout. Catch the Move.
Take your technical analysis to the next level with TrendLine Support Resistance with Alerts , a MetaTrader 4 indicator designed for traders who focus on trendline breakouts. Identify potential trading opportunities with trendlines drawn directly on your chart and clear BUY and SELL arrows that help you spot possible breakout signals. KEY FEATURES Trendline Breakout Signals — Identify potenti

Fulcrum Value Profile 是一款 MetaTrader 4 指标:为每个交易时段构建 tick 成交量分布(Volume Profile),标出控制点 POC(Point of Control)和价值区(value area),以线条绘制发展中的 POC/VAH/VAL,跟踪未被触及的 POC(naked POC),并在已收盘K线上标记两种价值区形态:回到前一价值区内(80% 法则)以及在价值区外被接受(突破)。本指标从不开仓、修改或平仓。 快速开始 将指标加载到 M5、M15 或 M30 图表。 保持 Profile Period = Daily session,或选择 Custom session window 并按经纪商服务器时间(市场报价窗口的时钟)设置 Custom Session Start / Custom Session End。 数秒内,最近 5 个已完成时段以水平直方图绘出,信息卡显示 ABOVE VALUE、INSIDE VALUE 或 BELOW VALUE。 可选:启用 Popup Alert on Signal 或 Push Notific

所有 ICT 思路集于一个指标 - 市场结构、订单块、公允价值缺口、溢价 / 折价与 OTE、流动性扫荡、Killzones 和 SMT - 汇总为一个汇合评分,带提醒和多品种扫描器。 先免费试用: 点击 Free Demo,在策略测试器(可视化模式)中运行 - 面板、区域、信号和扫描器都可以在那里运行。 ICT Pro Honest Stats 把这一切画在您的图表上,用九个 ICT 因素检查每一根已收盘的K线,在面板中显示多头和空头分数,标出足够多因素在订单块或公允价值缺口处汇合的K线,当这种情况出现在您的图表或扫描器中的任何品种上时提醒您,并测量这些信号之后价格继续前进的频率,与随机K线对比。Honest Stats 系列的一员。 MT5 版本 | Order Blocks(免费) | Market Structure(免费) | Killzones(免费) | FVG(免费) | Liquidity Levels(免费) | SMT(免费) 新品(免费):反转公允价值缺口(IFVG),附回测信号和提醒 -> ICT Inversion FVG Honest Stats (被价格

Apex Patterns PRO 购买指标 — 免费获取基于该指标的 Expert Advisor。 自我优化的图表形态与突破分析智能 传统的形态扫描器依赖固定输入,在市场波动和结构发生变化时通常表现不佳。 Apex Patterns PRO 旨在适应不断变化的市场条件,将结构性图表形态识别、动量过滤和统计自我优化结合到一个分析框架中。 适应性扫描引擎 自我优化形态模式 在近期历史数据中自动搜索合适的形态参数,使指标能够根据当前市场行为调整其结构检测,而不是使用静态配置。 智能突破过滤 将经典形态识别与动量、成交量和价格行为指标相结合。引擎不会同等对待每次突破,而是评估潜在的市场结构,以识别符合当前统计环境的交易设置。 主要功能 固定的、不重绘的实时信号 自我优化的形态检测参数 丰富的图表结构库(顶部/底部、头肩顶/底、三角形、楔形) 基于动量和成交量的突破过滤 基于市场结构的动态止损和止盈水平 图表信号和实时性能指标 标准的推送、电子邮件和平台提醒 专为适应不断变化的市场条件而设计,而非依赖永久固定的参数 核心理念 目标不是将静态的几何形状强加于动态的市场。 目标是让历史市场数据

SMC Market Structure Toolkit 是适用于 MetaTrader 4 的 Smart Money (ICT / SMC) 工具包,集于一个指标之中。它像 Smart Money 交易者一样解读市场:先看结构,再看流动性,然后是价格可能做出反应的区域 - 并将这一切直接绘制在图表上,配有简短标签、可选箭头和可选提醒。 主要功能 结构同时以两种方式构建 - Internal 和 Swing 的 BOS / CHoCH,各自拥有独立的周期、摆动强度和颜色。 每个模块都有自己的周期,与图表无关:在 M5 上交易时,可在 H1 上构建流动性、在 M15 上构建区域。 从干净的图表开始。默认只开启 Internal 结构。其他模块只需一个开关即可启用 - 您搭建的是自己的图表,而不是我们的。 箭头处处可选。关闭后,结果(突破、扫荡、被取)会移入线上的标签 - 信息不丢失,图表依然整洁。 标签中的时间与存活时长(可选):水平线或区域何时形成、存活了多久。紧凑标签一键即可隐藏。 内置图表面板和提醒:D1 / H4 / H1 趋势、最近的流动性、未触及的区域、最新事件 - 以及带

Ribbon Pilot — 带交易区间、信号历史和品种观察列表的趋势彩带 用途 Ribbon Pilot 是 MetaTrader 4 图表指标:一眼看清当前趋势方向,用箭头标记入场信号,并立即画出完整的交易计划——入场价、止损价和最多四个止盈目标。同时统计近期信号的表现,让您无需离开图表即可浏览其他品种。 MT5-version: https://www.mql5.com/en/market/product/201869 工作原理 由八条平滑曲线组成的彩带跟随价格:青绿色表示上升趋势,橙色表示下降趋势。线间阴影便于判断趋势的方向与强度。金色点状基准线提供长期背景(仅供参考,不参与信号)。 彩带转向时,K线收盘后出现 (买入)或 (卖出)箭头。信号不会重绘,也不会消失。 每个信号都会立即绘制交易区间:入场线(Entry)、止损线(Stop)以及目标 T1–T4,按止损距离的倍数(R)表示。区间持续到止损被触及或所有目标达成。 最近 N 天的历史信号会在图表上标注:已达成的目标(T1…T4)、SL,以及最终结果 WIN / LOSS。这些数据用于 Pulse 面板的统计。 使用方

TCM ORB Indicator for MetaTrader 4 draws the opening range of the Asia, London and New York sessions and marks breakouts from each range on closed candles. What it shows - A box for each session's opening range (the first 30 minutes by default, adjustable) - Session times adjusted to your broker's clock and daylight saving automatically, or set manually - A breakout arrow when a candle closes outside the range - Optional entry, stop-loss and take-profit lines for each breakout, with an adjustabl

适用于MT4平台的加密货币外汇指标“修正突破专业版”,无重绘,无延迟。 - “修正突破专业版”指标是一款功能强大的价格行为交易指标,具有很高的盈利潜力。 - 该指标可检测价格修正后的看涨和看跌突破柱: - 看涨修正突破形态 - 图表上的蓝色箭头信号(见图)。 - 看跌修正突破形态 - 图表上的红色箭头信号(见图)。 - 支持PC和移动设备提醒。 - “修正突破专业版”指标非常适合与支撑/阻力位结合使用。 - 指标带有信息显示功能 - 显示所关联外汇货币对的当前点差和隔夜利息。 - 信息显示还显示账户余额、净值和保证金。 - 信息显示可以放置在图表的任意位置 . Click here to see high quality Trading Robots and Indicators! 这是仅在 MQL5 网站上提供的原创产品。

TCM SMC Indicator for MetaTrader 4 marks market structure on your chart: supply and demand zones, breaks of structure, liquidity grabs and fair value gaps. Everything is calculated from closed candles. What it shows - Fresh supply and demand zones, extended to the right until price returns to them, with the option to also show zones that have been revisited - Breaks of structure (BOS), labelled on the chart - Liquidity grabs (LQG), where price runs a recent high or low and turns back - Fair valu

BTCUSD SSL Channel Pro Multi-timeframe trend analysis and filtered BUY/SELL signals for MetaTrader 4. Overview BTCUSD SSL Channel Pro is a technical analysis indicator designed to help traders identify market direction, potential trend reversals, and filtered trading opportunities. The indicator combines an SSL channel with momentum analysis, trend-strength measurements, volatility conditions, tick-volume participation, and optional higher-timeframe confirmation. Its chart interface displays tre

TCM Trend Indicator for MetaTrader 4 highlights trend-following setups on closed candles and shows a suggested entry, stop-loss and take-profit for the latest one. What it shows - An arrow under or over the candle when a bullish or bearish trend setup appears, on closed candles only, so arrows do not repaint - Entry, stop-loss and take-profit lines for the latest setup, with the stop based on market volatility - A title and status line showing the current state Risk : reward Choose 1:1, 1:1.5, 1

Liquidity Sweep and Market Structure Indicator is a chart-based tool for MetaTrader 4 that highlights potential liquidity grabs around recent swing highs and lows. The indicator can optionally wait for a market structure break, known as a Change of Character, before displaying a directional signal. Its scoring system can include a volume filter and higher timeframe trend bias. Features Identifies potential bullish and bearish liquidity sweeps. Optional market structure confirmation. Configurabl

Crypto_Forex 指标“价格行为过滤直方图” - 是价格行为交易的有效辅助交易工具!无需重绘。 ............................................................................................................... - 该指标向交易者建议入场方向。然后交易者只需在该方向搜索价格行为信号即可。 - 价格行为过滤直方图应与价格行为模式和支撑/阻力位相结合。 - 绿色直方图 - 寻找买入入场。 - 红色直方图 - 寻找卖出入场。 - 使用此指标,有很多机会升级标准策略。 - 指标内置移动和 PC 警报。 Click here to see high quality Trading Robots and Indicators! 这是仅在此 MQL5 网站上提供的原创产品。

Box Volume Profile Box Volume Profile draws a volume histogram inside any rectangle you place on the chart. Choose a time window and a price range, and the indicator shows how much volume was traded at each price level inside that zone. It also plots the Point of Control (POC) and the Value Area boundaries (VAH and VAL). How to use Press the draw hotkey (the letter V by default) and drag a rectangle anywhere on the chart. The volume profile appears immediately inside the box. Move or resize the

G2 SCANNER — 6-Setup Confluence & Trade Zone Suite by Ida Bagus Putu Mahardika Product Description G2 Scanner is a professional multi-setup indicator for MetaTrader 4/5 that combines 6 proven trading strategies into one elegant neon dashboard. Built for discretionary and systematic traders who want to see signal confluence, trade zones, and performance statistics in real time — without opening multiple charts or separate indicators. Six Core Setups VWAP Reclaim — mean-reversion entries aft

NexusFlow MTF Pro MT4 — MetaTrader 4 的终极多时间框架利器 厌倦了在 M5 或 M15 图表上交易,却过晚发现 H1 或 H4 的主趋势完全与您的入场方向相反?记不清为了对齐市场方向,开过多少个窗口、不停切换图表,或是让满屏混乱的指标挤满屏幕? NexusFlow MTF Pro MT4 专为消除这种交易阻碍而生,全面提升您的订单流与趋势分析水平。 为什么 NexusFlow MTF Pro MT4 是您交易系统中的必备工具? 同一图表上的真实多时间框架视角: 直接在执行图表上监控任何更高周期(从 M1 到月线)的移动平均线,无需频繁切换窗口。 高达 50 条均线的交互式面板: 在清爽、优雅且完全交互的面板中,集中管理并控制多达 50 条同步移动平均线。 极致敏捷(无需手动刷新): 直接通过面板按钮更改周期、切换计算方法(SMA、EMA、SMMA、LWMA)、调整颜色或切换时间框架。所有更改即时应用于图表。 平滑曲线与 K 线过滤: 告别多时间框架指标常见的锯齿状“阶梯”外观。NexusFlow MTF Pro MT4 采用智能视觉平滑技术,并

FORBEX Murrey Math SRW Scanner PRO Find your zones. Check the confluence. Focus your analysis. FORBEX Murrey Math SRW Scanner PRO brings Murrey Math levels, SRW support and resistance, and Market Watch scanning into one interactive workspace for MetaTrader 4. Move from a broad market overview to a selected chart, with the tools to examine where price stands and which areas deserve closer attention. Key features Murrey Math chart levels: switch between Daily, Weekly and Monthly modes. Daily and W

UT Bot Scanner Pro MT4 is a scanner indicator for MetaTrader 4 that shows the UT Bot buy or sell side of many symbols and timeframes in one panel. It sends an alert when a new signal appears. The calculation is the same as in the free UT Bot Signal Alerts MT4 indicator, which covers one chart. The scanner runs it for a whole list, so you need not flip through charts. It places no orders. Cells use closed bars only, so a cell does not change after its bar has closed. Standalone: everything is bui

Confluence Dashboard MT4 is a dashboard indicator for MetaTrader 4. One row per symbol shows six checks (EMA, ADX, MACD, RSI, SuperTrend, UT Bot) and a BUY, SELL or WAIT verdict, with alerts. You choose how many checks must agree before the verdict turns BUY or SELL, so you see at a glance which symbols line up on one timeframe. It places no orders and does not repaint. Rows use closed bars only, and one copy shows one timeframe. Standalone: everything is built in. You do not need to buy or inst

Half Trend ADX MT4 is a trend indicator for MetaTrader 4. It draws a trend line with buy and sell arrows where the trend turns, sends alerts, and can skip weak turns with an ADX filter. It is an indicator, not a trading system: it places no orders and manages no trades. Arrows and alerts come from closed bars and do not repaint. Standalone: everything is built in. You do not need to buy or install any other product named on this page. MetaTrader 4 edition: the same calculation, line, arrows, cha
Range Filter Scanner MT4 is a scanner indicator for MetaTrader 4. One panel shows the latest range-filter signal on many symbols and timeframes, how many bars ago it came, and whether the next timeframe to the right agrees. It sends an alert when a new signal appears. It places no orders. It runs the same range-filter engine as the free Range Filter Signals MT4 indicator, for a whole list of charts at once, on closed bars only. Standalone: everything is built in. You do not need to buy or instal

Divergence Scanner MT4 is a scanner indicator for MetaTrader 4. One panel shows the latest RSI, MACD, Stochastic, CCI and OBV divergence on many symbols and timeframes. It shows how long ago each was confirmed and how many oscillators agree, and it sends an alert when a new one appears. It runs the same divergence engine as the free Divergence Signal Alerts MT4 indicator, for a whole list of charts at once. It adds three more oscillators and a count of how many agree. It places no orders. Cells

Candlestick Scanner MT4 is a scanner indicator for MetaTrader 4 that watches many symbols and timeframes for 21 candlestick patterns. Each cell of its panel shows the latest pattern. A context filter can keep only patterns at a recent low (bullish) or high (bearish). A statistics table shows what price did after each pattern in your own history, next to the same measure for any bar. It is for traders who want to check a whole watchlist in one place. It works on closed bars only. A cell never cha

Harmonic Scanner Pro MT4 watches many symbols and timeframes at once for eight harmonic patterns: ABCD, Gartley, Bat, Alternate Bat, Butterfly, Crab, Deep Crab and Cypher. One panel shows where a pattern has just reached its potential reversal zone. It also shows where one is forming close to its zone, and how long ago the last one completed. It uses only confirmed swings and closed bars. A completed pattern in a cell never changes afterwards. MetaTrader 4 edition: the same calculation, panel, o
Sequential Scanner MT4 is a panel indicator for MetaTrader 4 that runs the 9-13 sequential count on many symbols and timeframes at once. Each cell shows a fresh 9 or 13, a count one bar from completing, or a countdown in progress. Otherwise it shows the latest 9 or 13 and how many bars ago it came. It counts closed bars only. A cell never changes after its bar has closed. It places no trades. Standalone: Everything is built in. You do not need to buy or install any other product named on this pa

Gann Toolkit MT4 is an indicator for MetaTrader 4 that draws W.D. Gann's price and time tools from the swings it confirms: Square of 9 levels, Gann fan angles and the Gann box. It also draws the HiLo Activator and swing line of the free Gann HiLo Swing MT4 . A multi-symbol HiLo trend table and alerts are included. The levels, angles and box use confirmed swing pivots on closed bars. They change only when a new swing is confirmed. MetaTrader 4 edition: the same engine, levels, fan, box, table, in

SMC Session Scanner MT4 is a panel indicator for MetaTrader 4 that watches many symbols and timeframes for smart-money structure and session levels. For each symbol and timeframe it shows one of these: a fresh break of structure (BOS), a change of character (CHoCH), or a fresh liquidity sweep. It also shows price inside a live order block or fair value gap. Otherwise it shows the latest break and how long ago it was. A Session column shows the session now. It also shows today's first close beyon

GP Confluence Scanner MT4 Advanced Multi-Timeframe Market Structure & Confluence Analysis Don't get stopped out easily again! GP Confluence Scanner MT4 is an advanced technical analysis indicator developed for MetaTrader 4, designed to reveal important market levels, hidden support and resistance, and multiple technical confluences before entering a setup. Rather than relying on a single indicator, GP Confluence Scanner combines multiple analytical techniques to identify areas where significant

The Béway BIG 3 is a chart-analysis indicator, not a trading robot. It never places, modifies or closes an order. It draws levels and labels on your chart so you can plan your own trades. What you get The Béway BIG 3 is best paired with The Béway Panel which has Kngbé's Special Strategy checklist built in. It is truly a proprietary experience! 1. Smoothed VWAP VWAP is calculated from a timeframe you choose (default M15) and looks the same on every chart from M1 to H1. You can watch price

The Béway Sync is a chart-workflow utility indicator, not a trading robot. It never places, modifies or closes an order. It saves you the time of lining up charts and redrawing the same levels on every timeframe. What you get 1. Scroll Sync (same real time on every chart) Charts in the same sync group and symbol stay locked to the same calendar moment at the chart-shift marker. An H1 chart and an M1 chart land on the same instant, each snapped to its own nearest bar. Every chart jumps straight t

Push Scalping - Indicator for MetaTrader 4 Push is an indicator that helps identify BUY/SELL signals on MetaTrader 4, combining reversal conditions with the Push signal set. The signal only appears when the system confirms a closed candle and is displayed directly on the price chart. Use the One Click Trading MT4 to trade more effectively. The panel is draggable and automatically switches between light and dark modes based on the chart background. It features auto-scaling text within buttons,

A Chart-style Long/Short Position tool for MT4. Drag entry, take profit and stop loss directly on the chart, see the risk/reward ratio and the lot size calculated from your risk % instantly. Green TP zone, red SL zone, clean English labels, and a round on-chart button to show or hide the tool. Purely visual - it never opens, modifies or closes orders. Plan trades on MetaTrader 4 visually, directly on the chart. Place the box, drag the levels, and read the price, RR and position size at a glance.

Mega MNFM Mega MNFM is a MetaTrader 4 dashboard that brings completed-bar technical readings, a seven-timeframe trend map, market-session clocks and loaded account-history statistics into one panel. Technical dashboard Ten readings: RSI, MACD histogram, Stochastic, EMA trend, ADX, Bollinger Bands, a local technical Fear & Greed proxy, an indicative synthetic dollar basket, ATR rank and OBV flow. Multi-timeframe map covering M1, M5, M15, M30, H1, H4 and D1. Directional summary, trend strength, li

适用于 MT4 的 Crypto_Forex 指标 CCI HTF 振荡器。 - 使用适用于 MT4 的专业 CCI HTF 振荡器升级您的交易方法。HTF 表示“更高时间框架”。 - 商品通道指数 (CCI) 衡量当前价格与历史平均价格之间的差异。 - 重要级别:+/-100。 - 非常适合在 +100 以上区域进行卖出,在 -100 以下区域进行买入。 - 该指标非常适合结合价格行动入场的多时间框架交易系统,或与其他指标结合使用。 - CCI HTF 振荡器指标允许您将更高时间框架的 CCI 指标附加到您当前的图表中。 - 指标内置移动端和 PC 端警报。 Click here to see high quality Trading Robots and Indicators! 这是仅在 MQL5 网站上提供的原创产品。

QUANTUM BINARY SNIPER MT4 专用 AI 引擎 | 三根 K 线价格行为 | 多时间周期 CCI 动量 | Quantum Binary Sniper MT4 将多个层面的图表分析整合到一个协调统一的 MetaTrader 4 工作环境中。它结合了 AI Special Engine / Prediction Engine 组件、预设的三根 K 线算法、实时方向箭头、多时间周期 CCI 动量矩形区块、历史形态回填功能,以及独具特色的深色界面。 每个主要视觉元素都有明确用途:识别形态、展示图表背景,并使历史信号和当前信号更便于查看与分析。 其设计以图表的直观可读性为核心。Quantum Binary Sniper 不会用大型统计仪表板占据屏幕,而是让价格 K 线保持在视觉中心,在符合条件的形态出现处标注 BUY 和 SELL 箭头,并将辅助信息布置在图表周围。 01. AI Special Engine — Prediction Engine AI Special Engine / Prediction Engine 是 Quantum Binary Sniper

Pattern Oracle is an all-in-one chart pattern engine for MetaTrader. It scans three zigzag levels at once, finds more than 30 harmonic, chart, continuation and reversal patterns, scores every setup and draws a complete trade plan with entry, stop-loss and two take-profit levels. A built-in teaching mode explains every pattern right on the chart. Pivots are only used once they are confirmed and every decision is made on a closed bar, so signals do not repaint . Patterns detected Reversal : Double

Quantum Edge is a machine-learning trend and signal indicator for MetaTrader. It combines a Lorentzian-distance k-nearest-neighbours classifier, a rational-quadratic kernel regression cloud and a multi-timeframe trend filter into one clean chart tool, then turns the result into clear, tiered BUY and SELL setups with ready-made stop-loss and three take-profit levels. Every signal is calculated on closed bars only . Once a label appears on the chart it stays exactly where it is: no repainting, no

Inversion FVG 用于识别公允价值缺口(三根K线形成的失衡区),并在缺口失效的时刻给出交易信号。当K线实体收盘穿过缺口后,该缺口被“反转”,成为支撑或阻力。价格回测并出现拒绝收盘时,指标会画出箭头,并同时给出入场、止损、TP1 和 TP2 价位。
工作原理 1. 识别看涨或看跌 FVG,并画出原始区域。 2. K线实体收盘穿过该区域,区域被反转。 3. 第一次回测并出现拒绝收盘 = 信号箭头(蓝色向上 = 买入,红色向下 = 卖出)。 4. 止损放在区域之外并加上 ATR 缓冲。TP1 和 TP2 按 R 倍数设置(默认 1R 和 2R)。
功能 - 只使用已收盘K线:箭头不会重绘,K线收盘后不会移动。 - 入场、止损、TP1、TP2 线在价格到达时停止延伸。 - 50%(CE)线、信息面板、活跃区域计数。 - 弹窗、推送、邮件和声音提醒。 - 可选的高周期 EMA 方向过滤、按 ATR 设置最小缺口、区域有效期、最大区域数。 - 适用于任何品种和周期。
使用方法 等待箭头出现,在下一根K线开盘入场,止损设在 SL,TP1 处部分止盈并把止损移到入场价,目标 TP2。
MetaTrader市场是 出售自动交易和技术指标的最好地方。
您只需要以一个有吸引力的设计和良好的描述为MetaTrader平台开发应用程序。我们将为您解释如何在市场发布您的产品将它提供给数以百万计的MetaTrader用户。
