适用于MetaTrader 4的技术指标 - 17

该指标是TradingView平台"Duyck"开发的"ATR Based Trendlines - JD"指标的MetaTrader 4移植版本。 本指标通过自动持续绘制趋势线运作,其独特之处在于不仅基于价格,还结合ATR反映的波动率。因此趋势线的角度由ATR(的特定百分比)决定。 趋势线角度会跟随价格变化,这种变化由发现枢轴点时的ATR值决定。ATR百分比参数控制趋势线是跟随ATR变化率(100%),还是其分数(<100%)或倍数(>100%)。 输入参数
回溯深度:设定检测枢轴点时需要检查的K线数量
ATR目标百分比:调整趋势线方向上ATR影响的敏感度
依据影线/实体绘制:选择枢轴点和ATR计算使用K线实体还是影线
选择趋势线方向:看涨/看跌/双向
显示全部趋势线开关
最大趋势线数量(当"显示全部趋势线"关闭时)
上升趋势线颜色设置
下降趋势线颜色设置
接收图表提醒
接收应用通知
交易策略指南:
本交易策略结合了我开发的两个指标来确认交易信号——"RC ATR Based Trendlines"和"RC ATR Volatility Hedge Zones"。核心原则是必须两个指
FREE

Heiken Ashi Toggle – Instant Chart Mode Control for MT4 Heiken Ashi Toggle (Also spelled Heikin Ashi) is a small utility indicator for MetaTrader 4 that provides Heiken Ashi candles — with one key upgrade: instant ON/OFF control directly from the chart . Instead of constantly adding, removing, or reloading indicators, this tool allows traders to switch between standard candlesticks and Heiken Ashi visualization with a single click. What This Indicator Does Displays classic Heiken Ashi candles
FREE

CandleStick Countdown – 蜡烛剩余时间显示指标 CandleStick Countdown 是一款简单实用的 MT4 指标,能够实时倒计时当前蜡烛剩余的分钟和秒数,帮助提升交易时机的准确性,深受众多交易者欢迎。 主要功能 以“分:秒”格式显示当前蜡烛剩余时间 以文本形式显示在图表上,具有高可视性 显示位置自动调整,靠近当前价格,便于观察 支持自定义字体大小和文字颜色 兼容所有时间周期(从M1到MN) 使用亮点 一目了然蜡烛收盘时间,有助于进出场判断 非常适合短线交易者和剥头皮交易者,时间把控至关重要 提升交易精度,帮助避免过早进出场 参数设置 参数名称 说明 默认值 LabelColor 显示文本颜色 黄色 FontSize 文本字体大小 12 使用方法 只需将指标加载到MT4图表上,即可自动显示当前蜡烛剩余时间。LabelColor和FontSize可根据喜好调整。 注意事项 本指标仅用于信息显示,不包含自动交易或交易信号功能。 若在多个图表中使用,请分别加载至各图表。 若未显示倒计时,请尝试刷新图表或重启MT4。 本指标由 TOKYO-EA 开发并提供。欲获取
FREE

Special offer : ALL TOOLS , just $35 each! New tools will be $30 for the first week or the first 3 purchases ! Trading Tools Channel on MQL5 : Join my MQL5 channel to update the latest news from me SMC 是一种交易方法,帮助交易者识别流动性区域、机构订单位置以及关键市场转折点。通过利用 SMC 原则,交易者可以更有效地驾驭市场,找到最佳的进场和出场点。 SMC System 指标将这些概念自动化,使您能够快速标记图表上的关键价格行为元素,例如: 实时市场结构 (内部结构与摆动结构的 BOS / CHoCH) 订单区块 (多头与空头) 溢价区与折扣区 等高与等低 公平价值缺口 (FVG) 检测 多个时间框架中的关键高点与低点 MT5 版本在此查看: SMC System MT5 查看更多产品: 所有 产品 主要功能 SMC System 为 SMC
LINK : https://linktr.ee/ARFXTools ;
BBMA + SMC TRADING FLOW (Smart & Simple) 1. IDENTIFY THE MAIN TREND (Multi Time Frame) Use indicators: BBMA MTF PANEL (check trend direction on MN, W1, D1, H4) Only trade when D1 and H4 are in the same direction Example :
If D1 = Buy and H4 = Buy → Focus on Reentry Buy only 2. WAIT FOR CSA + CSM (Valid Entry Setup) CSA Buy : Candle closes outside lower Bollinger Band + MA5 low > MA10 low CSM Buy : Candle re-enters BB + MA5 low crosses above MA10
FREE

Fibomathe Indicator: Support and Resistance Tool for MT4 The Fibomathe Indicator is a technical analysis tool designed for MetaTrader 4 (MT4) that assists traders in identifying support and resistance levels, take-profit zones, and additional price projection areas. It is suitable for traders who use structured approaches to analyze price action and manage trades. Key Features Support and Resistance Levels:
Allows users to define and adjust support and resistance levels directly on the chart. L
FREE

Smart Liquidity Zones (SLZ) — Your All‑in‑One SMC/ICT Radar for MT4
Why SLZ? Tired of squinting at charts trying to spot liquidity grabs, break‑of‑structure candles and Fair Value Gaps before the smart‑money sharks do? SLZ turns your chart into a tactical map —drawing every high‑probability zone and screaming (politely) when price dives in. Core Edge Powered by a rule‑set distilled from Smart Money Concepts (SMC) and ICT mentorship material, SLZ auto‑marks: Component What it shows Why it
FREE
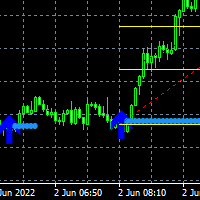
Here is the Double Arrow ArrZZx2 indicator that works best on 5 minutes time frame with Alerts. Good for pairs like NAS100, US30, GER30 and XAUUSD Your buy entry or Sell entry is on the second arrow of the Arr zzz You can confirm your second arrow with Fibonacci retracement levels the 50% level and the 61.8% which is the golden zone The double is good on strong trending markets look for the breakout on the second arrow Look at the screenshots for examples.

EMA Cloud System is a Trading System Invented by Ripster where areas are shaded between two desired EMAs. The concept that the EMA cloud area serves as support or resistance for Intraday & Swing Trading. Can be utilized effectively on 10 Min for day trading and 1Hr/Daily for Swings. Ripster utilizes various combinations of 5-12 EMA clouds 34-50 EMA clouds among others. 8-9, 20-21 EMA clouds can be used as well. Adjust what works for you. Ideally 5-12 or 5-13 EMA cloud acts as sold fluid Trendlin
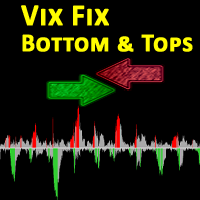
The VIX Fix is a volatility indicator developed by renowned trader Larry Williams. It's designed to measure volatility in assets that don't have options or futures, such as individual stocks and forex markets. Essentially, it acts as a synthetic VIX (Volatility Index) for any asset , providing a gauge of market uncertainty. This modified version of William's indicator helps you to find market bottoms and market tops. It comes with 2 styles: Stochastic and histogram style. Please see screenshot
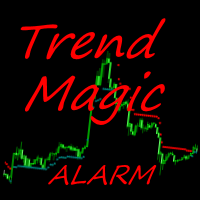
The Trend Magic Alarm shows the direction of a trend and indicates when it changes with a sound, popup window, push or email notice. Blue dots in the chart indicate an uptrend, red dots indicate a downtrend. Levels of former highs + lows give orientation in a chart. Trend Magic Alarm can draw these levels as lines in the chart, see inputs.
Input Parameters Counter : number of bars used for calculation PowerSet : shows how near to the bars the trigger dots are placed DotSize : size of the shown

交易实用必备工具指标 波浪自动计算指标,通道趋势交易 完美的趋势-波浪自动计算通道计算 , MT4版本 完美的趋势-波浪自动计算通道计算 , MT5版本 本地跟单复制交易 Easy And Fast Copy , MT4版本 Easy And Fast Copy , MT5版本 本地跟单复制交易 模拟试用 Easy And Fast Copy , MT4 模拟账号运行 Easy And Fast Copy , MT5 模拟账号运行 高级布林带: 1.布林中轨会随着方向变色 " 2.布林外轨扩张和收缩都会在外轨进行变色标识" 3.布林中轨计算方式可以选择任意均线,例如EMA" 4.同样可以选择任意价格应用模式进行计算" 强烈推荐趋势指标, 波浪的标准自动计算 和 波浪的标准自动计算MT5版本 "合作QQ:556024 " "合作wechat:556024" "合作email:556024@qq.com"
布林线(Bollinger Band) 是根据统计学中的标准差原理设计出来的一种非常实用的技术指标。它由 三条 轨道线组成,其中上下两条线分别可以看成
FREE

This indicator displays pivot points in the chart, including historical vales, and supports many calculation modes for Pivot Points and S/R levels. [ Installation Guide | Update Guide | Troubleshooting | FAQ | All Products ] It plots historical levels for backtesting purposes
It allows you to select the reference timeframe It implements different Pivot Point calculation modes It implements different SR calculation modes
It implements customizable colors and sizes
Calculation Modes The indicator
FREE

"The Squeeze indicator attempts to identify periods of consolidation in a market. In general the market is either in a period of quiet consolidation or vertical price discovery. By identifying these calm periods, we have a better opportunity of getting into trades with the potential for larger moves. Once a market enters into a "squeeze," we watch the overall market momentum to help forecast the market direction and await a release of market energy." The StdATR Squeeze Channel combines standard

Forex Meter Oscillator is an indicator that can give a whole view of forex market from a single chart, measuring currency strenghts among 28 forex pairs (majors and minors). The "oscillator" word is very meaningful: it normalizes currency strenghts in order to provide values in a predefined range (from -1 to 1).
What are normalization's advantages? It's so simple, values will always be in a pre-defined range that reflect exactly the current value compared to the last N values. In this way you w
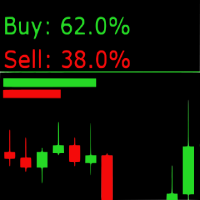
Sentiment Market Indicator: Real-Time Market Sentiment Display The Sentiment Market Indicator is a real-time MQL4 tool that displays current buy/sell sentiment directly on your MetaTrader 4 chart. Designed to support your technical analysis, it provides a visual representation of market positioning to help inform your decision-making process. Key Features Live Sentiment Display
View real-time percentage breakdowns of buy vs. sell sentiment. Customizable Alerts
Set specific thresholds for buy o
This indicator calculates support and resistance prices in multi-timeframe with different formulation and draw them on the chart that style do you choose. And If you want, Indicator can alert you when the current price arrive these pivot levels. Formulations: Classic, Camarilla, Woodie, Demark, Floor, Fibonacci
Alert Options: Send Mobil Message, Send E-mail, Show Message, Sound Alert
Levels: PP, S1, S2, S3, S4, S5, R1, R2, R3, R4, R5, TC, BC and Middle Points Why do you need this indicator:
Tim
FREE
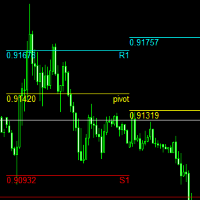
pivot points using by many traders and pivot levels most of the times are very helpfull . this indicator is a custom with internal parameters. it can show two times pivot (weekly and daily). you can choose periods total for each time showing pivots.( 1 week , 2 week ,...1day , 2day ,...) when use weekly and daily pivots , it can show you many support and resistance zones. if have proposal comment too me for upgrading indicator.
FREE
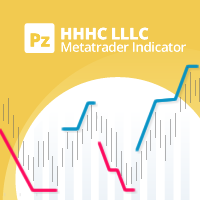
A personal implementation of a famous trend principle known as higher high, higher close, lower low, lower close (HHHC - HHHL). It uses price action alone to determine trend direction, trend changes and pullback zones. [ Installation Guide | Update Guide | Troubleshooting | FAQ | All Products ] Customizable breakout period Customizable colors and sizes It is non-repainting and non-backpainting It implements alerts of all kinds The indicator defines three price zones: Buy zones are blue Sell zon
FREE

Unleash Your Trading Potential with the Golden Fractal Cross Are you tired of second-guessing your trades? Do you wish you had a clear, reliable system to guide your decisions? Introducing the Golden Fractal Cross —a powerful and user-friendly indicator designed to help you spot high-probability trading opportunities. This isn't just another average indicator; it's a complete strategy that combines the precision of fractal patterns with the dynamic power of Exponential Moving Averages (EMAs). Th
FREE

G-Labs Market Maker Dashboard - Exclusive Seasonal Offer Elevate your trading with the original G-Labs Market Maker Dashboard, available for a limited time at just $70 USD. Ideal for starter traders, this dashboard has been enhanced with new features and now includes a comprehensive training video. This indicator is for people trading the market makers method and is the entry level dashboard for that strategy is available for both mt4 and mt5. its a market scanner in real time showing peak

This multicurrency strategy simultaneously determines the strength of the trends, entry points and the take profit levels for each trade. The indicator can determine entry points on any trading period from M1 to D1. For the convenience of users, the indicator renders the entry point (in the form of an arrow), recommended take profit levels (TP1, TP2, TP3) and the recommended stop loss level (SL1, SL2). The options for using the strategy are described below. Full description of the indicator Cosm

The indicator displays the probable ( Support and resistance ) levels. The indicator draws horizontal and trend levels of support and resistance. The indicator settings: Trends - the mode for displaying trend lines or horizontal lines of support and resistance Yes - display trend lines only No - display horizontal lines only UseResource - use the resources built into the indicator. Yes - use the ZigZag indicator from the resources of the product. No - use a custom ZigZag indicator. HistoryBar -
FREE

IceFX 点差监视器 是特别的点差日志指标,显示当前, 最小/最大和平均点差数值。 这些数值可视,即使在重启动之后也如此。同样, 点差监视器可以保存所有期望的点差值至 .csv 文件用于后期分析。
FREE

Buy Sell Magic AI – Dynamic Trend Line & Bollinger Bands for MT4 Buy Sell Magic AI is a professional indicator for MetaTrader 4 that combines the power of Bollinger Bands with a dynamic central midline that acts as a real-time trend line . It delivers clear entry signals, visual trend confirmation, and automatic Stop Loss placement—plus a built-in candle timer for precise trade timing. My indicators for free. I only ask that leave your feedback to help me improve them or as a thank you. Have
FREE
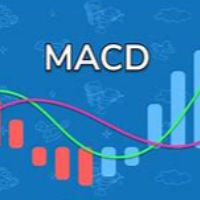
这是一个基于指数移动平均线(EMA)角度的自定义指标,通常用于测量EMA线的趋势角度。以下是关于该指标的主要参数和功能: 主要参数: md1 :EMA的快速周期,默认值为12。 md2 :EMA的慢速周期,默认值为26。 md3 :MACD信号线的周期,默认值为9。 功能: 该指标计算了MACD指标,并根据MACD主线的方向和角度将数据划分为不同的顶点。 UpBuffer :用于存储MACD主线上涨的值,对应于绿色柱子。 DownBuffer :用于存储MACD主线下降的值,对应于红色柱子。 ZeroBuffer 黄色:用于存储MACD主线接近零的值,对应于柱子。 SigMABuffer :用于存储MACD信号线的值。 功能描述: 该指标在计算时,会比较MACD主线和信号线的数值来确定柱子的颜色和位置。 如果MACD主线大于零且大于信号线,则柱子将为绿色的,放置在 UpBuffer 平面图上。 如果MACD主线小于零且小于信号线,则柱子将是红色的,放置在 DownBuffer 平面图上。 如果MACD主线接近零,则柱子将为黄色的,位于 ZeroBuffer 平面图。 指标将在独立窗口
FREE

概述:
彩色抛物线 SAR 指标 是一种视觉增强的交易工具,旨在简化趋势跟随和交易识别。这个可定制的指标通过图表上颜色编码的信号为多头(买入)和空头(卖出)趋势提供清晰的视觉提示,直接在您的 MT4 图表上显示。 主要特点: 颜色编码信号: 买入信号使用亮绿色 "o" 符号显示。 卖出信号使用红色 "o" 符号显示。 可自定义输入: 可调整的步长(Step)和最大值(Maximum)参数,用于精细调整抛物线 SAR 的计算。 可自定义线条宽度和颜色,以适应您的交易风格和图表外观。 简单且有效的可视化: 通过清晰的符号轻松识别多头和空头趋势,这些符号显示在价格蜡烛上方或下方。 让您一目了然快速评估市场状况。 兼容性: 支持所有 MT4 可用的交易品种和时间框架。 适合谁使用? 寻找将抛物线 SAR 简单集成到交易策略中的交易者。 适用于趋势跟随策略,或作为其他指标的确认工具。 输入参数: 步长(Step): 定义抛物线 SAR 的灵敏度(默认值:0.02)。 最大值(Maximum): 设置指标的最大值(默认值:0.2)。 线宽(Line Width): 调整绘制信号的线条厚度。 上涨
FREE
High Low Cloud Trend指标是一种基于通道的技术分析工具,通过自适应价格边界识别趋势方向和均值回归机会。该系统通过计算指定回溯期内的最高高点和最低低点来运作,创建定义整体价格区间的外部通道边界。次级内部通道使用较短周期(主回溯期的四分之一)来捕捉更广泛区间内更即时的价格波动。该指标的核心逻辑通过将收盘价与参考值进行比较来确定趋势方向,该参考值根据价格触及这些极值的位置在最高点和最低点之间翻转 - 当价格触及最低低点时,参考值切换到最高高点,反之亦然。这创建了一个二元趋势状态,指标以填充直方图或线条的形式显示下通道(上升趋势)或上通道(下降趋势)。均值回归检测机制识别特定的交叉模式,即价格在触及外部边界后向内部通道回移,生成指向潜在反转入场点的箭头信号。双时间框架通道方法结合基于翻转的趋势逻辑,使该指标在区间震荡市场中特别有效,同时仍能捕捉趋势性走势,并为趋势变化和均值回归设置提供可自定义的警报。

Time Range Separator is a useful tool to display a separator period on your platform. You could go in the properties of the indicator, select the desired range and that's ALL. We believe it is a useful and necessary that we wish to share with you for free all our followers.
Input Values: TimeFrame Period Separator GMT_Hour (ex. +1 or -1) to move the lines at Period Time +/- tot hours in input Hide_dates to show or hide the datetime on vertical lines VLine_Color = Vertical Color Line VLine_Style
FREE
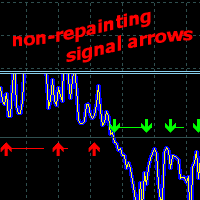
Price Direction Oscillator - 款用于监测短期和中期市场走势的指标。它适用于任何市场和时间框架。
它包含一条趋势线、- 个市场波动率震荡指标和一个潜在的交易信号生成器。
指标用途
它根据市场波动率判断趋势,并提供开立买入或卖出订单的信号。 信号箭头无需重新绘制历史数据,颜色保持不变,并会在K线图收盘时显示。 根据信号,预测的价格走势将以线条形式绘制。 在M1-M5时间框架下,该指标适用于剥头皮交易,在其他时间框架下,则适用于中期交易。 该指标始终位于价格图表底部,不会造成价格图表过载。 提供多种警报类型。
它可以作为独立指标使用,也可以作为辅助工具,减少技术分析中的不确定性。输入参数允许交易者自定义指标,根据时间框架和各种交易工具调整趋势周期和市场噪音平滑。 For M1 and M5 timeframes, increase the "Noise Smoothing" parameter.
For XAUUSD and other highly volatile instruments, multiply the "Noise Smoothing" v

Sniper Entries AI is a powerful, intelligent indicator designed for traders seeking precise entry points at potential market reversals. Leveraging advanced AI algorithms, this tool analyzes price patterns across multiple timeframes, allowing traders to stay informed of trend shifts, no matter the scale of their trades. Key Features of Sniper Entries AI: High-Precision Reversal Signals : The indicator scans market movements to identify precise reversal points and continuation, giving you a compe

The EasyTrend is a seemingly simple but quite powerful trend indicator. Everyone has probably come across indicators or Expert Advisors that contain numerous input parameters that are difficult to understand. Here you will not see dozens of input parameters, the purpose of which is only clear to the developer. Instead, an artificial neural network handles the configuration of the parameters.
Input Parameters The indicator is as simple as possible, so there are only 2 input parameters: Alert - i
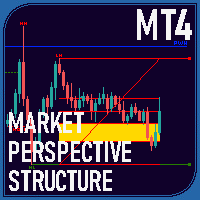
Overview The Market Perspective Structure Indicator is a comprehensive MetaTrader indicator designed to provide traders with a detailed analysis of market structure across multiple timeframes. It identifies and visualizes key price action elements, including swing highs and lows, Break of Structure (BOS), Change of Character (CHOCH), internal structures, equal highs/lows, premium/discount levels, previous levels from higher timeframes, and trading session zones. With extensive customization opt
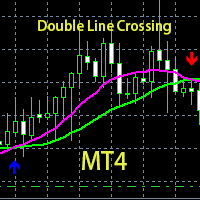
这是基于双均线交叉和箭头标识下单的自定义指标。 当出现蓝色箭头向上时做多单。 当出现红色箭头向下时做空单。 当粉红色线向上穿过绿色线交叉时,粉红色线在上方,绿色线在下方,出现金叉,会出现蓝色箭头。 当粉红色线向下穿过绿色线交叉时,粉红色线在下方,绿色线在上方,出现死叉,会出现红箭头。
这是经典的双线交叉金叉死叉很好的实现,并且用箭头标识出下单点,准确率较高,然后编写出来根据线颜色和箭头很好标识下单方向的指标,无时间,货币对限制。 当前指标最好在30分钟,1小时,4小时上工作,效果较好。 当前指标不建议用在1分钟或5分钟或15分钟或1day以上时间周期,虽然然指标是无限制的,但是效果不太好。 本指标工作平台最好选择点差比较小的交易商。 由于外汇交易是24小时运行,手工下单的话容易受到个人时间和情绪的影响,如果时间不够多的话,建议选择我基于当前指标编写的EA来交易。 基于当前指标编写的EA:https://www.mql5.com/zh/market/product/37133
FREE

SMARTMASS INDICATOR This indicator is different from all known volume indicators. It has a significant distinction; it is an algorithm that relates price movement to volume, attempting to find proportionality and efficient movement while filtering out noise and other movements that are more random and do not follow a trend or reversal. Ultimately, it reveals the true strength of the movement, indicating whether it has genuine support from bulls or bears or if it's merely a high-volume movement

The Keltner Channel is a volatility-based technical indicator composed of three separate lines. The middle line is an exponential moving average (EMA) of the price. Additional lines are placed above and below the EMA. The upper band is typically set two times the Average True Range (ATR) above the EMA, and the lower band is typically set two times the ATR below the EMA. The bands expand and contract as volatility (measured by ATR) expands and contracts. Since most price action will be encompasse
FREE

Introduction To Time Box Indicator Time Box Indicator is a must have indicator for any trader. It will display daily, weekly and Monthly box according to your preferences. Yet, you can extend any important price levels in your chart automatically. You can use them as the significant support and resistance levels. It is very simple but effective tool for your trading.
Graphic Setting Use White Chart Line Style for Current Open price
Daily Setting Update Timeframe for daily box Number of days to
FREE

The indicator looks for consolidation (flat) in the market at a certain time, builds a box-channel and marks levels indented from it for a breakdawn. After crossing one of the levels, the indicator marks the zone for take profit and calculates the corresponding profit or loss in the direction of this entry on the panel. Thus, the indicator, adjusting to the market, finds a flat area of the market, with the beginning of a trend movement to enter it. Version for MT5: https://www.mql5.com/en/market
FREE
沉浸在适应性与精确性相结合的交易环境中。Dynamic Grid Pro v1.7 提供一套旨在优化您市场交易方法的工具。 该系统的开发旨在为网格交易策略的执行提供一个灵活的框架。其核心功能在于能够根据不断变化的市场条件动态调整网格参数。 Dynamic Grid Pro v1.7 的特点: 动态网格: 系统根据波动性和价格变动自动调整网格水平,旨在优化订单执行。 订单管理: 允许精确控制网格内订单的下单和管理,提供多种配置选项。 多种入场策略: 集成不同的订单入场方法,为实施您的策略提供灵活性。 可自定义设置: 提供广泛的可调参数,以使系统适应您的偏好和交易风格。 信息面板: 显示有关网格和仓位的相关数据,方便监控和决策。 MetaTrader 集成: 旨在 MetaTrader 平台内无缝运行,充分利用其功能和工具。 Dynamic Grid Pro v1.7 致力于成为您交易旅程中的盟友,提供有条不紊且适应性强地实施和管理网格策略所需的资源。探索其功能,了解它如何融入您的工作流程。

Note : New in 1.6: the indicator now exports the trade signal (but not displayed). Go long with light blue. Go short with red. Exit otherwise. Signal to be imported to your EA using iCustom. This indicator provides Best of the Best linear filter momentum oscillators that I am aware of (Low Pass Differentiators, LPD's) . All of them are recent developments by this developer, or other researchers. The oscillator line is the first buffer of the indicator, and can be called in other indicators or
FREE

Key Levels + Zones
Indicator cleanly displays even numbered price levels: “00s” and “50s” . Additionally, you can display “Mid-Lines” which are preset distance levels on both sides of the even numbered price levels (set to 12.5 pips by default). This 25-pip zone that straddles each even numbered price relates to where many traders place their stops and therefore can be a risk “Zone” to steer clear of when placing your stops. The zone also acts as support and resistance. Indicator p rovide
FREE
Our modernized version of the popular channel TMA_TRUE indicator for MT4, which provides information on the main points of trend reversal and momentum exhaustion by drawing a channel on the chart, also draws arrows of signals for buy and sell. As a result, traders can identify bullish and bearish price reversal zones and BUY and SELL accordingly.
This indicator works well on all instruments and on all Timeframes.
This indicator is the basis of our Channel Trigger EA, which you can buy in MQL
FREE

The indicator displays overbought and oversold levels, calculating them using the Fibonacci golden ratio formula.
It enables both trend-following and counter-trend trading, accommodating breakouts and rebounds from these levels.
It operates on all timeframes, across various currency pairs, metals, and cryptocurrencies.
Suitable for binary options trading.
Key Features: Based on the Fibonacci golden ratio Shows overbought and oversold levels Suitable for market and pending orders Simple
FREE

Simple ATR Stop Loss :您的市场波动性指南针,帮助您在交易的险恶水域中航行,设置更智能的 止损 ,让您看起来像个交易忍者(不包括斗篷)。 注意了,所有交易爱好者和市场专家! 看这里, Simple ATR Stop Loss 指标 - 您在疯狂交易世界中的新好朋友。 它比两块拼图还简单,但比瓷器店里喝了咖啡的公牛还强大。 ATR交易秘笈(或如何在市场浪潮中冲浪而不翻船)️: ATR:您的市场情绪解码器 ️️ 把ATR想象成市场的推特feed。高数值?它正在疯狂发推。 低数值?它处于静音模式。 使用这些情报来决定是否要入场或在岸边观望。️ 正确调整规模和瞄准 让ATR成为您的交易裁缝和目标练习教练。 它会帮您避免那些感觉像穿着弟弟妹妹衣服的仓位,和那些像在后院找独角兽一样不切实际的目标。 变色龙交易者宣言 更新您的ATR要比查看手机还频繁。认真的。 当市场曲折时,您要直行。当它直行时,您要...好吧,您明白了。要像迪斯科舞厅里的变色龙一样适应。 乘数:您的秘密武器
FREE
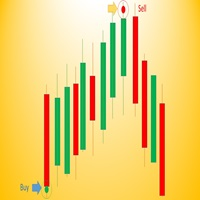
Wave Entry Alerts In Gold is a custom indicator developed by Azad Gorgis for MetaTrader 4. This indicator is designed to provide alerts based on ZigZag patterns, specifically tailored for trading on the Gold (XAU/USD) symbol.
Key Features: - Chart Window Indicator: The indicator is designed to be displayed on the main chart window. - Arrow Signals: The indicator generates arrow signals on the chart, indicating potential reversal points based on ZigZag patterns. - Customizable Parameters: Trade
FREE
Squeeze Momentum Alert (挤压动能指标) 1. 识别价格“爆发”点 (The "Squeeze") 该指标最大的优势在于能够捕捉市场在大幅波动前“盘整”或“积蓄能量”的时机。 优点: 市场总是在平静(盘整)和剧烈波动(爆发)之间交替。该工具会告诉你: “现在图表正在剧烈挤压,准备好迎接下一次大行情” ,让你不会错过大趋势的起点。 2. 详细区分趋势“强度” (Color Coded Momentum) 柱状图不仅告诉你价格涨跌,还使用 4 种颜色 来指示趋势的健康状况: 亮绿色 (Lime): 强劲上涨(适合追涨)。 深绿色 (Dark Green): 上涨疲软(警示:动能减弱,准备锁定利润)。 鲜红色 (Red): 强劲下跌(抛压重)。 暗红色 (Maroon): 下跌疲软(卖盘动能耗尽)。 优点: 帮助你在趋势强劲时知晓**“入场” 时机,并在颜色改变(动能减弱)时立即 “离场”**,快于价格反转。 3. 过滤震荡市场的假信号 (Noise Filtering) 在无趋势或窄幅震荡期间,该工具会显示 "Compression" (挤压) 状态。 优点: 防止你
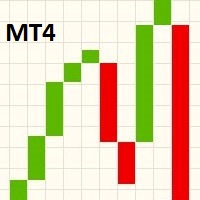
这款指标在主图表窗口里显示一个线突破图表。 为了在主图表窗口里查看线突破图表自己,在主图表窗口里显示一个线突破图表,之后按 F8 在属性对话框里改变 "线图表" 颜色为 "无"。当滚动, 缩放或改变图表的时间帧, 指标将在下一个报价来临时调整积木大小以适合主图表视野。 线突破图表发明于日本,类似于点数图表和 Renko 图表。一位日本交易员描述三线突破图表为 "点数图的更微妙的形式,由市场决定反转而非随意的规则"。线突破图表忽略时间,并仅在收盘价格移动了一定数量后改变。这些图表显示一序列大小变化的垂直线 (或 "积木") (Renko 使用固定积木大小)。绿色积木 (传统的白色) 代表价格上升, 红色积木 (传统黑色) 代表价格下跌。积木在同一方向上连续,直到必要的反转。 当收盘价超过了前期 "X" 根线的最高或最低时,会发生逆转。传统上,"X" 为 3;这个指标允许让您设置不同数量,令您在分析价格走势时更灵活。在网络上有大量资源描述如何构造并使用线突破图表。 还 (选项) 显示了一个 "序列频率" 直方图。直方图显示一系列高低点的分布频率,这些点是过去生成的 "X" 方向的变化。直方
FREE
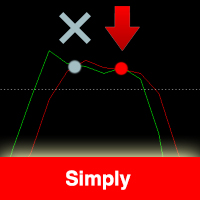
The indicator is based on the Stochastic indicator. I also recommend to see my EA Night Zen Strategy: It contains a strategy for crossing the K and D lines in the overbought (for sales) and oversold (for purchases) zones. The indicator gives a signal at the second intersection.
The signals are not rewritten, they appear after confirming the intersection of the K and D lines.
Settings: Stochastic Indicator Settings Indicator period Notification and Alert Settings
FREE
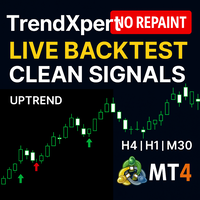
TrendXpert Indicator v1.02 – Master the Trend, Trade with Precision Overview
TrendXpert v1.02 is a precision tool built for serious traders who want to stay on the right side of the market. Designed specifically for the 4H, 1H, and 30M timeframes, it helps you identify high-probability trend conditions and delivers timely, clean trade signals—without clutter or confusion. What’s New in v1.02 Enhanced Trend Detection : Improved internal logic ensures even greater accuracy in trend labeling and
FREE

''Trendlines'' is an Indicator, that every Trader need and shows Trendline and Support and resistance levels in all Timeframe's. Also In 1-hour, 4-hour and daily time frames and Current timeframes, support, and resistance levels are specified and trend lines are drawn so that the trader can see all levels on a chart. In Properties it is possible to turn off unnecessary Lines.
In ' Tendency indicator '' , as full package of Predictions that every Trader need, there is also the Predict
FREE

Description
SuperCCI is an indicator based on the standard CCI indicator. It identifies and displays convergences/divergences in the market and forms the corresponding entry points. Also, using the trading channel index, it determines the direction of the trend and displays the levels of support and resistance .
Features Not repaint. Shows entry points. Shows the direction of the current trend and support/resistance levels. Has notifications. Recommendations
Use convergence/divergence to ide

Cyber Engulf Indicator - Professional Trading System for MetaTrader 4 What is the Indicator?
Cyber Engulf is an advanced technical analysis indicator that detects engulfing patterns filtered by moving average. It identifies trend reversal points, helping you spot changes in market structure early. What Does It Do? Automatically identifies engulfing candlestick patterns Filters out false signals using moving average Displays buy and sell signals with blue/up and red/down arrows Works across mult
FREE

This is a modified Fractals indicator. It works similar the original Bill Williams' indicator, and is additionally enhanced with the possibility to change the top radius, in contrast to the standard radius of 2 bar. Simply put, the indicator checks the top and if it is the minimum/maximum in this radius, such a top is marked by an arrow. Advantages Adjustable radius. Use for drawing support and resistance levels. Use for drawing trend channels. Use within the classical Bill Williams' strategy or
FREE
Multi-Oscillator 是进行多币种和多时限交易的终极瑞士军刀。它在单个图表中绘制了许多货币对和/或时间框架的期望指标。它可以用来进行统计套利交易,市场筛选工具或完善的多时间框架指标。 [ 安装指南 | 更新指南 | 故障排除 | 常见问题 | 所有产品 ] 易于解释和配置 支持16个知名指标 它最多可以在图表中显示12个货币对 它还可以显示单个乐器的多个时间范围 符号和时间范围可在输入中自定义 可定制的振荡器指示器设置 可自定义的颜色和尺寸 为了提供广阔的市场前景,可以使用不同的振荡器在同一张图表中多次加载该指标,而不会产生干扰。该指标支持以下振荡器: RSI CCI ADX ATR MACD OSMA DEM指标 随机 动量 力指数 资金流量指数 平衡量 很棒的振荡器 相对活力指数 加速器振荡器 威廉姆斯百分比范围 该指标提供了无与伦比的潜力,因为每个缓冲区都可以绘制您所需的振荡器,符号和时间范围的组合,而与其他缓冲区或图表的本地时间范围无关。您可以为您的多种货币和多种时间框架策略中的每一种创建图表模板,而不管其外观如何复杂。 以下屏幕截图说明了指标的基础以及一些示例使
FREE
The indicator represents the session boxes for the Asian, European and American sessions. It is possible to change the time of each session, such as color. It is also possible to disable the display of each session. You will find in input parameters variables to modify time sessions in format hh:mm and the color of boxes of each sessions. If you need some implementations please contact me.
FREE

The " Countdown Candle Timer " indicator is a visual tool for the MetaTrader 4 platform that displays an accurate countdown of the time remaining until the next candle on the chart. It provides real-time information about the remaining duration of the current candle, allowing traders to track time precisely and optimize their trading decision-making. The indicator can be customized in terms of color, font size, and position on the chart, providing flexibility and convenience to the user. You can
FREE

. Simple Trading System Update !!! Follow this link to see our Strategy !!! (With auto trade indicator)
Description This is an indicator Free Version and showing only history signals, Not real time. Binary Deal Trading Indicator is an indicator on MT4 for Binary Option Trading. It forecasts the overbought / oversold level, Reversal and Fractal point. This indicator will help you to decide a reversal price on any time frame (Recommend M1, M5 and M15). The expiry time is 5-15 minutes after rec
FREE

Support and resistance levels are the key factors that determine the price movement from one zone to another. They are levels for trend reversal/breakout signals forex traders look out for before making a trade decision. The Support and Resistance Indicator is a custom trading tool for MT4 developed to plot support/resistance zones from past price actions. The indicator also helps a trader evaluate optimal zones to place a BUY/SELL order or to exit a trade. In other words, it assists traders to
FREE
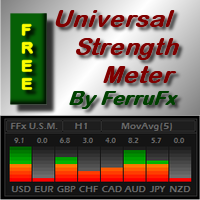
PRO version is available here: https://www.mql5.com/en/market/product/12648 FFx Universal Strength Meter is more than a basic strength meter. Instead of limiting the calculation to price, it can be based on any of the 19 integrated strength modes + 9 timeframes. With the FFx USM, you are able to define any period for any timeframe. For example, you can set the dashboard for the last 10 candles for M15… Full flexibility! Very easy to interpret... It gives a great idea about which currency is weak
FREE


This Weis Wave Volume indicator is a tool to help traders identify the current price trend. Understanding volume can provide insight into a market's behavior to help you determine its overall health. The most important rule is this: volume precedes price. Typically, before a market price moves, volume comes into play. It has 2 main colors histogram which are green and red. – Green indicates an upward wave. The more the price increases, the bigger the green volume gets. – The red color shows a d
FREE

Descption: The Volume Profile displays detailed informations of historical trading activities at certain price levels (Market Profile). So you can locate the areas with the best prices in the market and get an advantage about other market participants.
Features: Customizable Volume Profile / Market Profile Shows the "fair" Value Area with 70% of all Volume
Shows critical low volume zones
Shows VPOC, VAL and VAH Points Works on all timeframes Also available for MT5 ( https://www.mql5.com/en/mark
提升您的交易优势,使用 Super Woodies CCI Indicator MT4,这是一个先进的动量振荡器,受肯·伍德著名的 Woodies CCI 系统启发,该系统在 2000 年代初因其双 CCI 方法用于发现循环模式和高概率设置而在日内交易者中流行。广泛受到外汇、股票和商品交易者的青睐,这个指标利用 Commodity Channel Index (CCI) 来检测超买/超卖状况、趋势延续和反转,社区论坛如 Forex Factory 和 TradingView 强调其在减少虚假信号方面的有效性——通常通过清晰的视觉提示如 Zero Line Rejects 和 Trend Line Breaks 将胜率提高 15-25% 在基于动量的策略中。其持久吸引力在于简化复杂的市场动态,在波动会话中启用精确入口,同时最小化情绪交易,使其理想用于剥头皮者、波段交易者和寻求强劲趋势强度确认的自动化系统。 Super Woodies CCI Indicator MT4 显示白色 CCI 线(默认周期 100,典型价格)用于核心动量,黄色 Turbo CCI (TCCI) 线作为平滑 LW

提升您的交易精度,使用 WaveTrend Oscillator Indicator MT4,这是一个基于动量的工具,改编自 LazyBear 于 2014 年在 TradingView 上标志性的脚本,以其在发现市场反转和动量转变方面的准确性而闻名。十多年来在交易社区广受赞誉,这个振荡器结合了类似于 RSI 和 MACD 的元素来检测超买/超卖状况,使其成为外汇、加密货币、股票和商品交易者的必备工具。其受欢迎程度源于可靠的交叉信号,这些信号在波动市场中过滤噪音,帮助用户利用趋势反转和强度,同时最小化假突破——适合寻求高概率入场的剥头皮、日内交易和摇摆策略。 WaveTrend Oscillator Indicator MT4 通过动态线(主振荡器的绿色)可视化动量,该线与信号线(红色虚线)互动,超买带(红色 60/53)和超卖带(绿色 -60/-53),辅以用于发现背离的直方图和清晰的买卖箭头提示。绿色箭头在振荡器低于超卖水平上方交叉信号时信号潜在买入,而红色箭头在超买区上方向下交叉时指示卖出。好处包括早期反转检测以锁定利润、动量评估以确认趋势,以及可自定义警报以无需屏幕时间快速行动

The tool is used to calculate the size of the position that can be opened with the previously assumed risk. The risk can be defined as: percentage value of the account (%), nominal value, expressed in the account currency. The size of position is determined by the distance of the planned SL (red line).
Input Parameters Lost_in_Money - if true, the value of the acceptable loss is determined by the parameter "Acceptable_loss", else acceptable loss is determined by the parameter "Acceptable_Risk_P

一目均衡多货币扫描仪表板 MT4 是一款功能强大的交易工具,旨在使用一目均衡表(Ichimoku Kinko Hyo)监控多个货币对和时间框架。它以网格格式组织信号,符号按基础货币和时间框架分组,范围从 M1 到 MN1。交易者可以启用或禁用特定时间框架以适应他们的策略。 该工具根据以下策略显示信号: Kijun Cross Strategy: 价格与均线(Kijun-sen)交叉时生成信号。
Kumo Breakout Strategy: 基于价格突破云(Kumo)的信号。
Chikou Span Confirmation Strategy: 使用迟行线(Chikou Span)确认信号。
Tenkan-Kijun Cross Strategy: 基于转换线(Tenkan-sen)和均线(Kijun-sen)交叉的短期信号。
Kumo Twist Strategy: 识别云(Kumo)的扭转以预测反转。 MT5版本可在此处找到: Ichimoku Cloud Multicurrency Scanner MT5 详细文档请点击此处: 文档 主要功能: 一目均衡集成:仪表板包含可定制的一
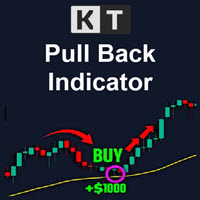
KT Pull Back Arrows 指标通过 RSI(相对强弱指数)在超买和超卖区域内识别合适的回调入场区域,并显示回调箭头。该指标利用 RSI 阈值,有效地识别出适合开启回调交易的有利时机。 趋势交易被认为是外汇市场中最具盈利性的策略之一,它相当于顺势而为,借助市场动能乘风破浪。然而,时机至关重要。若入场过晚,可能就像从悬崖跳下,不仅风险巨大,还极可能触发止损。 这正是趋势回调交易发挥作用的地方。但预测回调的深度从不是一件容易的事。即便借助斐波那契回撤工具,准确找出入场点依旧如大海捞针。现在,有了这个指标,一切将向着有利方向发展。
功能亮点
可自定义 RSI 数值,以适应不同交易品种和时间周期的回调识别。 可用于多头和空头交易。 通过分析回调幅度与整体市场趋势的关系来判断趋势方向。 适用于交易平台提供的任何品种,包括外汇、黄金、白银、指数、期货、股票等。
使用技巧 可与其他技术指标结合使用以提高准确性,例如结合支撑阻力位可更好确认趋势方向。 在高波动市场中,可调整 RSI 设置或尝试不同输入值来优化交易效果。 为最大化收益并降低风险,请确保每笔交易都具有良好的盈亏比,合理

KT MACD Alerts 是 MetaTrader 中标准 MACD 指标的个性化实现。它在以下两个重要事件发生时提供提醒并绘制垂直线,以帮助交易者更轻松地识别交易信号: 当 MACD 指标向上穿越零轴线时。 当 MACD 指标向下穿越零轴线时。
功能亮点 内置多周期扫描器,可在所有时间周期中显示 MACD 的方向变化,帮助交易者实现多周期共振分析。 非常适合关注 MACD 穿越零线交易信号的趋势跟随型交易者。 除了提供声音、图表、邮件等提醒方式外,还会在图表上绘制清晰的垂直线,方便快速定位交叉点。 本指标采用轻量级代码编写,占用资源少,运行流畅不卡顿。 全面支持 MetaTrader 的所有默认提醒系统,适用于不同交易场景。
MACD 的由来与发展 MACD,全称为移动平均收敛背离指标(Moving Average Convergence Divergence),是一种经典的技术分析工具,广泛用于分析股票、外汇和加密货币等市场。由 Gerald Appel 在1970年提出,MACD 能有效识别趋势的变化、强度与持续时间,是交易者不可或缺的趋势型指标之一。

VR 网格指示器 设计 用于创建具有用户定义设置的图形网格。与 标准网格 不同,VR 网格用于构建 圆形关卡 。根据用户的选择,轮次级别之间的步长可以是任意的。此外,与其他指标和实用程序不同,即使时间段发生变化或终端重新启动,VR Grid 也能保持网格的位置 。 设置、设置文件、演示版本、说明、问题解决,可以从以下位置获取 [博客]
您可以在以下位置阅读或撰写评论 [关联]
版本为 [MetaTrader 5] 垂直级别 基于实际时间间隔并 忽略缺失 或不存在的周期。因此,级别之间的步长严格对应于用户选择的值。 使用 VR 网格指标时,交易者 可以更改任何级别的垂直线和水平线的样式 、颜色和粗细。这使您可以控制金融工具的 回合水平 。 整数位是 以两个或多个零结尾 的价格(例如:1.23500、5.65900、1923.200)。人们相信,这样的水平 经常充当 作为支撑或阻力的强点。 Horizontal line settings Horizontal line step Horizontal line color Horizontal line style Horizonta
FREE
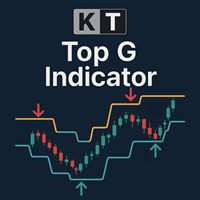
KT Top G 是一款基于价格行为的指标,它结合了智能通道分析来识别潜在的市场顶部和底部。当检测到可能的反转时,它会在图表上绘制醒目清晰的箭头,提前向您发出市场可能转向的信号。 大箭头: 通过识别价格衰竭和动量变化,标记出高概率的市场顶部和底部。 小箭头: 表示较低概率的转折点,这些位置通常在真正反转之前就会被突破。
功能特点 广泛兼容性: 可用于所有外汇货币对,也适用于指数、股票和ETF等其他交易品种。 多时间周期优化: 在M1和M5表现出色,适合剥头皮交易;在H1、H4和D1也能很好地支持波段交易。 内置中线通道: 除了箭头,指标还显示动态价格通道和中线,帮助您理解市场当前的区间与趋势方向。 不重绘: 一旦箭头出现在图表上,它就不会消失或改变,确保每个信号的可靠性。 适应波动行情: 可调节的长度和平滑因子,让您更好应对不可预测或快速波动的市场环境。 独立提醒: 大箭头与小箭头分别设有提醒,您可根据自身的风险偏好做出反应。 支持所有MT提醒: 提供弹窗、声音、邮件、推送等多种即时通知方式,确保不错过任何交易机会。
总结 许多交易者在将 Top G 添加到交易系统后,胜率明显提高
MetaTrader市场是 出售自动交易和技术指标的最好地方。
您只需要以一个有吸引力的设计和良好的描述为MetaTrader平台开发应用程序。我们将为您解释如何在市场发布您的产品将它提供给数以百万计的MetaTrader用户。
您错过了交易机会:
- 免费交易应用程序
- 8,000+信号可供复制
- 探索金融市场的经济新闻
注册
登录