适用于MetaTrader 4的技术指标 - 97
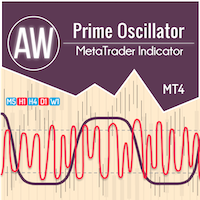
两个振荡器的组合。第一个显示入场点,第二个显示当前趋势。该指标可以通过两种模式的箭头显示振荡信号,所有快速振荡信号或仅在当前趋势方向的信号。它具有多时间范围面板和三种类型的信号通知。 好处: 适合当日交易和倒卖交易 趋势过滤 简单而灵敏的设置 多时间框架面板 适合融入顾问。 适用于任何交易品种和任何时间范围 三种类型的通知 MT5 version -> HERE / Problem solving -> HERE 指标策略 该指标由两个不同的振荡器组成: 慢趋势线(粗) - 当指标的最高水平从上到下交叉时,它是下降趋势的指标,当较低的水平水平(指标的低水平)从下到上交叉时,它是下降趋势的指标上升趋势。此外,在较低区域找到一条慢线表明当前趋势是下降趋势,反之亦然,在上方区域找到一条慢线表明当前趋势是上升趋势。这就是该指标确定当前市场趋势的方式。 快速入场线(细):识别从下到上与下线相交处的入场点,这是买入信号,在从上到下穿越上线时,这是卖出信号。除了振荡线之外,调整指标线也很重要,因为这会影响信号的数量和准确性。 本产品使用不同的振荡器来显示慢线和快线,每个振荡器必须单独调整。

Trend and Signals indicator scans 30 trading Instruments (Forex, Metals and Indices). It uses special algorithm on the current market based on Pure Price Action and display the overall trend and signal on the dashboard. When signals are produced the indicator sends alert and notification. Strategy for Signals This indicator uses the daily timeframe to determine the direction of the trend. The hourly timeframe is used to identify possible entries. Main trend and is determined by strong Bull
This Indicator can help you to identify your entry. Enter when the arrow appears. The Indicator shows you as well the trend direction. you can see at the attached image the profit you would have made. If the trend goes against you it shows the minus pips. The Indicator is working on all frames and all pairs. Please consider carefully before you enter as the FX Market is unpredictable.

Besides signals in form of Percent on the chart, the system also gives MT4 alerts when an entry signal is generated.
The original rules of the system say that you should simply follow the signals. However, if trading would be really that simple then you could simply program an expert advisor based on the mechanical signals of this system.
But as every experienced trader knows, trading is not that simple. The real edge will come from the trader who uses the system. With time the trader has sh

Akendicator X is a Non-repainting Indicator for trading at 5-15 minutes Timeframe. Akendicator X extimates with clear arrows, in which direction the next candlestick will move. Pratically, when the length of the last candle reaches and exceeds a particular value (called Candle Power) immediately, after its closing, an arrow appears indicating whether the next candle could be Bullish or Bearish. I created a manual in pdf where you should learn exactly how to use AKENDICATOR X correctly; I will s

SETIS TREND FILTER is a multi timeframe sophisticated MT4 indicator, created by french professionnal traders and quants experts , in order to detect the best trades for any markets (forex, commodities, indexes, stocks, cryptos and so on...)
Quantums France , is a french start-up, that codes advanced trading solutions, both for retails such MQL4 indicators but also python experts advisors for sophisticated investors.
This indicator does not repaint and actualize its functions in realtime .
Th

LE Oscillator - индикатор предназначенный для поиска локальных экстремумов, определения текущей тенденции. В расчетах индикатора используется авторская методика. С помощью индикатора можно определять места возможного разворота цены желательно в направлении тенденции, но также с достаточной точностью и против нее. Также с помощью индикатора можно определять текущую тенденцию. Индикатор подходит для любых валютных пар, но для адекватного отображения показания необходимо, чтобы было достаточно ис
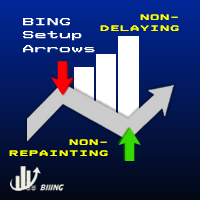
***** The REAL , ORIGINAL, Non-Repainting, Non-Delaying, Arrow Trade Entry indicator for Very Low-Risk market execution *****
***This is the Golden standard in arrow indicators for MT4.*** BING Setup Arrows Indicator(BSA) will show easy-to-read High Probability trading situations with Non-Repainting , Non-Delaying , Up or Down arrows on the graph. So simple, it's brilliant. Always shows very good trading setups, no flashy colors, confusing configurations, hard-to-read dashboards, etc. Perfec
Индикатор производит поиск различных паттернов и сортировку рыночной информации.
Полученную информацию фильтрует и выводит на экран, обновляя ее с заданной периодичностью.
Имеется возможность сохранять собственные списки инструментов.
Имеет сортировку по:
названию инструмента; типу инструмента; по диапазону значений от N до M; выделенным в ручную маркерам;
Важно!!! Индикатор спроектирован так, чтоб была возможность
добавлять новые паттерны и значения для сортировки.
Если вам необходим поиск
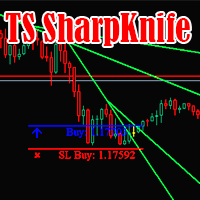
The SharpKnife trading strategy is formed into one indicator. The indicator informs with a message (Alert or mail) about the need to make deals.
Check it out in the strategy tester right now! Support: https://www.mql5.com/en/channels/TrendHunter The indicator is completely ready for operation immediately after installation.
Can be used on any trading instrument.
Recommended for use on timeframes 1H and higher. Settings: Signal Trend direction - Alert of the trend direction; Number of last si

The Signal Point Channel indicator predicts the most likely short-term price movement based on complex mathematical calculations. One of the biggest challenges traders face is finding a trading system that's right for them. This indicator is designed to detect trends in price movement and allows you to quickly determine not only the direction of the trend, but also to understand the levels of interaction between buyers and sellers. It has no settings and therefore can be perceived as it signals.

The Analytical Trend indicator can track sustained price movement in a specific direction. In this case, the movement itself can be downward, upward or sideways, when the market movement does not have a pronounced direction. The indicator works on the basis of two moving averages and an oscillator. Using the signal search algorithm, the indicator generates signals in the form of arrows. Flexible settings allow you to receive more accurate signals for opening positions. You can quickly understan

Identify Take - trend trading strategy, market noise filtering and all necessary functions built into one tool! The system itself shows in the form of arrows when to buy and when to sell. Uses only one setting parameter. Simple, visual and effective trend detection.
The intelligent algorithm of the Identify Take indicator shows the points of a potential market reversal. Most often, a good trend can be seen visually on the price chart. But an experienced trader must clearly understand the curre
Telegram Channel & Group :https://t.me/joinchat/sdHZOjGc9V0xYjQ0
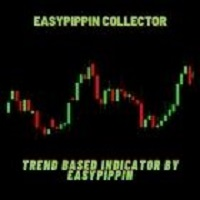
V.I.P Group Access: Send Payment Proof to our Inbox https://easypippin.com/ The Easypippin collector indicator gives u a indication of direction,based on several settings all put together to make it Easy to detect where the market possible is going to. The indicator gives u a X inthebox and a X , if u see them painting together the possible direction is strong. The indicator also can be used as a support and resistence zone.
Sc

The MA is a simple tool that smooths out price data by creating a constantly updated average price . The average is taken over a specific period of time. This is a Multi Time Frame Exponential Moving Averages indicator. It made for a M5 TF and shows a Moving Average data from H1 (white line) and M15 (magenta line). If a M15 EMA crossed a H1 EMA from bottom up then you may go Long. If a M15 EMA crossed a H1 EMA from top down then you may go Short.
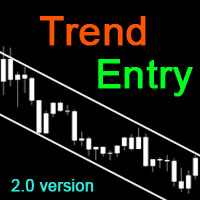
----< High Accuracy Entry Signals and Trend Indicator >----
TrendEntry could tell you the trend direction, resistance and support, when to open orders and where to set stoploss & takeprofit. this is a multifunctional indicator, can work well on all symbols and timeframes.
Features:
real-time analysis of trend direction filter out all the minor waves show resistance and support along as price goes give highly accurate entry signals frequently send alert in popup, email, notification way at e
Simply the " Wilder Exponential Moving Average " An exponential moving average with a somewhat different formula. It is one of the most common and widely used moving averages on various trading platforms. It can be used on all symbols, from forex to indices, it has a single parameter with a default value of 10 It can also be used within expert advisor, I hope it will be useful.
For metatrader 4 - MT4 version
There are 2 oscillator plots - fast & slow. Fast plot shows the price location with in the medium term channel, while slow plot shows the location of short term midline of cycle channel with respect to medium term channel.
Usage of this is similar to %b oscillator. The slow plot can be considered as the signal line. This makes use of the default 10/30 values of Hurst Cycle Channel, but may need tuning for your instrument.
This indicator can also be used to spot

Description
The Quantum Awesome Oscillator indicator is based on the standard Bill Williams Awesome Oscillator (AO) indicator. It has two parts. The lower part is a colored histogram of the oscillator (divided into two sides - above zero and below zero and, accordingly, colored in two colors - blue for buying and red for selling) and a trend curve line (shows the direction of the global trend). The upper part - arrows showing market entry points, as well as dashed lines showing Stop-Loss and Ta

Description
The Quantum Awesome Oscillator Pro indicator is based on the standard Bill Williams Awesome Oscillator (AO) indicator. It has two parts. The lower part is a colored histogram of the oscillator (divided into two sides - above zero and below zero and, accordingly, colored in two colors - blue for buying and red for selling) and a trend curve line (shows the direction of the global trend). The upper part - arrows showing market entry points, as well as dashed lines showing Stop-Loss an
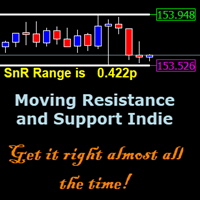
Moving RnS Indicator is created for many functions which is highly useful for the traders. It is a versatile tool that can make whole lots of difference in a trader's trading career. If the best must be gotten from this tool, the trader must study the way it works especially as explained here and more can be discovered because of its functions. It can also be used along with other indicators but if understood well, it can be used alone to get good results.
When attached, it starts moving accor
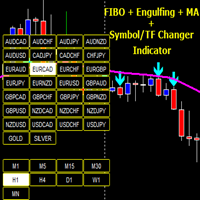
Fibo Engulfing Changer Trading System
Fibo Engulfing Changer Trading System is a great indicator created to locate an engulfing candle on the Chart with the aid of an Arrow and Popup alerts system. For accurate working of an engulfing candle based on market structure, it must be used with an Moving Average but we discovered that Moving average is subjected to individual trader's preferences, therefore it has been coded in a way that the Trader can choose MA he/she desires with a preferred PERIO
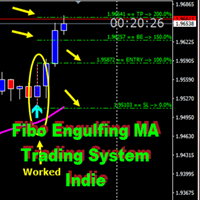
Fibo_Engulfing_Trading_System
Fibo_Engulfing_Trading_System is a great indicator created to locate an engulfing candle on the Chart with the aid of an Arrow and Popup alerts system. For accurate working of an engulfing candle based on market structure, it must be used with an Moving Average but we discovered that Moving average is subjected to individual trader's preferences, therefore it has been coded in a way that the Trader can choose MA he/she desires with a preferred PERIOD, SHIFT, METHOD
An indicator to draw a graph of account current and historical state such as Balance, Equity, Margin, Free Margin, Margin Level, Drawdown, Account Profit, Deposit and Withdrawals.
Indicator Inputs : Draw Balance Graph Draw Equity Graph Draw Margin Graph Draw Free Margin Graph Draw Margin Level Graph Draw Drawdown Graph Draw Account Profit Graph Connect Gaps by Lines Sign of DDs on Profit Sign of DDs on Loss
Tips : The Indicator will draw historical balance graphs and deposit/withdraw arrows b

The indicator displays a stock chart of a non-standard type, in which the price and time have the same value.
The usual chart of Japanese candlesticks does not take into account all the information that the time analysis can give. Renko charts do not use all the information that price can give in relation to time. The "Chart Price and Time" indicator takes into account price and time equally and shows the predominance of price or time.
Taking into account price and time equally gives an idea

****** Easy to understand, correct Trade direction indicator, quick and easy to visualize******* BING Proper Path Indicator(BPP) will show BUY/SELL signals on-screen in an easy-to-understand 'Traffic Light' format. Provides a final 'reassurance' and 'peace of mind' for taking an educated, high probability, low-risk, trade decision. In the same way, you use a rearview mirror for instantaneous information while taking a driving decision, the same way BING Proper Path Indicator(BPP) will help you
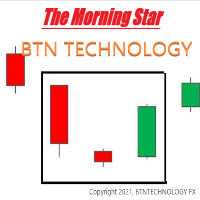
晨星 该指标基于MorningStar。您可以轻松找到何时应该买入。另外,您可以调整参数设置。 *什么是晨星? - https://btntechfx.com/?product=301 如何使用 蓝色向上箭头-价格将上涨(您应该获得买入的位置。) 当您使用 M15 或 H1 指示器时,该指示器可用。 (我们不建议在其他时间使用此指示器。) *使用实时图表代替策略测试者时会显示指标。 参数设置(可定制) AVGRANGE_VAL(您可以调整平均范围的值。) 如果您需要更多功能来添加此指示器,请随时与我们联系! 我们将完全按照您想要修改此产品的方式进行工作。 主页: btntechfx.com 电子邮件:support@btntechfx.com

----< High Accuracy Trend Channel and Entry Signals >----
RSChannel could tell you the trend direction, resistance and support, when to open orders and where to set stoploss & takeprofit. this is a multifunctional indicator, can work well on all symbols and timeframes.
Features:
real-time analysis of trend direction filter out all the minor waves show resistance and support along as price goes give highly accurate entry signals frequently send alert in popup, email, notification way at ever

----< High Accuracy Ichimoku Cloud Entry Signals >----
CloudEntry could tell you the trend direction, resistance and support, when to open orders and where to set stoploss & takeprofit. this is a multifunctional indicator, can work well on all symbols and timeframes.
Features:
real-time analysis of trend direction filter out all the minor waves show resistance and support along as price goes give highly accurate entry signals frequently send alert in popup, email, notification way at every
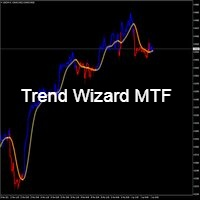
Trend Wizard MTF - trend indicator Input signals without repainting. Nice play on different characters. Easy to set up, simple tool. trend indicator based on the principle of joint analysis (3 indicators). The indicator forms arrows (red and white).
If a signal appears and is confirmed at the close of the signal candle. Error-free opening of transactions The indicator finds the ideal signals to enter a trade (buy or sell), which increases the likelihood of success.
SALE. 1) Red line color -

Indicator shows buy/sell arrows depending on volatility factor. Indicator does not repaint! It works on any pair and any timeframe. It is well tested through strategy builders and shows quite interesting results as a good filter indicator and as independent signaler as well (check the screenshots). It is possible to search for a lot of interesting parameters for profitable trading, some of which are shown on the screenshots. There are next inputs in indicator settings: N-volatility period; Level
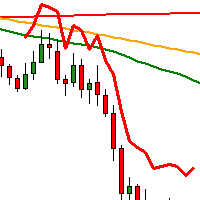
This Indicator is using 3MA's with different periods.
A Buy Signal occurs when Green on the top, yellow in the middle, red at the bottom.
A Sell Signal occurs when Red on the top, yellow in the middle, green at the bottom.
When there is buy signal the indicator draws a blue line below price. When there is sell signal the indicator draws a red line above price.
In the comments section you may find a template file with the 3 MAs.
You can use this strategy alone or compined with anoth

The MaxMinTrend indicator displays the highs and lows of the price on the chart. This indicator was created to simplify the determination of trend directions, as well as to support open positions, by transferring Stoploss to the current highs and lows of the price, thereby making a large profit. This indicator is not redrawn.
Input parameters:
BarsCount - 1000 - Number of bars to draw the indicator
maxmin - true - Enabled display of Highs and Lows
line - true - Enabled display of the connec
Best Currency Flow Indicator This indicator breaks down all 28 forex currency pairs and calculates the strength of individual currencies , therefore it visual the money flow in/out of a currency. This indicator is very powerful because it reveals the true movements of the market, true supply and demand zone. It is highly recommended to analyze charts knowing the performance of individual currencies or the countries economies . The indicator will reveal the country's economic performance

do not download this indicator from here unless you want to donate me , because if you did you will get a demo version ..
this indicator will help you analyse the market based on waves strategy.. to understand it more get the tutorials from my channel on telegram and wait for more new strategies ..
its working on nasdaq dow and dax , but thos one just for nasdaq ..
to get the demo version or buy the real one / join my telegram channel
t.me/forexEaTrade
don not use this indicator without

This FiboMagic Pro indicator determines the direction of the trend and shows potential entry points at the end of the correction.
The main essence of the indicator is that it takes the entire history of a trading instrument and draws trend lines based on it, determines the direction of the trend, and draws Fibonacci levels in its direction.
FiboMagic Pro shows you:
1) Which way to trade 2) Clear criteria for the entry point for breaking the countertrend line in the Fibonacci structure 3) C

The Flat Horizontal Channel Range Price indicator automatically draws a horizontal channel (range) of prices on a higher or current timeframe. This indicator was developed to simplify the determination of sideways movements of the market, as well as to search for entry signals for a pullback from the boundaries of a channel (range) or for its breakdown.
Input parameters:
BarsCount - 1000 - Number of bars to search for a horizontal channel AutoPeriodDraw - true - Enabled automatic drawing of a

The indicator tracks sharp volatility (moments when the market has shown increased activity and movement may occur), on the selected instruments and time periods.
The information is displayed as colored rectangles. Thus, it is possible to assess at a glance which tool should be given priority attention.
The indicator will be useful for scalpers when they need a quick reaction or for traders working with a large number of instruments. The indicator does not redraw. The indicator displays 8 degree
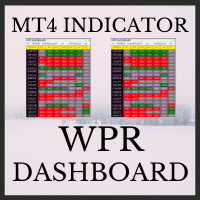
WPR Dashboard uses the value of William's Percent Range indicator. The parameters can be adjusted via the Edit boxes of this dashboard. The monitoring pairs will be selected by adding to the Market Watch (no need to set prefixes or suffixes) , you can monitor many pairs as you like. This dashboard will check almost popular time frame (M1,M5,M15,M30,H1,H4 and D1). The colors can be customized. We can have a look at many pairs and many time frames without opening the chart. In addition, we can
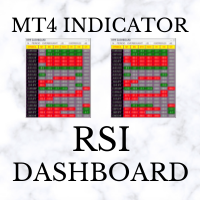
RSI Dashboard uses the value of Relative Strength Index indicator. The parameters can be adjusted via the Edit boxes of this dashboard. The monitoring pairs will be selected by adding to the Market Watch (no need to set prefixes or suffixes) , you can monitor many pairs as you like. This dashboard will check almost popular time frame (M1,M5,M15,M30,H1,H4 and D1). The colors can be customized. We can have a look at many pairs and many time frames without opening the chart. In addition, we can
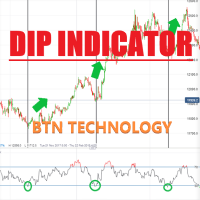
DIP指示器Oshime 该指标基于Oshimegai(逢低买入)。这基于移动平均线,因此该指标指示基于长期趋势和短期趋势的线。 因此,当您进行短时交易时,此指标非常有用。因此,当您应该出售或购买仓位时,可以轻松地在 M5 或 M15 和 M30 火焰中找到。 如何使用 蓝色向上箭头-价格将上涨(您应该获得买入的位置。) *什么是Oshimegai(逢低买入)?- https://btntechfx.com/?product=what-is-oshimegaibuying-on-the-dips 参数设置(可定制) Candle_Index Audible_Alerts
MT5版本从这里开始!
https://www.mql5.com/ja/market/product/65648?source=Site+Profile -------------------------------------------------- -------------------------------------------------- ----------------------------
Trade History Plotter is used to draw trades historical position. It's really useful for analyzing previous trades. It can be from manual trade or expert advisor. This trade history plotter is showing open arrow, lines and closing triangle just like a backtest trade history, everything is exactly the same. It can also plot current running trade history Parameters: Plot history Plot running trades Filter by magic number Filter by trade comment Show trade levels Show chart period separator Customi

One of the secrets of short-term trading is knowing when to enter a trade. At the same time, having the potential to earn the maximum number of points, but without excessive incubation in the transaction in the hope of a ghostly profit. And in this we will be helped by a professional Forex indicator for determining goals within the day - Course Market. He will provide you with everything you need to overcome losses due to human emotions. It's time to stop wandering in the dark and gain a clear v

The Incognito RSI indicator is an advanced internal strength index. It transforms the signal so that the low-frequency components lag behind much more than the high-frequency components. In general, the data of the last bar has more weight than the previous data, like an exponential moving average.
The indicator demonstrates not the relative strength of the compared trading instruments, but the internal strength of a single instrument, therefore it is the “Internal Strength Index”. This is an

The Transition Trend indicator shows the points of potential market reversal. The indicator's smart algorithm detects the trend, filters out market noise and generates entry signals and exit levels. Simple, visual and efficient trend detection. Uses just one parameter for settings. The indicator does not redraw and does not lag.
You can set up message alerts as sound or email. Works on all currency pairs and all timeframes. Ready-made trading system.
TrendSignaler Shows the best trend detection results for all currency pairs without redrawing the result. Determining the current trend is one of the most important tasks. The TrendSignaler The indicator does not change its readings 100%, the arrows always remain in their places. Each user can customize the indicator to suit his trading style and currency pair.
Indicator setting Historybars - the number of bars to determine the trend Signal - signal strength, set the value above 50 . Trend -
Developed to assist in binary options retracement operations, this indicator will show the assets with the best retracement percentages!
How it works: The indicator will calculate the total length of each candle from low to high, the total of the body and total of shadows (up and down) and calculate a total shadows percentage of various configurable assets. The counter is updated with each new candle.
ATENTION: Demo on the estrategy tester is not functional to show multiple assets.
The indicator is designed to display candles (bars) of a higher timeframe on the current one. The indicator has many settings for the displayed candles, as well as a sound signal that will sound a few minutes (seconds) before the bar closes. Input parameters: BarsCount = 50 - the number of displayed bars of the higher timeframe Auto_Candle_UP_TF = false - Automatic selection of a higher timeframe Candle_UP_TF = 60 - Higher timeframe, if Auto_Candle_UP_TF = false Signal_Close_Candle_UP_TF = fals
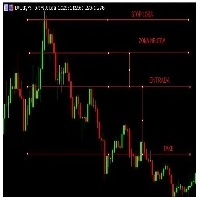
https://youtu.be/Cz76GayNqtM Com esse indicador você não precisa ficar fazendo marcações manuais para encontrar seus canais e níveis de negociação. O channels faz isso por você. Veja o vídeo : Com os canais definidos o trade pode operar seus rompimentos Analisando seu canal de referencia e zona neutra com base na tendencia e nos rompimentos. Tem uma calibragem nas opções onde você consegue estreitar ou alargar mais o canal. Pode definir as cores automáticas das linhas, seus estilos e tamanhos

This indicator will draw patterns based on Rob Smith's The Strat as they emerge in real time on your chart.
As price evolves, TheStrat offers 18 distinct price action patterns that can help you get good entries in the market. Each pattern involves two or three candles, and this indicator will draw a bounding box around the candles and name the pattern. The indicator also shows when a potential setup is forming, known by stratters as an Actionable signal.
Candles
Each candle is defined by its

Bar Meter Indicator is all-in-one indicator was inspired by meter and used some of its code as a template for the graphic objects. It was designed to give alot more precision to both trade entries and exits and provide an instant snapshot of a currency pair's movement. Bar Meter Indicator works on any Currency or Timeframe. Graph of Stochastic Oscillators on timeframes M1 up to D1. Indication of the market trend using EMA's on timeframes M1 to D1. The direction of the MACD on the current chart,

VTrende Pro MT4 - MTF indicator for trend trading with a display panel for MT5 *** Videos can be translated into any language using subtitles (video language - Russian)
Although the signals of the VTrende Pro indicator can be used as signals of a full-fledged trading system,
it is recommended to use them in conjunction with the Bill Williams TS.
VTrende Pro MT4 is an extended version of the VTrende indicator. Difference between Pro version and VTrende:
- Time zones
- Signal V - signal 1-2 wave
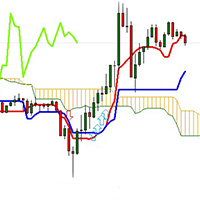
This indicator is trading Ichimoku Triple Cross strategy, that means price crosses Tenkan-sen, Chikou Span crosses price, and Chikou Span crosses Tenkan-sen. Tenkan Sen is not straight as well but towards the new trend. Triple cross happens just before Ichinoku Breakout it signals the creation of a new trend (Reversal) and it is more valid in bigger timeframes like 1 and 4 hours. When there is buy signal the indicator draws a blue arrow below price. When there is sell signal the indicator dr
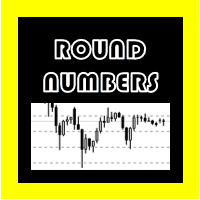
轮数(对于Metatrader 4)
该指标使您可以根据资产包含的整数添加水平线。
与其他指标不同,该指标会随着价格的变化自动动态地计算最接近的水平。
适用于货币对,指数,金属,股票等。
以5位数,3位数和10 100或1000的整数取整。
可以在以下参数中调整行:
隐藏您不想显示的行或整数。 线条颜色。 线的粗细。 线条样式。
轮数(对于Metatrader 4)
该指标使您可以根据资产包含的整数添加水平线。
与其他指标不同,该指标会随着价格的变化自动动态地计算最接近的水平。
适用于货币对,指数,金属,股票等。
以5位数,3位数和10 100或1000的整数取整。
可以在以下参数中调整行:
隐藏您不想显示的行或整数。 线条颜色。 线的粗细。 线条样式。
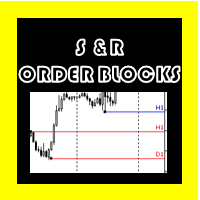
METATRADER 4的支持线和电阻+命令框
定位支撑和阻力的视觉方式更加愉悦,与普通的水平线不同,它们可以从特定点定位,而不会向后延伸,从而使图形看起来不佳,还显示了创建该临时性的名称这样,当您进行操作时,就可以知道它属于哪个临时性。
您还可以以舒适和直观的方式创建订单块,还可以查看其所属的时间性。
按以下键创建行:
“ S”键=支持 “ R”键=电阻 键“ O” =命令块
配置:
线数
支撑线的颜色 电阻线颜色 支撑线的宽度 电阻线宽度 括号线样式 电阻线样式
订单块
订单块的颜色 订单块宽度 订单块样式
METATRADER 4的支持线和电阻+命令框
定位支撑和阻力的视觉方式更加愉悦,与普通的水平线不同,它们可以从特定点定位,而不会向后延伸,从而使图形看起来不佳,还显示了创建该临时性的名称这样,当您进行操作时,就可以知道它属于哪个临时性。
您还可以以舒适和直观的方式创建订单块,还可以查看其所属的时间性。
按以下键创建行:
“ S”键=支持 “ R”键=电阻 键“ O” =命令块
配置:
线数
支撑线的颜色 电阻线颜色 支撑线的宽度 电阻线宽
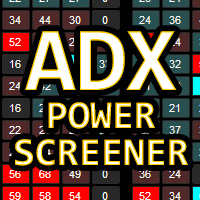
ADX Power Screener MT4 is a very powerful utility. Thanks to the information provided by the ADX indicator , it returns a table with the levels detected on the major timeframes.
Great for checking the quality of a trend and identifying excellent reversal signals which can be accompanied by normal technical analysis to find the best entry point.
The screener can be totally customized in colors and levels. It also uses 2 lists of 28 symbols each, fully customizable through the input panel.

Victoria is a trend indicator used to identify trends in financial markets, indicates the direction of price movement. Flexible indicator settings allow you to receive more accurate signals for opening positions.
The indicator will allow you to determine the current trend. Using this algorithm, you can quickly understand what kind of trend is currently developing in the market. Victoria can be used along with oscillators as a filter.
Victoria is a true range indicator that identifies the rang

The Comparison indicator can be used as an independent trading system. It is based on the idea that some currency pairs follow each other. The indicator allows you to simultaneously display another chart on the chart of one currency pair, which allows you to anticipate some movements and quite accurately determine the beginning of trends.
The principle of trading by indicator signals is also simple: a currency pair, the chart of which is above, should be sold, and the one below, should be boug
This indicator implements the logic behind Traders Dynamic Index to the classic MACD Indicator. It helps to find powerful trende changes and ignore meaningless ones. It is simply the classic MACD indicator plotted with volatility bands on top designed with the sole purpose of being able to ignore trend changes that do not follow an over-extension or over-contraction of the market. The indicator alerts on trend changes after the volatility bands have been breached and implements alerts of all ki

The Trend Reversal Arrow Scalper indicator is designed to find trend reversals on the current timeframe. Trading with it becomes very simple, since the indicator does all the hard work for you to find points of entry into the market. You just have to buy if a blue arrow appears, or sell if a red arrow appears. The indicator also displays dots (red and blue following the arrow). They show the current trend and are also signals for entry (if, for example, you missed the main entry along the arrow)

Keltner Channels are volatility-based bands that are placed on either side of an asset's price and can aid in determining the direction of a trend. The exponential moving average (EMA) of a Keltner Channel is typically 20 periods, although this can be adjusted if desired.( Default is 50 here..)
In the Classic Keltner Channels The upper and lower bands are typically set two times the average true range (ATR) above and below the EMA, although the multiplier can also be adjusted based on personal p
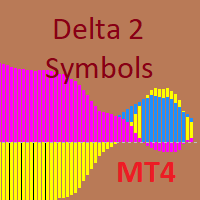
The indicator is designed for pair trading with 2 highly correlated instruments.
Indicator charts can be displayed as lines or histograms. There is an MTF mode, the maximum and minimum deltas for the calculated number of bars are displayed with a check for a specified minimum value. It is possible to enable the calculation of trade operations with checking the current correlation coefficient for the minimum specified, the current delta in points or percent of the maximum (minimum) delta and c

Risk Reward ratio indicator for MT4 BING Risk Reward indicator is a powerful, basic, very needed tool for every trader. Clearly visualize Open Price , Stop Loss , and Top Profit levels on your graphs with easy-to-see colors and trendlines.
Does BING Risk Reward show alerts? Of course! BING Risk Reward Indicator offers all Alerts available for the MT4 platform(Email, Popups, Sound, and Push). It shows alerts on Open Price , Stop Loss , and Top Profit. That way, besides easily seeing what is go

FX Flow indicator can be used as an anticipator of the next trend, preferably confirmed by Price Action or another oscillator (RSi, Stochastic ..).
It takes the money flows of the major currencies USD EUR GBP AUD NZD CAD CHF JPY into account, and processes them. Excellent tool for indices, but also for correlations between currencies. Works on each timeframes.
Blue line: Bull market Yellow line: Bear market
Note : if the indicator opens the window, but does not draw lines, load the historie

KDJ Index 4 交易实用必备工具指标 波浪自动计算指标,通道趋势交易 完美的趋势-波浪自动计算通道计算 , MT4版本 完美的趋势-波浪自动计算通道计算 , MT5版本 本地跟单复制交易 Easy And Fast Copy , MT4版本 Easy And Fast Copy , MT5版本 本地跟单复制交易 模拟试用 Easy And Fast Copy , MT4 模拟账号运行 Easy And Fast Copy , MT5 模拟账号运行 "Cooperative QQ:556024 " "Cooperation wechat:556024" "Cooperative email:556024@qq.com" 强烈推荐趋势指标, 波浪的标准自动计算 和 波浪的标准自动计算MT5版本
KDJ指标又叫 随机指标 ,是一种相当新颖、实用的技术分析指标,它起先用于期货市场的分析,后被广泛用于股市的中短期趋势分析,是期货和股票市场上最常用的技术分析工具。 随机指标KDJ一般是用于股票分析的统计体系,根据统计学原理,通过一个特定的周期(常为9日、9周等)

Why TrendPadPRO ? Because it delivers not just signals, but the real context of trend trading – the difference between late reactions and informed decisions based on market structure and dynamics.
I. TrendPadPRO - Unveiling the Context of Informed Trend Trading The Context of Trend Trading is far more relevant and important than indicators, timeframes, personal perspectives or beliefs. TrendPadPRO 's unique features, including trend inertia (age) analysis, trend direction identificati
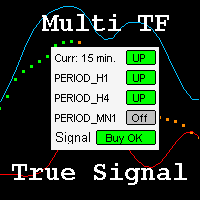
这是指标外壳中的一个函数。为指定数量的 TF(从 1 到 4)生成交易信号。不使用终端随附的指示灯。基本计算是使用 MACD 公式进行的,但使用的是经过修改的第三代 EMA(对趋势的突然变化反应更快)。 此外,功能: - 绘制两条显示趋势强度的波段。 - 检测趋势变化到相反的时刻,并通过警报和声音信号(如果允许)通知它。警报仅在趋势变化时弹出一次。如果至少有 2 个相同颜色的点,则为每个被监控的 TF 生成 UP 或 DN 信号。最终信号由所有允许的 TF 的指标形成。 可以关闭当前 TF 的信号 - 趋势将被绘制,但信号不会被考虑在内。这使您可以自由切换chart-TF以概览一般情况,而不会违反功能的正确性。我不建议让超过 2 个 TF 不必要地工作。或者允许一切,但在不等待最终上涨或下跌信号的情况下做出交易决定。在弱趋势(线之间的小差距,点几乎是水平的,颜色交替),我建议关闭盈利交易而不是交易。或者按照假定的趋势发展方向通过挂单进行交易。在强劲趋势下,允许交易市场订单 输入参数
FastPeriod、SlowPeriod、DeviationPeriod、Deviation

The Easy Trends indicator gives the trader the ability to visually determine which trend will be present at a particular time interval. It smooths out price fluctuations during signal formation by averaging the data. This is an auxiliary tool for technical analysis, which helps to determine the exact direction of the trend: either upward or downward movement of the price of a trading instrument.
Although the indicator lags a little, it still generates the most reliable signals that a trader ca

Reversal Prices is an indicator that has a fairly powerful and effective mechanism for adapting to changing market conditions. Reversal Prices - the new word in trend detection! With the development of information technology and a large number of participants, financial markets are less and less amenable to analysis by outdated indicators. Conventional technical analysis tools, such as the Moving Average or Stochastic, in their pure form are not able to determine the direction of the trend or it

The new Analytical Concentration leading trend indicator uses adaptive anti-aliasing. It allows you to enter the market early. Indicator of a sharp turn to a dynamic change of direction. The Analytical Concentration indicator gives the trader the ability to visually determine which trend will be present at a particular time interval. An indicator that has a sufficiently powerful and effective mechanism for adapting to changing market conditions.
A new word in trend detection! It smooths out pr
MetaTrader市场是您可以下载免费模拟自动交易,用历史数据进行测试和优化的唯一商店。
阅读应用程序的概述和其他客户的评论,直接下载程序到您的程序端并且在购买之前测试一个自动交易。只有在MetaTrader市场可以完全免费测试应用程序。
您错过了交易机会:
- 免费交易应用程序
- 8,000+信号可供复制
- 探索金融市场的经济新闻
注册
登录