Advanced Supply Demand
- 指标
- 版本: 8.3
- 更新: 23 五月 2026
- 激活: 5

现在优惠 30%!
任何新手或专业交易者的最佳解决方案!
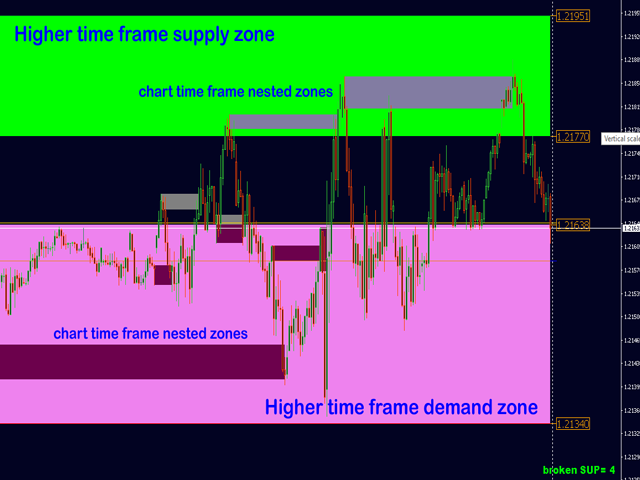
该指标是一款独特、高质量、且价格合理的交易工具,因为我们已经整合了许多专有功能和新公式。 依据此更新,您将能够显示双重时间帧区域。 您不仅可以显示一个较高的时间帧,还可以同时显示图表时间帧,加上更高的时间帧:显示嵌套时区。 供需双方所有交易者都会喜欢它。 :)
重要信息披露
高级供需的最大潜力,请访问https://www.mql5.com/zh/blogs/post/720245
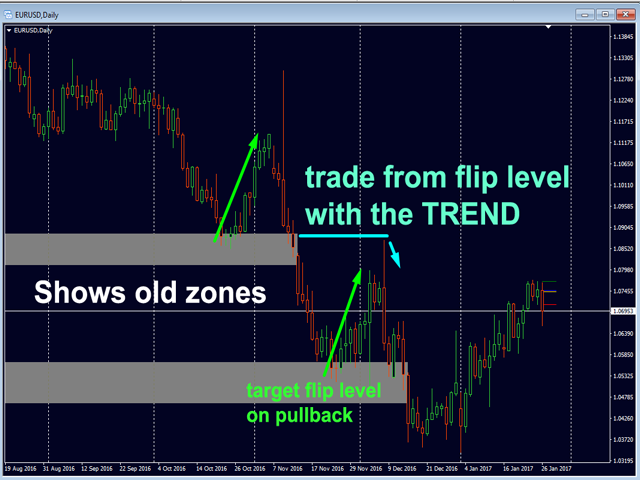
想象您的交易如何得以改善,是因为您能够精准定位入场或目标位吗? 构建于新的底层算法,它可以更轻松地识别出买卖双方之间的潜在失衡。 这是因为它以图形方式展示供需最强劲区域,及其过去的表现(显示旧区域)。 这些功能旨在帮助您更轻松地发现最佳入场区域和价位。
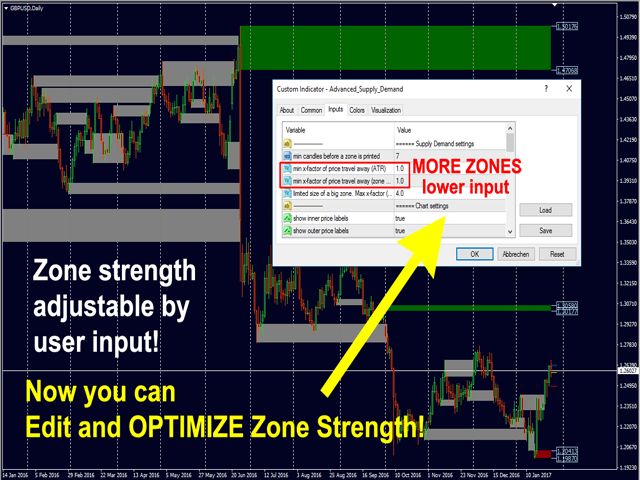
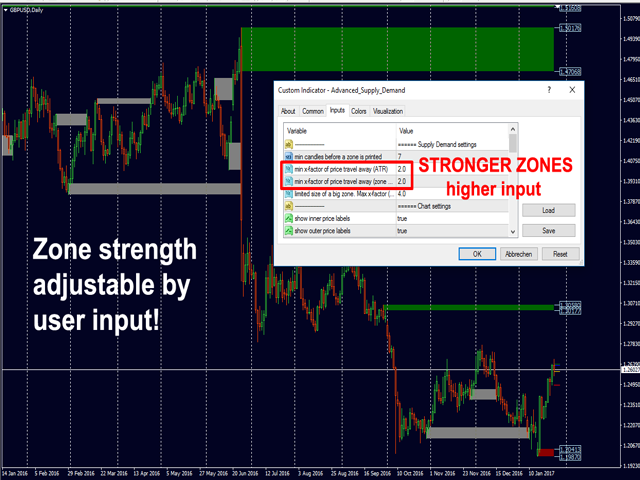
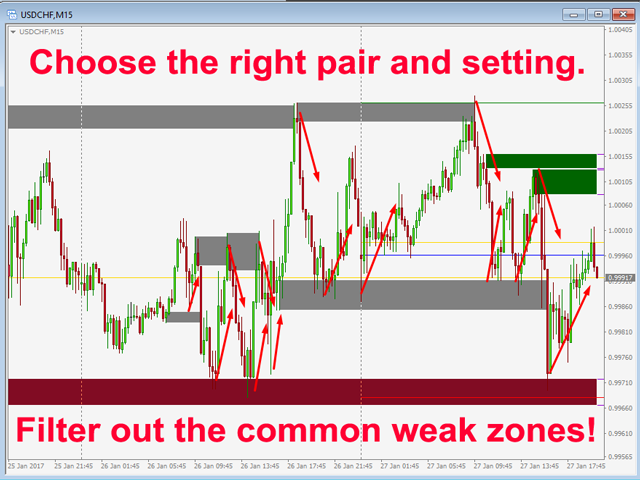
现在您可以针对您的交易品种和时间帧来优化和编辑区域强度!
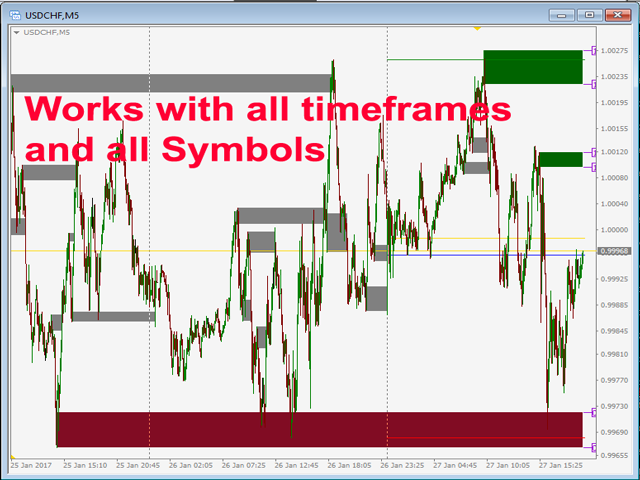
高级供需指标适用于所有产品和时间帧。 它是一个新的公式,非常新的功能是两个区域强度函数可由用户输入进行调整! 这在交易中是一大优势。 当您学习如何使用专有功能,例如带有价格游离最小 X 因子的区域强度时,您能够判断该区域强劲与否。
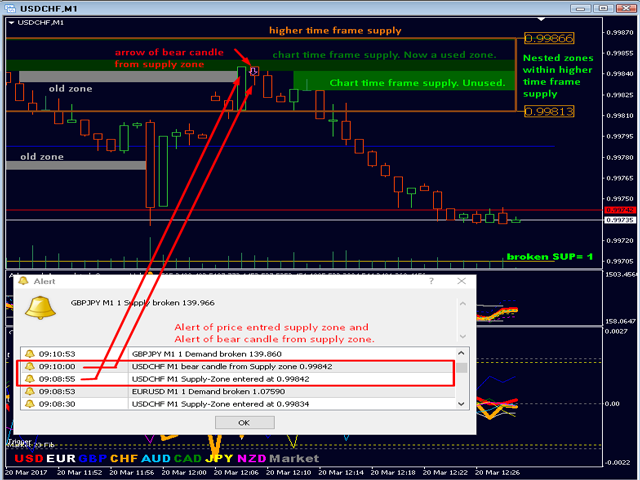
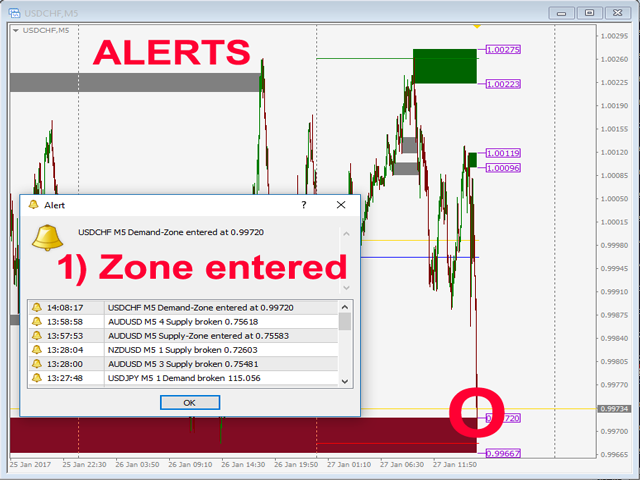
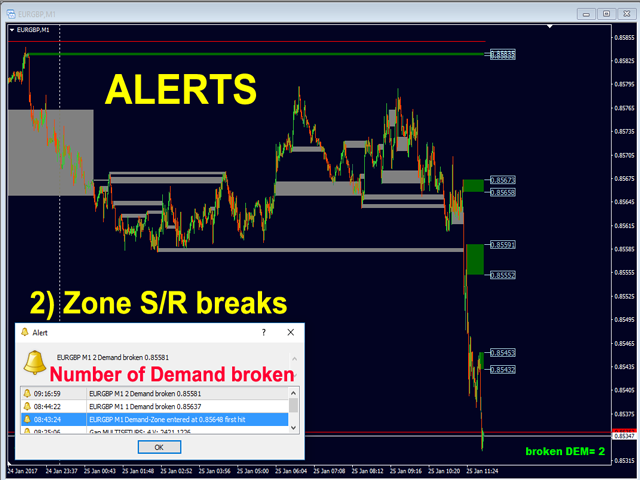
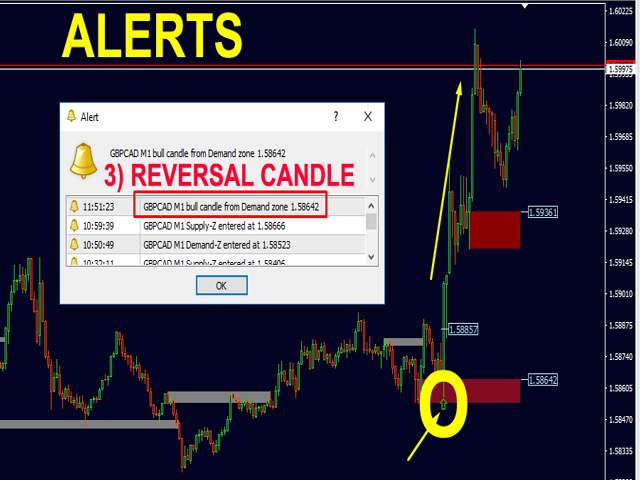
供需区域用作警报触发器。 您可以选择 3 种警报。 如果价格 1) 进入该区域,和/或 2) 突破该区域,和/或 3) 自该区域形成逆转蜡烛。 您可以在 MetaTrader 4 使用带声音的弹窗式警报,和/或推送电子邮件。 当您收到警报时,您就会知道作为交易者应该做什么。
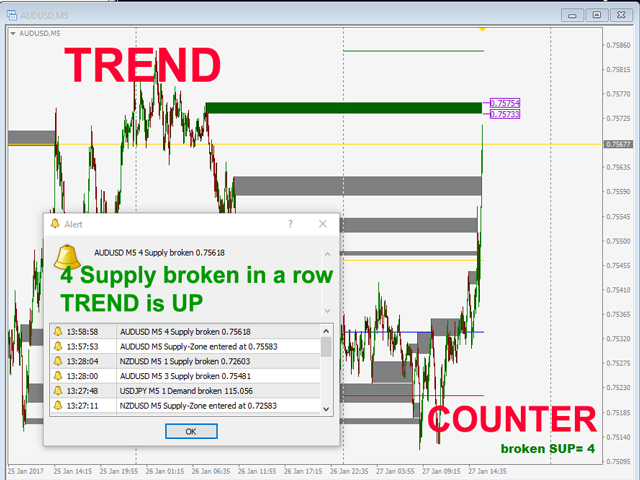
一条消息会告诉您一连串突破了多少个需求区域,如此您就能顺势交易并寻找趋势的延续。
该指标可以检测嵌套的供需区域!
一个非常强大的功能! 警报将告知供需区域是否嵌套(在)更高时间帧的供需区域内! 可以过滤掉嵌套区域的所有警报。
参数
供需设置:
- 打印区域之前的最少蜡烛数(用于实时图表)。
- 价格游离的最小 X 因子 (ATR)(数字越大,区域越强劲)。 针对您的品种和时间帧优化此处!
- 价格游离的最小 Y 因子(区域大小)第二个输入:数字越大,区域越强劲。 针对您的品种和时间帧优化此处!
- 一个大区域的极限大小。 最大系数 (ATR)(超大的大区域将会减少。 数字越大,所允许的区域尺寸越大)。
MTF 设置:
- 加入更高的时间帧
- 更高的时间帧周期(如果 MTF 等于或低于图表时间帧,采用较高的那个)
- 打印区域之前的更高时间帧的最少蜡烛数
- 价格游离的最小 X 因子 (ATR) MTF
- 价格游离的最小 Y 因子(区域大小)MTF
- 一个大区域的极限大小。 最大因子 (ATR) MTF(超大区域将会减少。 数字越大,所允许的区域尺寸越大)。
- 显示内部价格标签 MTF
- 显示外部价格标签 MTF
图标设置:
- 显示内部价格标签。
- 显示外部价格标签。
- 显示老旧区域(供需计数器需要,见下文)。
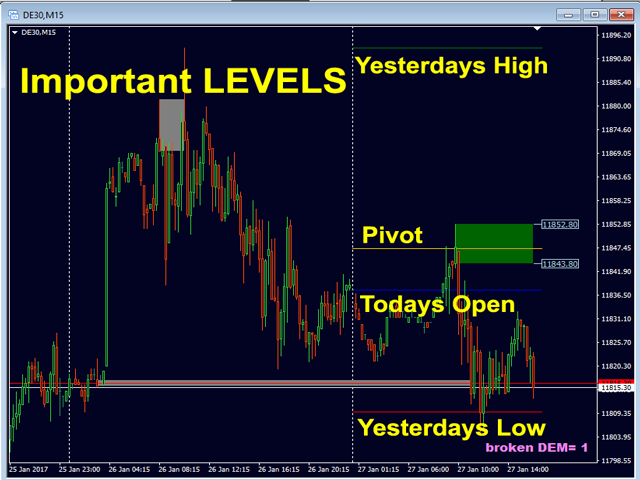
- 显示昨天的最高价/最低价
- 显示今天的轴点
- 显示一连串突破供需区域数量(计数器)
- 显示在上方角落
- 在生鲜蜡烛上绘制延伸矩形
警报设置:
- 警报区域命中
- 警报区域突破
- 区域逆向蜡烛警报
- 仅嵌套区域警报! (位于 MTF)
- 假突破警报
- FBO 最小柱线点
- FBO 柱线 收盘价回踩 % (20-90)
- FBO 形态柱线计数 (1-3)
- 弹窗式警报(MT4 弹窗和声音)
- 发送电子邮件警报
- 发送推送警报
颜色设置:
- 您知道如何使用它。 每个区域都有自己的颜色。
若要查看完整列表点击此处。
其它设置:
- 使用 PIN (用于 EA)
- 显示供应区域的最大数量
- 显示需求区域的最大数量
- 若要查看完整列表点击此处。
小贴士:
- 用户手册:点击这里。
- 使用我的模板(见评论)。
- 针对您的交易品种和时间帧优化区域强度。
- 保持顺势。 该指标主要与我的其他专业货币强度指标之一配合使用。
- 查看个人资料上我的新闻和博客,了解交易系统和交易示例。
如果您有任何问题,我会随时为您提供帮助。
由衷地问候,Bernhard


The indicator is excellent, and the support is very helpful. Thank you.