 MetaTrader 5
 专家
专家
 指标
指标
 程序库
程序库
 实用工具
实用工具
 窗口小部件
窗口小部件
 规则
规则
适用于MetaTrader 4的技术指标 - 66
 下面列出的技术指标信号对MetaTrader 4平台的开仓交易和平仓交易起着至关重要的作用。
指标的本质就是一种交易品种的数学转换,旨在预测价格变化。
下面列出的技术指标信号对MetaTrader 4平台的开仓交易和平仓交易起着至关重要的作用。
指标的本质就是一种交易品种的数学转换,旨在预测价格变化。 
ScalperMulti is a multicurrency indicator for professional traders. The indicator shows the complete market situation for the trader. The main advantage of this indicator is that it simultaneously analyzes six major currency pairs on all timeframes from M1 to MN. The indicator analyzes the trend strength. The indicator generates color-coded signals to visualize the market situation: Green - ascending trend. Red - descending trend. Yellow - trend is not defined. The indicator is excellent for sca
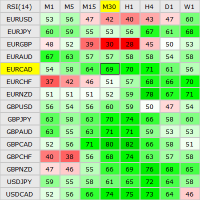
This indicator shows the current RSI values for multiple symbols and multiple timeframes and allows you to switch between timeframes and symbols with one click directly from the matrix. With this indicator, you can analyze large number of symbols across multiple timeframes and detect the strongest trends in just a few seconds.
Features Shows RSI values for multiple symbols and timeframes simultaneously. Colored cells with progressive color intensity depending on the RSI values. Ability to chang
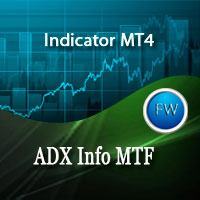
ADX is one of the indicators most commonly used by traders. This version allows to extract the maximum amount of information without hassle of constantly switching between the timeframes and, thereby, greatly simplifies working with it. This is a standard ADX indicator provided with an info panel displaying the current relative position of -DM and +DM lines on all timeframes. Blue circle - uptrend. Red circle - downtrend. Yellow circle - no trend. Blue arrow - (+DM) > (-DM); Red arrow - (-DM) >

Все трейдеры знают, что без статистики работать нельзя и ведут статистику на бумаге или используют интернет ресурсы. Индикатор "VG-Statistics" создает статистику по истории Ваших сделок. Для правильной работы нужно выбрать нужный период в истории сделок и нажать кнопку "Развернуть" в левом углу графика, по умолчанию будут подсчитаны все сделки загруженные в ваш терминал с учетом комиссии и свопа, для подсчета например только "EURUSD" установите индикатор на график "EURUSD" и в настройках изменит

Extremum Search is designed to search for extremes, places where the price is likely to reverse and the current trend is likely to change to the opposite. With certain settings, the indicator can be used to define the current trend. The indicator works with any symbol provided that you have sufficient history data for a timeframe the indicator is launched at. It is recommended to attach Extremum Search on the timeframes from M1 to D1. Its calculations use 19 methods, which are selected by a cert

Biwavelet is an indicator for harmonic forecast of the market based on one-dimensional wavelet transform functions. Wavelet transforms are one of the main tools of digital algorithmic trading. This is due to their ability to analyze and predict processes occurring in two independent basic dimensions - price and time. Wavelets have significant advantages over the Fourier transform, because wavelet transform allows evaluating not only the frequency spectrum of the price signal, but also the time a
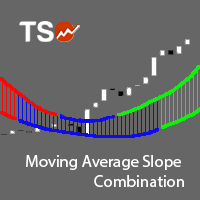
The Moving Average Slope (MAS) is calculated by detecting the moving average level n-periods ago and comparing it with the current moving average level. This way, the trend of the moving average can be drawn on the moving average line. This indicator allows to compare the slopes of two moving averages (fast and slow) to cancel out noise and provide better quality entry and exit signals SCANNER is included . Now with Scanner you can find trading opportunities and setups easily and faster.
Featur
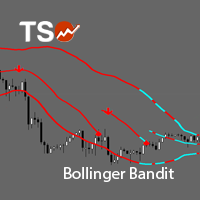
TSO Bollinger Bandit Strategy is an indicator based on the Bollinger Bandit Trading Strategy as presented in the book Building Winning Trading Systems with TradeStation by G. Pruitt and J. R. Hill. SCANNER is included . Now with Scanner you can find trading opportunities and setups easily and faster.
Features A complete entry and exit strategy for trending markets. Get email / push notifications when an entry signal occurs. The indicator is not repainting. Can easily be used in an EA. (see For
The BinarySignalMt4 indicator has been created for trading short-term binary options. The indicator shows excellent results when trading binary options with a short expiration time. The main advantage of this indicator is the high accuracy of signals. The frequency of the indicator signals depends on the selected timeframe (the signal is generated no more than once a minute on M1, no more than once in five minutes on M5, and so on). The indicator should be attached to a chart of any timeframe an

Brabux is a ready-made mechanical trading system. It works on all currency pairs and timeframes automatically adjusting to them. It also selects the most efficient trading parameters for receiving a necessary profit. In the indicator parameters, specify the trading period used for calculations and the least acceptable profit in points. Next, the system automatically selects the necessary trading parameters. Trading data is displayed on the info panel. After setting the indicator on the chart and

Real-time trend, pricing, and volume details in the corner of the current chart. This indicator displays useful trend, pricing, and volume information in the corner of the current chart. With this indicator, you get real-time market trend, pricing (Ask, Bid, spread, Open, High, Low, change from previous bar Close), and volume (current, High, average). After the indicator is executed, you will see this real-time data in the upper right-hand corner of the chart or an alert indicating that an error

The Complex Fibonacci indicator automatically plots Fibonacci levels on all timeframes. When new extremes appear on the chart, Fibonacci lines are automatically updated in real time.
Indicator parameters Period for H1 - specify period for H1; Period for H4 - specify period for H4; Period for D1 - specify period for D1; Period for W1 - specify period for W1; Period for MN - specify period for MN; Lines name - enter the names for the lines here; Lines color - the color of the lines.

This is a multi-currency author strategy, designed for trading on the M1, M5, M15, М30, Н1, Н4. Entry points are calculated using custom formulas and algorithms that allow you to effectively determine current trend in the market, obtain the entry points (buy/sell) and the optimal levels to close orders. The Cosmic Diviner Scalper System indicator can be used on any Forex pairs. The detailed guide on how to use the indicator is provided in the blog: https://www.mql5.com/en/blogs/post/719602 A hug

This indicator displays the trend movements.
Parameters XRMultiplier1: XR multiplier 1. XRMultiplier2: XR multiplier 2. Line1: line 1 movement (true/false). Line2: line 2 movement (true/false). XRTrend: XR trend displays Line 1 and Line 2 movements (true/false). X: move the trend left and right. Y: move the trend up and down. How to understand the status: If the Line is green, trend is up. If the Line is red, trend is down.
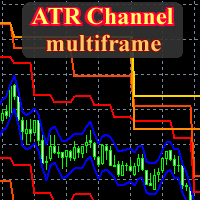
This is a fully multitimeframe version of the ATR Channel standard indicator, which works for any combination of timeframes. The indicator allows viewing price channels from different timeframes in one window, and they will always be displayed in a correct time scale. You can create and set of intervals and freely switch to a higher or lower one. Please note: in the " From Median Price " display mode, it is easy to identify reversal points at intersections of levels from higher timeframes by lev

The Candle Patterns indicator provides a visual display of candlestick patterns. There are more than 100 patterns that can be displayed. The indicator allows for candles on the chart to be grouped and considered as one candle. This allows the price action within a candle to be observed in the context of a candlestick pattern. The number of bars per candle can be set in the parameters. All patterns can be filtered so that only patterns with certain attributes are displayed. The prior trend is tak

HeatMap MT4 allows traders to see inside the charts. This indicator plots congestion zones over a certain period of time, known as "Lookback", by analyzing thousand of variables simultaneously. These spots act like strong supports and resistances and now are easy to see. HeatMap MT4 works with all timeframes and all instruments.
Settings Computations - define whether the algorithm works continuously or only at the opening of each candle (default: New Candle). Lookback in Bars - define the perio
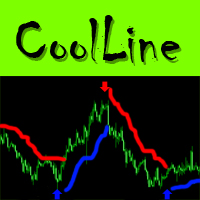
CoolLine is a signal indicator displaying on a chart points for opening and closing trade positions. The indicator signals are not redrawn. It draws arrows on the zero bar Open[0]. It works on all currency pairs and all time frames.
Indicator Advantages Precisely shows the opening and closing points on the chart Does not redraw signals Works on all currency pairs and timeframes Very easy to use; suitable even for beginners Has a very flexible system of settings Can send push and email notificat

The Wing Patterns indicator scans for many different kinds of Patterns using an XABCD structure. The term Wing Pattern is used to refer to all types of patterns based on a general XABCD structure, which is plotted in an alternate high-low extreme form. In other words, assume that point X is started at a low point on the chart. The point A is plotted at the next highest point within a certain number of bars. This certain number of bars is called the depth level. In this example, point B would be
Market Scanner Elite is a new generation of indicators of the Market Scanner series. The Elite version features an improved market analysis algorithm, with a better identification of the entry points and filtering of the false signals. The logic of market analysis and calculation of effective entry points applied in this product are significantly different from those applied in Market Scanner . This indicator cannot be called a big brother, as it is a completely new product with innovative analy
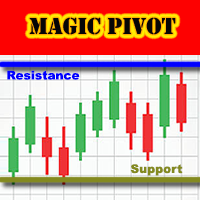
Magic Pivot is a professional indicator for finding the support and resistance lines; it has been developed by a group of professional traders. The indicator plots three support lines and three resistance lines, where a price reversal is highly probable. Magic Pivot is an excellent tool for scalping and intraday trading. Advantages
High accuracy of signals. Suitable for scalping and intraday trading. The indicator does not redraw. Simple indicator setup, minimum parameters. Works on any financ

The indicator displays the key support and resistance levels on the chart. The significance of these levels lies in that the price may reverse or strengthen the movement when passing such levels, since they are formed as a consequence of the natural reaction of market participants to the price movement, depending on which positions they occupied or did not have time to occupy. The psychology of the level occurrence: there always those who bought, sold, hesitated to enter or exited early. If the
The RSI S-RoC indicator differs from the standard RSI in that it takes into account the price rate of change when calculating values. When the price moves in a trend, the indicator produces good entry signals oncethe price touches its levels. The level values can be configured in the indicator settings. They can also be modified and adjusted directly in the indicator window. You can also set on a chart signal lines. Once they are crossed, the indicator will produce a sound alert or play a user
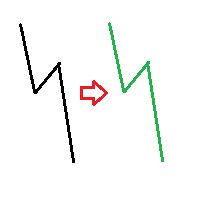
The indicator compares pattern found on chart history with the current price movement. Since history repeats itself, then, by comparing the two patterns, indicator can predict the further movement of the price. The indicator allows you to overlay highlighted history pattern with current movement and you will visually see this movement and will be able to compare the past and the present. To compare two patterns, you need: It is necessary to find and highlight a pattern on the history chart of a

Extract Candle Power 是一种实时交易量提取器指标,可提供有关每根蜡烛期间买卖双方行为的宝贵见解。通过分析交易量数据,交易者可以就市场趋势和潜在逆转做出更明智的决策,超越传统移动平均线指标的能力。 这个强大的工具允许您提取和分析当前蜡烛的买卖双方交易量,并将其与之前蜡烛的交易量进行比较。该信息对于了解交易者当前在市场中的定位至关重要。此外,您可以通过将实时蜡烛的交易量与移动平均线进行比较,轻松识别潜在的反转点。 Extract Candle Power 指标用途广泛,适用于所有时间范围和任何货币对。它提供了准确的见解,并且在更高的时间范围内使用时尤其有价值。无论您有特定的交易策略还是更喜欢适应不同的时间框架,该指标都可以根据您的需要进行定制。 该指标还提供了一系列附加信息和参数,可增强您的交易体验。您可以访问详细信息,例如经纪人的服务器时间、买家和卖家的交易量百分比、蜡烛交易量、买入价和卖出价、价差、当日最高价和最低价、掉期利率、杠杆、保证金、净值、利润和余额。 通过可自定义的显示参数,包括颜色选择、字体选择和大小选项,您可以个性化指示器的外观以满足您的喜好。信息面板

The indicator uses the Envelopes channel in its calculations, which allows working with dynamic support and resistance levels. It also considers the direction and strength of the trend, as well as the mathematical calculation that determines the percent range of the price channel, which is generally formed at the time of the accumulation of positions. It first generates a preliminary signal in the form of a round arrow. Then it is necessary to wait for a normal arrow and enter the market only af
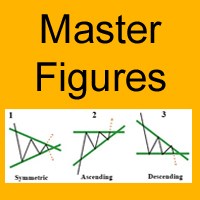
The Master Figures indicator analyzed the market for the most common chart patterns. The first pattern is called Pin bar . This pattern can rightly be considered one of the most widespread. This pattern looks like a candle with a small body and large tail (wick). Once you see it on the chart, open a position against the wick. It is better to use the resistance lines for closing. Master Figures shows this pattern in the form of circles. A position should be opened when a new candle appears after

The indicator is designed for determining Fibonacci levels. Does not repaint/redraw The blue level shows the zero Fibonacci value (it is also the Pivot level) Red levels show calculated Fibonacci levels (used as a rollback or reversal point) Automatic period detection (periods can be entered manually) Adjustable display calculation method. Settings BarsHistory - the number of bars to be used to display the indicator. Method - method of calculation. AutoPeriod - automated period calculation (true

The TrendsAssistantMt4 indicator is shown in a separate window in the form of rhombi of different colors: red rhombi indicate a drop in the price, green ones signify a growth. Two rhombi of the same color in a row serve as the trade signals. The indicator should be attached to a chart of any timeframe and any trading symbol.
Parameters Per - period for calculation. The greater the period the longer the indicator is calculated and the less the number of false signals.

Openology is a very simple indicator that can show the historical information of the opening price levels. The histogram has in fact the task of showing the history of this value in order to study the conditions of permanence and duration of this very important market condition. The indicator, in separate window, is not intrusive and through its internal customization extremely simple in use. Very important is the possibility to enable or disable a timeframe to show the agreement of study on Ope

This indicator draws Fibonacci level automatically from higher high to lower low or from lower low to higher high combinate with Pyramid Trading Strategy for better risk reward ratio. With adjustable Fibonacci range and has an alert function.
What is Pyramid Trading Strategy? The basic concept of pyramiding into a position is that you add to the position as the market moves in your favor. Your stop loss moves up or down (depending on trade direction of course) to lock in positions. This is how

BinaryIndicator is a highly accurate indicator for trading binary options. It shows excellent results in scalping. This indicator is based in multifactor analysis of trend indicators, as well as confirmation oscillators, which in the end gives an increased accuracy of signals.
Advantages of the indicator Increased accuracy of signals. Excellent results when trading binary options with a short expiration time from M30 to M1 . It works on any timeframes. Works with any trade symbols.
Parameters

This oscillator is smooth as the name implies. It also shows hidden divergence arrows. The indicator also has multi timeframe features to make it very flexible to use. The multi time frame features can be adjusted as follows: 1 or M1, 5 or M5, 15 or M15, 30 or M30, 60 or H1, 240 or H4, 1440 or D1, 10080 or W1.
Indicator parameters Timeframe - When set to 0, works on the current timeframe. Draw Divergence arrows - If set to True allows divergence lines to be drawn. Display Alert - If set to True

Some traders experience difficulties when it comes to limiting risks. This indicator helps traders define a suitable stop loss to limit trading risks. The indicator provides seven levels of risk limitation (recommended values are 1-3). The greater the risk, the greater the stop loss. Accordingly, the lower the risk, the smaller the stop loss, but the greater the probability of false triggering. In addition, the indicator shows trend signals and the current trend strength. This data can be used t

This indicator is a proof of concept of pyramid trading strategy. It draws fibonacci level automatically from higher high to lower low or from lower low to higher high combinate with Pyramid Trading Strategy for better risk reward ratio. What is Pyramid Trading Strategy? The pyramid forex trading strategy is a something every forex trader should know about because it makes the difference between making some pips with some risk in only one trade or some pips with less the risk by applying the pyr


This indicator is a multitimeframe trading strategy. It has the levels for stop loss, take profit and entry point. The order level can also be set manually. The indicator uses the regularity of the market, which manifests itself on all instruments, and does not require adjustment of the parameters. The strategy uses a proprietary approach to determining: trend, volatility, hierarchy of timeframe significance, the size of the history period (the number of candles), which is important for making a

这个指标就是在当前图表上显示主要趋势。 特色: 里层的白色通道交叉时意味着趋势改变。 如果白色点画线向下交叉白色实线,表示趋势变为空头趋势。 如果白色点画线向上交叉白色实线,表示趋势变为多头趋势 交叉发生后不会重绘。 参数设置: ShowColorCandle: 如果是true,则显示变色K线 BullColor: 多头趋势时K线的颜色,默认是Aqua. BearColor: 空头趋势时K线的颜色,默认是Tomato. 用法: 价格位于内层白色通道时入场, 价格触及外层通道则出场。 交易的关键在于选择合适的时间框架。 当然你也可以在这个指标基础上构建你的策略。 Of course, you may create your strategy based on this indicator.
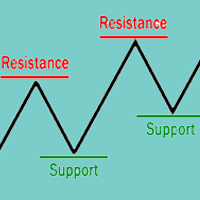
The concepts of support and resistance are undoubtedly two of the most highly discussed attributes of technical analysis and they are often regarded as a subject that is complex by those who are just learning to trade. This article will attempt to clarify the complexity surrounding these concepts by focusing on the basics of what traders need to know. You'll learn that these terms are used by traders to refer to price levels on charts that tend to act as barriers from preventing the price of an

This indicator is different from the conventional indicator by an additional set of parameters. The ADX line changes color depending on the location of the +DI and -DI lines relative to each other.
Indicator Inputs Period — indicator calculation period; Method — select the averaging method: simple, exponential, smoothed, linear-weighted; Apply to — select the applied price: Close, Open; High; Low; Median; Typical; Average Weighted; By default, the directional lines are colored in the following

Magic Moving is a professional indicator for the MetaTrader 4 terminal. Unlike Moving Average , Magic Moving provides better signals and is able to identified prolonged trends. In the indicator, you can set up alerts (alert, email, push), so that you won't miss a single trading signal. MT5 version can be found here You can test the program by downloading the demo version: https://www.mql5.com/en/blogs/post/749430 Advantages of the indicator Perfect for scalping. Generates minimum false signals.

The Commodity Channel Index (CCI) is an oscillator that is often used by forex traders to identify oversold and over bought conditions much in the same way as the RSI or Stochastics.
How it Works The idea behind this indicator is simple, we wait for price to reach an extreme (overbought or oversold) and then trade when price appears to change direction in the hope of catching a move out of the area. Buy signals - The indicator waits for the CCI to become oversold (a value below -100). The indic

Alarm arrow indicator of increased sensitivity After closing the candle the arrows do not disappear Allows you to enter the transaction on time at the lowest price movements Can be used on any currency pairs, metals and cryptocurrency Suitable for working with binary options Distinctive features Does not redraw; Determines the price correction; Advanced settings for fine tuning; Works on all timeframes and on all symbols; Suitable for trading currencies, metals, options and cryptocurrency (Bitco

A classic indicator with advanced features for more accurate display of the market situation. All settings of all moving averages are available, such as the moving average type and the priced used in its calculation. It is also possible to change the appearance of the indicator - line or histogram. Additional parameters provide the ability of fine tuning.
Distinctive features Does not redraw. Additional parameters for fine tuning. Displayed as a line or as a histogram. Works on all timeframes a
Power Index Fx is a new generation indicator that allows an intelligent multi Timeframe analysis. The indicator is flexible and completely customizable. Its positioning in separate window makes it unobtrusive and extremely functional. Its formula of calculation makes it a fundamental tool for identifying possible moments of continuation in favor of Trend. Power Index Fx is a professional tool able to increase your operational potential.
Input Values DASHBOARD SETTINGS How many symbols to show 2

Displays multiple indicators, across multiple timeframes and symbols to give a comprehensive overview of the market. Uniquely, the indicators are configurable and can include custom indicators, even those where you just have the ex4 file or those purchased from Market. Standard indicators can also be selected, the default being ADX, CCI, market price above/below Moving Average (MA), Moving Average Cross (MAX), MACD, Momentum (MOM), OsMA, RSI, Parabolic SAR, William's Percentage Range (WPR). Use

The Bollinger Bands Oscillator is an oscillator based on the "Mastering the Trade" strategy by John Carter. The strategy aims to track the movement from low to high volatility. The Bollinger Bands Oscillator measures the market's momentum. If volatility increases, Bollinger Bands is expanding and encircling the Keltner channel. Bollinger Bands Oscillator uses Bollinger Bands and Keltner Channel. The Momentum indicator is also used as a confirmation of open positions.
Recommendations Currency pa
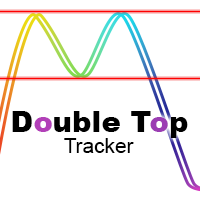
This indicator analyzes in parallel price charts for multiple currency pairs on all timeframes and notifies you as soon as a double tops or double bottoms pattern has been identified.
Definition Double Top / Double Bottom pattern Double Top is a trend reversal pattern which are made up of two consecutive peaks that are more and less equal with a trough in-between. This pattern is a clear illustration of a battle between buyers and sellers. The buyers are attempting to push the security but are
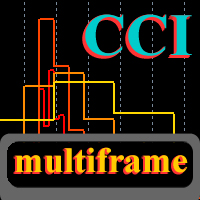
This is a fully multi-timeframe version of the Commodity Channel Index standard indicator, which works for any combination of timeframes. The indicator preserves the correct time scale for all charts at any intervals. When switching to a higher or lower timeframe, the time scale is not distorted. For example, one value of М15 will occupy 15 bars on М1 and 3 bars on М5 . The indicator allows you to see the real dynamics and the overall ratio for all selected periods, as well as accurately evaluat
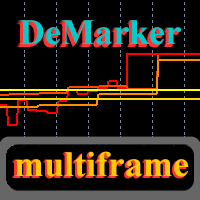
This is a fully multi-timeframe version of the DeMarker standard indicator, which works for any combination of timeframes. Like my other multi-timeframe indicators, it implements the idea of saving the right time scale for all charts on any intervals. When switching to the higher or lower timeframe, the time scale is not distorted. For example, one value of М15 will occupy 15 bars on М1 and 3 bars on М5 . The indicator allows you to see the real dynamics and the overall ratio for all selected pe

Andrews Pitchfork channels is a triple trend channel tool consisting of three lines. In the middle, there is a median trend line on both sides that has two parallel equidistant trend lines.
These lines are usually drawn by selecting three points based on the heights moving from left to right on the response heights or graphs. As with the normal trend lines and channels, the outward trend lines mark potential support and resistance areas.
Parameters Trend_period - the period setting to be calcu

Special Trend Oscillator is an indicator designed to detect trend change points and measure the power of the current trend. This indicator is a different model of the MACD indicator. The indicator has two channels. The blue channel is the upper line of the upward trend. The red channel line is the underscore of the downward trend. Buy when the trend line reaches the red line. Sell when the trend line reaches the blue line. Our Popular Products Super Oscillator HC Cross Signal Super Cross Trend S

The indicator shows the trend of 3 timeframes: higher timeframe; medium timeframe; smaller (current) timeframe, where the indicator is running. The indicator should be launched on a chart with a timeframe smaller than the higher and medium ones. The idea is to use the trend strength when opening positions. Combination of 3 timeframes (smaller, medium, higher) allows the trend to be followed at all levels of the instrument. The higher timeframes are used for calculations. Therefore, sudden change
The Signal SASON indicator is designed to generate trading signals. It works to find potential trade entry points. The signals are found by analyzing a series of candlestick movements and a set of algorithms. This indicator calculates the reversal points of the pair you are using. It does not have deceptive properties like re-painting.
Rules and Features When a signal arrives, it is recommended to use take profit and stop loss level. Use timeframe M15 and up. It works on all currency pairs, exc

The Momentum Channel indicator works according to the daily price index. The indicator is used to analyze the parity price. This analysis is done through channels. channels are used to find trend return points. The indicator has 3 channel lines. these are the lines at 30, 50, and 70 levels. The 70 level is the overbought territory. Price movements in 70 and above indicate that the chart will fall in the near future. Price movements at 30 and below indicate that the chart will rise in near future
Magic Channel is a channel indicator for the MetaTrader 4 terminal. This indicator allows finding the most probable trend reversal points. Unlike most channel indicators, Magic Channel does not redraw. The alert system (alerts, email and push notifications) will help you to simultaneously monitor multiple trading instruments. Attach the indicator to a chart, and the alert will trigger once a signal emerges. With our alerting system, you will never miss a single position opening signal! You can t

This indicator contains a custom version of the classic Turtle Trader indicator. It implements both the main system ( S1 ) and fail-safe system ( S2 ) as described by the original Turtles. Notifications can also be enabled for trade signals. The main rule of the indicator is to generate a signal when a T -period breakout occurs. A stop signal is then generated when an S -period high or low is breached. The T -period value is the number of periods used to evaluate a trend. S -period values are th

The RightTrend indicator shows the direction of trend and reversal points (market entry and exit points). It is very easy to use: open BUY deal when the up arrow appears and open SELL deal when the down arrow appears. The indicator generates accurate and timely signals for entering and exiting the market, which appear on the current candle while it is forming. In spite of apparent simplicity of the indicator, it has complex analytic algorithms which determine trend reversal points.
Inputs stren
The indicator shows buy or sell on the screen when it catches a signal with its own algorithm. The arrows warn the user to buy or sell. Pairs: USDCHF, AUDUSD, USDJPY, GBPJPY, EURUSD, GBPUSD, EURCHF, NZDUSD, EURCHF and EURJPY. You can test the indicator and choose the appropriate symbols. The best results are on M30.
Parameters AlertsOn - send alerts AlertsMessage - send a message AlertsSound - sound alert
AlertsEmail - email alert Buy color - buy color
Sell color - sell color
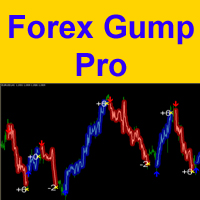
Attention! Friends, since there have been many scammers on the Internet recently selling indicators called ForexGump, we decided to warn you that only on our page is the LICENSE AUTHOR'S VERSION of the INDICATOR sold! We do not sell this indicator on other sites at a price lower than this! All indicators are sold cheaper - fakes! And even more often sold demo versions that stop working in a week! Therefore, in order not to risk your money, buy this indicator only on this site!
Forex Gump Pro is
TrendySignalMt4l is a trend-following indicator that quickly responds to a trend change. The indicator forms the line so that it is always located above or below the chart depending on a trend. This allows using the indicator both for a trend analysis and setting stop loss and take profit. The indicator should be attached in the usual way. It works on any timeframe from M1 to MN and with any trading symbols. The indicator has no configurable inputs.
Recommendations on working with the indicator

三重移动平均线交叉预警指标 是一款 移动平均线交叉指标, 旨在通过结合 快速移动平均线 、 常规移动平均线 和 慢速移动平均线 来分析市场方向。该指标 通过清晰的三重移动平均线结构, 帮助交易者识别 市场趋势 的变化 、潜在的 看涨和看跌行情 以及重要的价格波动区域。该 外汇指标 结合了 技术分析 、 趋势分析 和可自定义的 交易预警 功能 , 为使用 趋势跟踪 、 日内交易 、 超短线交易 和 波段交易 策略 的交易者提供了一种基于图表的简单方法 。三重移动平均线交叉预警指标适用于分析 外汇货币对 、 黄金(XAUUSD) 、 指数 、 加密货币 以及其他使用移动平均线来研究价格行为和市场动能的差价合约工具的交易者。
核心功能 该指标使用三条可自定义的 移动平均线 来构建市场走势的结构化视图。快速移动平均线对近期价格变化反应更迅速,普通移动平均线代表中期走势,而慢速移动平均线则有助于识别更广泛的市场趋势。 当三条移动平均线重合时,该指标会突出显示当前的市场结构,并在图表上直接显示视觉信号。此 移动平均线交叉指标 可帮助交易者观察短期动能相对于长期趋势的变化。 该指标使用用户自定

Quantina Multi Indicator Reader can analyse up to 12 most popular and commonly used together indicators in seconds on any timeframe, on any currency pair, stocks or indices. On the chart panel you can easily read each indicators default meanings and also there is an Indicators Summary on panel.
Features 1 file only: Quantina Multi Indicator Reader is 1 file only. No need to install other indicators to work. It is using the built-in indicators from MetaTrader 4 terminal. Detailed Alert Message:
If you want to add a pattern indicator to confirm the market movement you are in the right place, this indicator permit to detect some famous candle patterns Hammer, Inverted Hammer, Shooting Star, Hanging Man and Engulfing patter that can be highlighted on your chart once the patters occurs. Up, Down arrows are traced at the beginning of the new bar each time a pattern is detected.
Parameters Body to Bar Fraction (%) : the body size / the candle size (20% by default) Max Little Tail Fraction (
Bollinger Bands are volatility bands plotted two standard deviations away from a simple moving average. Volatility is based on the standard deviation, which changes as volatility increases and decreases. The bands expand when volatility increases and narrow when volatility capturing 85%-90% of price action between the upper and lower bands.
How it Works Knowing that the majority of price action is contained within the two bands we wait for price to break out of either the upper or lower band an

隆重推出 Mr. Fibonacci ,这是一个了不起的指标,旨在简化在图表上绘制和调整斐波那契水平的过程。该指标为专业交易者提供特殊的定制选项,使他们能够精确地绘制任何斐波那契水平。此外,它还提供移动通知、电子邮件提醒和价格进入斐波那契水平时的弹出提醒,确保您不会错过潜在的交易机会。 使用此指标,您不再需要持续监控价格走势,直到它触及斐波那契水平。相反,您可以依靠移动通知或电子邮件提醒来随时了解情况。这可以为您节省宝贵的时间,让您可以专注于交易策略的其他方面。此外,斐波那契先生确保斐波那契水平被正确绘制,点对点,这对于准确分析和决策至关重要。 用户友好的界面和快速访问按钮使 Mr. Fibonacci 易于使用和导航。由于其自动调整功能,绘制斐波那契水平变得轻而易举。该指标智能调整每个级别,以适应市场条件的变化。 凭借发送手机、电子邮件和弹出式警报的能力,当价格进入斐波那契水平时,斐波那契先生会通知您。您可以根据自己的喜好和交易风格灵活地激活或停用每种类型的警报。这可确保您以适合您需要的方式接收通知。 斐波那契先生包括技术分析中常用的最重要的斐波那契水平。此外,它还提供自定义选

DailyEntry – Advanced Multi-Indicator Trading System DailyEntry is a professional-grade MetaTrader 4 indicator designed to help traders identify high-probability entry and exit points using a sophisticated combination of daily pivots, trend analysis, momentum oscillators, and Fibonacci retracement levels . This all-in-one tool provides clear visual and audio alerts for buy and sell signals, making it suitable for both beginner and experienced traders looking for a systematic approach to dai

This unique multi-currency strategy simultaneously determines the strength of trends and market entry points, visualizing this using histograms on the chart. The indicator is optimally adapted for trading on the timeframes М5, М15, М30, Н1. For the convenience of users, the indicator renders the entry point (in the form of an arrow), recommended take profit levels (TP1, TP2 with text labels) and the recommended Stop Loss level. The take profit levels (TP1, TP2) are automatically calculated for

STO Currency Strength Meter uses Stochastic Oscillator to monitor how strong a currency is, or in other words, if it's being bought or sold by the majority compared to the other currencies. It displays the strength-lines of the currencies of the pair (base and counter currencies of the chart) with changeable solid lines. Also, you can add up to five additional currencies to the "comparison pool". If you want to look and compare, for example, EUR, USD and JPY, it will only look at the EURUSD, USD

PDP indicator is used for: defining price probability distributions. This allows for a detailed representation of the channel and its borders and forecast the probability of a price appearing at each segment of its fluctuations; defining the channel change moment.
Operation principles and features
PDP analyzes a quote history on lower timeframes and calculates a price probability distribution on higher ones. Forecast algorithms allow the indicator to calculate probability distributions and mov
您知道为什么MetaTrader市场是出售交易策略和技术指标的最佳场所吗?不需要广告或软件保护,没有支付的麻烦。一切都在MetaTrader市场提供。
